


1. Introduction
Better understanding of droplet impacts onto a solid surface is of great importance in many natural and industrial processes (Liang & Mudawar Reference Liang and Mudawar2016). As the droplet gets closer to the solid surface, the lubrication pressure in the thin residual air layer gets high enough to deform the drop, which finally traps an air cushion between the solid and the liquid (Josserand & Thoroddsen Reference Josserand and Thoroddsen2016). Then the air cushion retracts into an air bubble (Liu, Tan & Xu Reference Liu, Tan and Xu2013), which is an issue for printing or coating processes.
Several experimental methods are used for droplet impact investigation: high-speed videos (Thoroddsen, Etoh & Takehara Reference Thoroddsen, Etoh and Takehara2003; Thoroddsen et al. Reference Thoroddsen, Etoh, Takehara, Ootsuka and Hatsuki2005) for visualization of the air-cushion formation and evolution, and interferometry (Liu et al. Reference Liu, Tan and Xu2013; Li & Thoroddsen Reference Li and Thoroddsen2015; Gao, Jung & Pan Reference Gao, Jung and Pan2019) or X-ray imaging (Lee et al. Reference Lee, Weon, Je and Fezzaa2012) for more detailed information, such as the radial profile of the air-cushion local thickness. Importantly, the air-cushion formation and evolution are similar for both a droplet impact onto a solid surface and a solid sphere impact onto a liquid surface (Ermanyuk & Gavrilov Reference Ermanyuk and Gavrilov2011; Marston, Vakarelski & Thoroddsen Reference Marston, Vakarelski and Thoroddsen2011; Hicks et al. Reference Hicks, Ermanyuk, Gavrilov and Purvis2012; Cherdantsev, Gavrilov & Ermanyuk Reference Cherdantsev, Gavrilov and Ermanyuk2021). Several types of impactor geometry have been studied, including a plate (Chuang Reference Chuang1970; Okada & Sumi Reference Okada and Sumi2000; Mayer & Krechetnikov Reference Mayer and Krechetnikov2018), a disk (Ermanyuk & Ohkusu Reference Ermanyuk and Ohkusu2005; Ermanyuk & Gavrilov Reference Ermanyuk and Gavrilov2011; Jain Reference Jain2020; Jain, Vega-Martínez & van der Meer Reference Jain, Vega-Martínez and van der Meer2021b), a wedge (Chuang Reference Chuang1970; Okada & Sumi Reference Okada and Sumi2000; Jain Reference Jain2020; Bagg, Pitto & Allen Reference Bagg, Pitto and Allen2022) and a conus (Chuang & Milne Reference Chuang and Milne1971; Jain Reference Jain2020). The advantage of such studies, as compared to investigation of genuine droplet impacts with flat or structured surface, is the opportunity to observe the evolution of the air cushion at larger spatial and temporal scales. Therefore, it is possible to use relatively simple experimental techniques (Carrat et al. Reference Carrat, Shmakova, Cherdantsev, Gavrilov and Ermanyuk2021; Cherdantsev et al. Reference Cherdantsev, Gavrilov and Ermanyuk2021; Jain, Gauthier & van der Meer Reference Jain, Gauthier and van der Meer2021a) to reconstruct the interface deformation prior to contact. Let us note that the impact of a body onto the free surface of a liquid, with and without an air cushion, is an important problem in numerous engineering applications (Korobkin & Pukhnachov Reference Korobkin and Pukhnachov1988; Ross & Hicks Reference Ross and Hicks2019).
While recent experiments were conducted for a  $10^{\circ }$ deadrise angle conus by Jain (Reference Jain2020), no recent studies have considered the case of low deadrise angles, close to the limiting case of a flat disk. Chuang & Milne (Reference Chuang and Milne1971) performed experiments with a conus of 410 mm diameter and several deadrise angles (1 $^{\circ }$, 3 $^{\circ }$, 6 $^{\circ }$, 10 $^{\circ }$ and 15 $^{\circ }$), where no air cushion was observed for deadrise angles 3 $^{\circ }$ or higher and an impact speed larger than $86.0\ {\rm cm}\ {\rm s}^{-1}$.
This paper presents a study of the air-cushion evolution for coni with low deadrise angles ( ${\leqslant }5^{\circ }$) at low impact speeds ( $<19.0\ \mathrm {cm}\ \mathrm {s}^{-1}$). This range of parameters provides a reasonable compromise, which ensures negligible effects due to finite Froude number, while focusing on the effects of air–water lubrication–inertia balance in the spirit of Hicks et al. (Reference Hicks, Ermanyuk, Gavrilov and Purvis2012), to establish a scaling for the initial radius of the annular touchdown region for a conical geometry. Recent theoretical work (Ross & Hicks Reference Ross and Hicks2019) emphasizes the interest in generalization of the theory of pre-impact gas cushioning to a family of two-dimensional contours described by different power laws (including the case of a wedge), with extension to touchdown time delay due to surface tension effects. The present study uses an axisymmetric conical impactor and two liquids with different surface tensions to provide relevant experimental information.
2. Experimental set-up
A scheme of the experimental set-up and a close-up view of its mechanical parts are shown in figures 1(a) and 1(b). A conus fixed to a steel rod impacts a liquid in a  $465\ \mathrm {mm} \times 470\ \mathrm {mm} \times 290\ \mathrm {mm}$ ( $\mathrm {length} \times \mathrm {width} \times \mathrm {height}$) transparent Plexiglas tank filled to a depth of $160$ mm with distilled water or 2.5 % butanol–water solution (BWS). A list of physical properties of the two liquids is presented in table 1, implying that only the surface tension changes significantly when the butanol is added. Four coni are made from duralumin with different deadrise angles $\beta$ (2 $^{\circ }$, 3 $^{\circ }$, 4 $^{\circ }$ and 5 $^{\circ }$) and a diameter of $D=180$ mm; see figure 1(c). The steel rod is guided by six ball bearings (three at the top and three at the bottom). Four threaded screws are adjusted to ensure that the rod guide is vertical. The steel rod is attached to a stiff wire released by a DC motor. The impact speed is changed by the motor input voltage. The mass of the moving apparatus (the steel rod and the conus) ensures that the impact speed is constant during the impact process.

Figure 1. (a) Scheme of the experimental set-up; (b) detailed view; and (c) geometry of the axisymmetric conus with a diameter of  $D=180$ mm and a deadrise angle $\beta$.
Table 1. Physical properties of the working liquids at  $20\,^{\circ }{\rm C}$.

The impact speed is measured by an infrared system with two infrared cells located at a distance 170 mm from each other. The system computes the time that it takes for an obstacle to pass this distance and shows the estimated speed on a liquid-crystal display screen. The impact speed  $V$ ranges from 1.3 to $19.0\ \mathrm {cm}\ \mathrm{s}^{-1}$ with accuracy $\pm 1\,\%$, giving a range of Reynolds numbers for the liquid $Re_l = (\rho _lVD)/\mu _l = 2000\unicode{x2013}36\,000$ and for the air $Re_g = (\rho _gVD)/\mu _g = 160\unicode{x2013}2300$ and a range of Weber numbers $We = (\rho _lV^{2}D)/\sigma _l = 0.5\unicode{x2013}180$. Herein, $\rho _k$ and $\mu _k$ are the density and the dynamic viscosity of the phase $k$ (gas or liquid), respectively, and $\sigma _l$ is the liquid surface tension. Note that these numbers characterize the set-up globally, while the actual pre-impact air cushioning is studied at the local scale where the global-scale $D$ plays no role, being relevant only for special cases of very low deadrise angle and low impact speed.
Since only the case of a conus with a small deadrise angle is considered, the impact is visualized by using the total internal reflection (TIR) method, described in Jain et al. (Reference Jain, Vega-Martínez and van der Meer2021b) for a flat disk. Without any wetting events at the conus surface, the camera visualizes the reflection of a white plastic plate located in the tank. Otherwise, the wetted area appears black, while the rest of the interface remains white, as shown in figure 2. A Photron SA-Z high-speed camera is used with a frame rate varying from 1000 to 20 000 frames per second and a maximum resolution of 1024 pixels  $\times$ 1024 pixels.

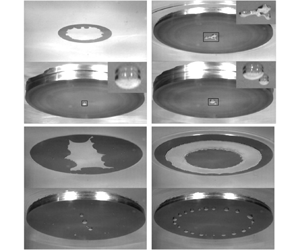
Figure 2. Images of the free surface during impact at different moments after the first contact. (a) Several contact points are located on a ring. (b) The contact points form a ring and trap an air cushion in the centre of the conus. (c) The outer border of the wetted area propagates outwards while the air cushion retracts inwards. (d) The wetted area liquid ring reaches the edge of the conus, where light reflection appears pointwise (indicated by an arrow). (e) The air cushion retracts and the conus is further below the interface. (f) The air cushion collapses into a single bubble at the vertex of the conus. Experimental conditions: BWS,  $V = 4.2\ \mathrm {cm}\ \mathrm {s}^{-1}$ and $\beta = 2^{\circ }$. Readers are also referred to supplementary movie 1 available at https://doi.org/10.1017/jfm.2023.394.
3. Visualization and data processing
A typical series of images illustrating an individual impact event is presented in figure 2 after correction of the optical distortions due to the TIR method (explained later in the text). A movie of this typical impact event is available as supplementary movie 1. Shortly after one contact point occurs, more contact points located on a ring appear, as shown in figure 2(a). These contact points join, form a ring and trap an air cushion between the liquid and the conus surface (see figure 2b). Then the liquid ring outer border propagates and finally reaches the edge of the conus (figure 2d) while the air cushion retracts. Finally, when the radius of the air cushion is very small, it collapses into one or several bubbles attached to the surface of the conus due to surface tension effect, as shown in figure 2(f).
It is important to note that the outer border of the wetted area is smooth while the border of the air cushion is very disturbed. The air cushion appears shifted towards the farther side of the conus, thus creating an impression of different widths between the close and far parts of the liquid ring. There are two reasons behind this effect. First, due to the image perspective, the spatial resolution reduces linearly with the distance from the camera, which reduces the pixel size of a farther object. These changes in spatial resolution at the opposite sides of the object compensate each other by measuring the full diameter of a circular object. In the real world the centres of each circular horizontal cross-section are located on the same vertical line since the set-up is axisymmetric. Hence, this distortion does not affect the results. Second, due to the conical geometry, the same physical length projected on the camera plane would look longer at the closer slope and shorter at the farther slope. Again, the diameter measurements are unaffected by this distortion since the total projection length remains unchanged.
Experiments are performed for a wide range of impact speeds (1.3 to  $19.0\ \mathrm {cm}\ \mathrm {s}^{-1}$), deadrise angles (2 $^{\circ }$, 3 $^{\circ }$, 4 $^{\circ }$ and 5 $^{\circ }$) and two liquids, water and BWS. All the experimental points are regrouped in figure 3 depicting the flow regime map of the air-cushion retraction. Depending on the impact speed and the conus deadrise angle, the result of the air-cushion collapse takes one of the following forms: one bubble, multiple bubbles, trail of bubbles and ring of bubbles in a ‘necklace’ arrangement. Movies of the different bubble patterns are available as supplementary movies 2–5.

Figure 3. Impact speed and deadrise angle maps for (a) water and (b) butanol–water solution (BWS) of the various final air-cushion types: (c) one bubble (supplementary movie 2), (d) multiple bubbles (supplementary movie 3), (e) trail of bubbles (supplementary movie 4) and (f) ring of bubbles in regular ‘necklace’ arrangement (supplementary movie 5). Supplementary movies 4 and 5 show an influence of the finite horizontal size of the conus.
When the air cushion is circular, it retracts and can form one bubble (see figure 3c) or multiple bubbles (see figure 3d) located near the conus centre. Multiple bubbles result from the breaking of the air cushion when it loses its circular shape (see upper image in figure 3d) at the end of the retraction. When the air cushion is very deformed, some parts of it detach during the retraction process, leaving a trail of bubbles as shown in figure 3(e). When the deadrise angle is large and the impact speed is low, the first wetting contact occurs near the centre of the conus together with a liquid rim contact. A similar situation is observed in the model by Ross & Hicks (Reference Ross and Hicks2019) for a wedge impact. For an intermediate range of conditions, the wetting occurred around the vertex and at a larger distance within the same time span, thus trapping a narrow band of air on each side of the wedge. As a consequence, a ring of air is trapped, retracts and breaks into multiple bubbles forming a ring of bubbles in a regular ‘necklace’ pattern (see figure 3f). Such a pattern is also observed by Li et al. (Reference Li, Langley, Tian, Hicks and Thoroddsen2017) for a drop impact on a flat solid surface under reduced air pressure: the central air disk inside the first ring contact is immediately followed by a second ring contact, which entraps an outer toroidal strip of air, which contracts into a ring of bubbles. With the largest angle and the lowest impact speed, there is no air cushion: the wetting contact occurs at the centre of the conus. It is important to note that the regime maps obtained in experiments with distilled water and BWS are similar, suggesting that surface tension plays a secondary (though detectable) role in the studied range of parameters.
The key steps of the image processing are explained in figure 4. The first step is the correction of the ratio between the width  $L_x$ and the height $L_y$ of the rectangle in figure 4(a). The sides of the rectangle are tangent to the ellipse representing the image of the outer border of the circular wetted zone of the conus surface. The rescaled image is shown in figure 4(b). Since the TIR set-up provides images with a sufficiently high contrast between the trapped air cushion and the wetted liquid ring, it is possible to develop an automatic processing for image binarization and measurement of the areas of interest.

Figure 4. Image treatment. (a) Raw image from the TIR set-up, where  $L_x$ and $L_y$ are, respectively, the height and width of the rectangle containing the wetted zone. (b) Image after rescaling. (c) Correction of the uneven light distribution. (d) Binary threshold – the dark area corresponds to the wetted zone. (e) Binary fill – the dark grey area is occupied by the wetted zone and the air cushion. (f) Final image after treatment, with the wetted zone, air cushion and background in black, white and light grey, respectively.
To correct an uneven distribution of light visible, for example, in figure 4(b) in the upper corners, the mean value of at least 100 images before any contact is subtracted from every image (see the resulting image example in figure 4c). The area occupied by the liquid ring (black area in figure 4d) is obtained by a binary threshold. Then the area occupied by both the liquid ring and the air cushion is estimated with a binary fill, shown in dark grey in figure 4(e). This area is subtracted from that occupied by the liquid ring to obtain the area occupied by the air cushion in white (figure 4f). The radius of the air cushion is determined from the radius of a circle with the same area as the region occupied by the air cushion. Since the outer border of the liquid ring is always circular, the radius of this region is measured directly. The evolution of these parameters is shown in figure 5 and discussed below. Before each series of experiments, an image of a polystyrene ruler, which floats at the interface, is taken and is used for the conversion from pixels to millimetres.

Figure 5. Evolution of the radii of the outer border of the wetted area and the air cushion for BWS, V = 4.2 cm s−1 and  $\beta = 2^{\circ }$. The dotted and solid lines, respectively, are for the linear fitting of the liquid outer ring radius (in blue) and the exponential fitting of the air-cushion radius (in orange). At ① the liquid contact is closing into a ring. At ② the liquid outer border reaches the edge of the conus. The time $t = 0$ ms is chosen arbitrarily. All points after ② for the liquid outer ring are not used for analysis and are artefacts from the image treatment.
This section illustrates one example of how the characteristics that are going to be studied in detail in § 4 are estimated. The evolution of the outer liquid ring and air-cushion radii are plotted in figure 5. As evident from figure 5, the outer radius of the wetted area increases linearly with time, from the moment of formation of a closed ring (instant ① in figure 5) that corresponds to figure 2(b) to the moment of reaching the edge of the conus (instant ② in figure 5) that corresponds to figure 2(d). Marston & Thoroddsen (Reference Marston and Thoroddsen2014) observe a similar evolution of the outer radius of the wetted area for different coni with deadrise angle ranging from 24 $^{\circ }$ to 162 $^{\circ }$. The slope of the linear fitting (blue dashed line in figure 5) represents the propagation speed of the outer border of the wetted area, $V_l$. It is possible to calculate $V_l$ for every experimental series of the study, except those where the air cushion forms a ring of bubbles (‘necklace’ pattern), seen in figure 3. All propagation speeds are plotted in figure 6(a).

Figure 6. (a) Velocities of the liquid ring outer border,  $V_l$, obtained by linear fitting of the liquid ring radius as a function of the impact velocity, $V$. (b) Ratio between the velocities of the liquid ring outer border obtained experimentally, $V_l$, and theoretically by the Wagner approach for a conus, $V_w = 4V/({\rm \pi} \tan \beta )$, as a function of the impact speed $V$. The solid and dashed lines are, respectively, the fittings for BWS and water.
Thoroddsen et al. (Reference Thoroddsen, Etoh and Takehara2003, Reference Thoroddsen, Etoh, Takehara, Ootsuka and Hatsuki2005) (water drop impact on a solid surface), Marston et al. (Reference Marston, Vakarelski and Thoroddsen2011) (solid sphere impact onto a liquid pool) and Lee et al. (Reference Lee, Weon, Park, Kim, Pyo, Fezzaa and Je2020) (liquid drop impact on a liquid pool) proposed a model for the air-cushion retraction. In this model the radial velocity of the edge is estimated from a balance between surface tension and inertia, suggesting an exponential fitting for the time history of the air-cushion radius,
 \begin{equation} R(t)= R_0 \times \exp(-t/\tau), \end{equation}
where  $\tau$ is a characteristic time scale and $R_0$ is the initial radius. Such exponential fitting (orange solid line in figure 5) is in very good agreement with the experimental data. The initial radius $R_0$ is defined as the value corresponding to the intersection between the two fittings at an instant $t_0$ as shown in figure 5. For all points and both liquids, the evolution of the air-cushion radius and liquid outer ring follow, respectively, an exponential law and a linear law with reasonable accuracy.
4. Results
Figure 6(a) presents the velocity of the advancing outer front of the zone wetted by liquid  $V_l$ as a function of the impact velocity $V$. The quantity $V_l$ is estimated from linear fitting of the data for the wetted zone outer radius (see the case shown in figure 5). The data presented in figure 6 are plotted for all experimental points from figure 3(a,b) except those corresponding to the cases where a ring of bubbles in ‘necklace’ arrangement is observed or no air cushion occurs. Clearly, $V_l$ closely follows a linear dependence on the impact speed $V$ for each deadrise angle. For the same impact velocity, the outer liquid ring border propagates faster for lower deadrise angles, as observed by Marston & Thoroddsen (Reference Marston and Thoroddsen2014). It is noteworthy that the data obtained in experiments with water and BWS for each value of $\beta$ are in good agreement in spite of the significant difference in surface tension (see table 1), suggesting that this physical quantity may be responsible for secondary effects only, in agreement with Marston & Thoroddsen (Reference Marston and Thoroddsen2014).
Based on the theory of Wagner (Reference Wagner1932) applied for a conus by Schmieden (Reference Schmieden1953), the velocity of the outer contact line  $V_w$ is expressed as
 \begin{equation} V_w= \frac{4}{\rm \pi}\frac{V}{\tan \beta}. \end{equation}
Further developments of the Wagner theory include three-dimensional impact onto a liquid of an inclined conus (Korobkin & Scolan Reference Korobkin and Scolan2006) and a conus with a horizontal speed (Moore et al. Reference Moore, Howison, Ockendon and Oliver2012). Figure 6(b) shows the ratio between the velocities of the liquid ring outer border obtained experimentally ( $V_l$) and theoretically by the Wagner approach for a conus ( $V_w$). For deadrise angles of 3 $^{\circ }$, 4 $^{\circ }$ or 5 $^{\circ }$, the ratio $V_l/V_w$ falls between 0.98 and 1.07. For a deadrise angle of 2 $^{\circ }$ the ratio $V_l/V_w$ is somewhat higher, between 1.07 and 1.12. The Wagner theory agrees well with the experimental measurements despite the air cushion. However, at low impact speeds (below $V=7.0\ \mathrm {cm}\ \mathrm {s}^{-1}$), the ratio $V_l/V_w$ increases, especially for a deadrise angle of 2 $^{\circ }$. This suggests that, at low impact speeds $V$ and deadrise angles $\beta$, the situation gradually switches to the flat-bottom case (Jain et al. Reference Jain, Vega-Martínez and van der Meer2021b), with possible effects due to capillary waves and finite diameter $D$.
$D$.
Figure 7(a) shows the initial radius  $R_0$ (defined in figure 5) as a function of the impact speed $V$. Only the points where the air cushion results in one bubble and have more than 15 points for the exponential fitting are plotted. Once more, the data for water and BWS are in good agreement: the initial radius $R_0$ decreases with the impact speed $V$, so that, with reasonable accuracy, $R_0 \sim V^{-1}$. Qualitatively, a similar dependence is observed for other geometries (see Hicks et al. Reference Hicks, Ermanyuk, Gavrilov and Purvis2012; Cherdantsev et al. Reference Cherdantsev, Gavrilov and Ermanyuk2021; Bagg et al. Reference Bagg, Pitto and Allen2022), but with different exponents in the power law (e.g. $V^{-1/3}$ for the case of the impact of a sphere).

Figure 7. (a) Initial radius  $R_0$ estimated from the intersection of the liquid ring and air-cushion radii fittings as a function of the impact speed $V$. (b) Initial radius $R_0$ as a function of the scaling parameter $A = \mu _g/(\rho _l V \tan ^2 \beta )$.
Let us now discuss how the initial radius  $R_0$ scales with the key parameters of the problem. The following analysis is based on the idea of air–liquid lubrication–inertia balance previously used by Korobkin, Ellis & Smith (Reference Korobkin, Ellis and Smith2008) for a liquid-coated sphere impacting a layer of the same liquid and by Mandre, Mani & Brenner (Reference Mandre, Mani and Brenner2009) for a liquid droplet impacting a flat surface. This approach is adapted here for a conus impact onto a liquid.
First, let us clarify the role of the Froude number in the present experiments. Neglecting the thickness of the air layer, a conus of deadrise angle  $\beta$ accelerates the liquid like a circular flat disk of expanding radius $r_*(t)=Vt/{\tan \beta }$ moving downwards at a constant speed $V$. The added mass of such a disk (in a deep liquid) is $m_a(t) = (4/3)\rho _lr_*^3(t)$, where $\rho _l$ is the liquid density. The inertial force acting on the disk can be evaluated by time-differentiating the liquid impulse $m_aV$, yielding $F_i = V ({\partial m_a}/{\partial t}) \sim \rho _l V^4 t^2/{\tan \beta }$. The relevant pressure scale is obtained by dividing this force by the area ${\rm \pi} r_*^2$, giving $p_i = F_i/({\rm \pi} r_*^2) \sim \rho _l V^2/{\tan \beta }$. The scale of the hydrostatic pressure can be evaluated as $p_h = \rho _l g V t$. The ratio of these pressures yields the time-dependent Froude number, $Fr_*(t) = p_i/p_h \sim V/((\tan \beta ) g t)$. Given the low value of the deadrise angle and time ( $\sim$10 ms), the time-dependent Froude number respects the condition $Fr_*(t) \geqslant 1$, and inertia dominates over buoyancy in the liquid for this study.
Second, since the thickness of the air layer  $\delta$ and the conus deadrise angle $\beta$ are very small, the fluid motion can be described within the lubrication approximation as a squeeze flow of Newtonian fluid with dynamic viscosity $\mu _{g}$ between two disks of radius $r_*$ moving towards one another at a speed $V$. Thus the radial variation of the pressure $p_g$ in the gap between the two disks is expressed as ${\rm d}{p_g}/{\rm d}r = (6r\mu _g/\delta ^3)\,{\rm d}\delta /{\rm d}t$, with $0 < r < r_*$ the radial position. Assuming that just before the contact the gap $\delta$ is related to the radial coordinate as $\delta \sim r_* \tan \beta$, one obtains by integration the scale for pressure ${p_g} \sim \mu _{g}V/(r_* \tan ^3 \beta )$, since $V = {\rm d}\delta /{\rm d}t$. The initial radius of the air cushion, $R_0$, is defined as the moment when the pressure in the liquid is equal to the lubrication pressure in the thin air layer. Thus using $p_i = {p_g}$, one obtains the scaling relation for the initial radius of the air cushion $R_0 \sim A$, where
 \begin{equation} A = \mu_g/(\rho_l V \tan^2 \beta), \end{equation}
with  $\mu _g=1.8\times 10^{-5}\ \mathrm {Pa}\ \mathrm {s}$ the dynamic viscosity of the air at $20\,^{\circ }{\rm C}$.
Plotting the initial radius  $R_0$ as a function of $A$ results in collapse of all experimental points onto a universal straight line as shown in figure 7(b). Table 2 shows the parameters of the relevant linear fittings, separately for water and BWS, and for both liquids without distinction. It is important to note that the intercept $b$ is very small for both liquids and therefore the experimental initial radius $R_0$ is directly proportional to the parameter $A$. With $b$ neglected, the slope coefficient takes a slightly higher value for water, $a=165$, than for BWS, $a=149$, in good qualitative agreement with Ross & Hicks (Reference Ross and Hicks2019), which suggests a delayed touchdown for a liquid with higher surface tension. Note that, if all the points for both liquids are taken into account, the linear fit yields $a=155$. The ‘goodness’ of the linear fit is asserted by the value of the $R^2$ criterion beyond $0.99$.
Table 2. Fitting results of the initial radius  $R_0$ as a function of the parameter $A$. ( $R^2$ is the usual goodness-of-fit measure.)

5. Conclusion
The evolution of the air cushion for a conus with different deadrise angles ( $2^{\circ }$, $3^{\circ }$, $4^{\circ }$ and $5^{\circ }$) impacting a liquid with a wide range of impact speeds ( $1.3\unicode{x2013}19.0\ \mathrm {cm}\ \mathrm {s}^{-1}$) is investigated using a total internal reflection set-up. An air cushion is trapped at the nose of the conus, producing a ring-shaped wetting contact zone. The collapse of the retracting air cushion follows four basic patterns, resulting in (i) single central bubble, (ii) multiple central bubbles, (iii) trail of bubbles, and (iv) ring of bubbles forming a regular ‘pearl necklace’ pattern. Case (iii) occurs for very curved shapes of the receding contact line, while case (iv) occurs when the first wetting contact occurs near the centre of the conus together with a liquid rim contact close to the conus edge. The corresponding flow regime map is similar for distilled water and butanol–water solution.
The radii of the outer (advancing) and inner (receding) boundaries of the wetted region are obtained by automatic image processing using the method of total inner reflection (TIR) described in Jain et al. (Reference Jain, Vega-Martínez and van der Meer2021b). The time histories of the radii can be approximated by linear and exponential (Thoroddsen et al. Reference Thoroddsen, Etoh, Takehara, Ootsuka and Hatsuki2005; Marston et al. Reference Marston, Vakarelski and Thoroddsen2011; Mayer & Krechetnikov Reference Mayer and Krechetnikov2018) fits, respectively. The intersection of the relevant fitting lines is used as the definition of the initial radius of the touchdown region. The velocity of the liquid ring outer border agrees well with the Wagner theory despite the air cushion. Taking into account the air cushion in the Wagner theory, Moore (Reference Moore2021) shows that the air-cushion effect is important just after touchdown. As time increases, this effect becomes negligible and the classical Wagner theory gives very good results.
Using the idea of air–liquid lubrication–inertia balance in the spirit of Hicks & Purvis (Reference Hicks and Purvis2010) and Ross & Hicks (Reference Ross and Hicks2019), one can expect a universal scaling for the initial radius of the air cushion based on the key parameters of the problem. Indeed, the initial radius of the air cushion is found to be directly proportional to the air dynamic viscosity, and inversely proportional to the liquid density, impact velocity and square of the deadrise angle. The role of surface tension is found to be relatively weak. In agreement with Ross & Hicks (Reference Ross and Hicks2019), it produces a delay of the touchdown between the impacting conus and a liquid due to finite curvature of the tip of the liquid rim.
Supplementary movies
Supplementary movies are available at https://doi.org/10.1017/jfm.2023.394.
Acknowledgements
The authors would like to thank A.S. Kizhevatov and A.V. Silaev for help with the experiments and the construction of the experimental set-up. The authors are grateful to the referees for their constructive comments and to A.A. Korobkin and T.I. Khabakhpasheva for discussions.
Funding
The research was carried out under a State Budget contract with Lavrentiev Institute of Hydrodynamics (project FWGG-2021-0011) and Kutateladze Institute of Thermophysics (project 1021052404413-3).
Declaration of interests
The authors report no conflict of interest.
Data availability statement
The data that support the findings of this study are available from the corresponding author upon reasonable request.
Author contributions
Conceptualization, J.-B.C., A.C. and E.E.; methodology, J.-B.C.; software, J.-B.C.; validation, J.-B.C., N.G., A.C., N.S. and E.E.; formal analysis, J.-B.C., A.C. and E.E.; investigation, J.-B.C.; resources, J.-B.C., N.G., A.C., N.S. and E.E.; data curation, J.-B.C. and N.G.; writing – original draft preparation, J.-B.C.; writing – review and editing, J.-B.C., N.G., A.C., N.S. and E.E.; visualization, J.-B.C.; supervision, E.E. and A.C.; project administration, E.E.; and funding acquisition, E.E. All authors have read and agreed to the published version of the manuscript.


