


Broadberry, Guan, and Li (Reference Broadberry, Guan and Li2018) set out to answer a specific question about the timing of the Great Divergence. Along the way, we produced a set of estimates of GDP per capita for China at a decadal frequency and based on data recorded at the time. Inevitably, these estimates were more uncertain than those for European and North American nations in the modern era, partly because of the greater volume and reliability of the quantitative archival data that has survived in the West, and partly because of the more limited amount of quantitative historical work that has already been undertaken with the Chinese data. We duly acknowledged this by reporting subjective error margins and conducting sensitivity analysis, and we remain open to suggestions for improving our estimates of Chinese GDP per capita. We are grateful to Solar (Reference Solar2021) for pointing out a problem with the government output series, which implied too high a share of government in constant 1840 prices, particularly during the Ming dynasty. Here we provide an updated version of our GDP per capita series for China that deals with this problem. In our revised estimates, Chinese GDP per capita is smaller by an average of 2.6 percent in the Northern Song dynasty (980–1120), 13.8 percent during the Ming dynasty (1400–1620), and 2.3 (1690–1840) percent in the Qing dynasty. Contrary to the claims of Solar, however, these changes do not affect the timing of the Great Divergence, which began during the Qing dynasty.
GOVERNMENT SERVICES
Our basic method is to project backward from an 1840 benchmark of GDP, broken down by sector, using indices of real output in each sector. For all sectors other than government, we used data on the volume of output. For government services, however, we relied on nominal spending deflated by a general price index. Solar casts some doubt on the series by calculating implied sectoral shares in 1840 prices. He notes that in 1840 prices, the share of government in GDP rose above 15 percent in the late Northern Song dynasty and was above this level throughout the Ming dynasty, peaking at 35 percent in the early fifteenth century. Although the government can account for a smaller share of GDP in current prices than in constant prices if relative prices changed, we agree that the scale of the fluctuations here is too large. Hence we went back to the original sources and critically re-examined our series.
Broadberry, Guan, and Li (Reference Broadberry, Guan and Li2018) estimated government services by collecting data on the expenditure on soldiers and civil servants and deflating this by a general price index. This remains the case for the Qing period. Unfortunately, the data that we used from the Ming shilu and Wanli kuaiji lu also covered other elements of state spending and therefore recorded too high a level of expenditure in the Ming.Footnote 1 We have corrected this over-estimation by noting that data from Wanli Kuaiji lu suggest that expenditure on soldiers and civil servants was 60 percent of total government expenditure in 1578 and that total expenditure for that year (18.5 million silver tael) was very similar to the land tax revenue for that year (18.8 million silver tael, interpolated between the observations for 1571 and 1602). We, therefore, used the land tax revenue series scaled back to 60 percent of its level, deflated by the price index, as the indicator of government services. This makes the Ming data broadly comparable with the data for the Northern Song and Qing dynasties, based only on the pay of soldiers and civil servants. The other 40 percent of government expenditure was consumption of the local royal family and palace, which is not relevant for the provision of government services in public administration and defense. We are assuming that the 60 percent ratio stayed constant, but this seems reasonable given that the Empire was at peace throughout this period and the land tax regime was stable between the major land surveys of the Hongwu Emperor in 1398 and the Wanli Emperor in 1578 (Perkins Reference Perkins1969, p. 222).
The major change is to the Ming dynasty data, but we have also taken the opportunity to revise the data on government services in the Northern Song dynasty, for which we have data on the numbers of soldiers and civil servants, as well as their pay. For consistency with data from other dynasties, we had confined our attention to money payments, but given the rather rough nature of the price deflator, we now prefer to use the number of soldiers and civil servants as the measure of real government services for this dynasty.
The new series for real government services (Gov new) is presented in Figure 1 together with the old series (Gov old) from Broadberry, Guan, and Li (Reference Broadberry, Guan and Li2018). Both series are the same for the Qing dynasty, but the old series shows a sharp increase during the later years of the Northern Song dynasty and remains at a high level throughout the Ming dynasty. The new series removes this anomaly and produces a less erratic path for government services across the three dynasties.
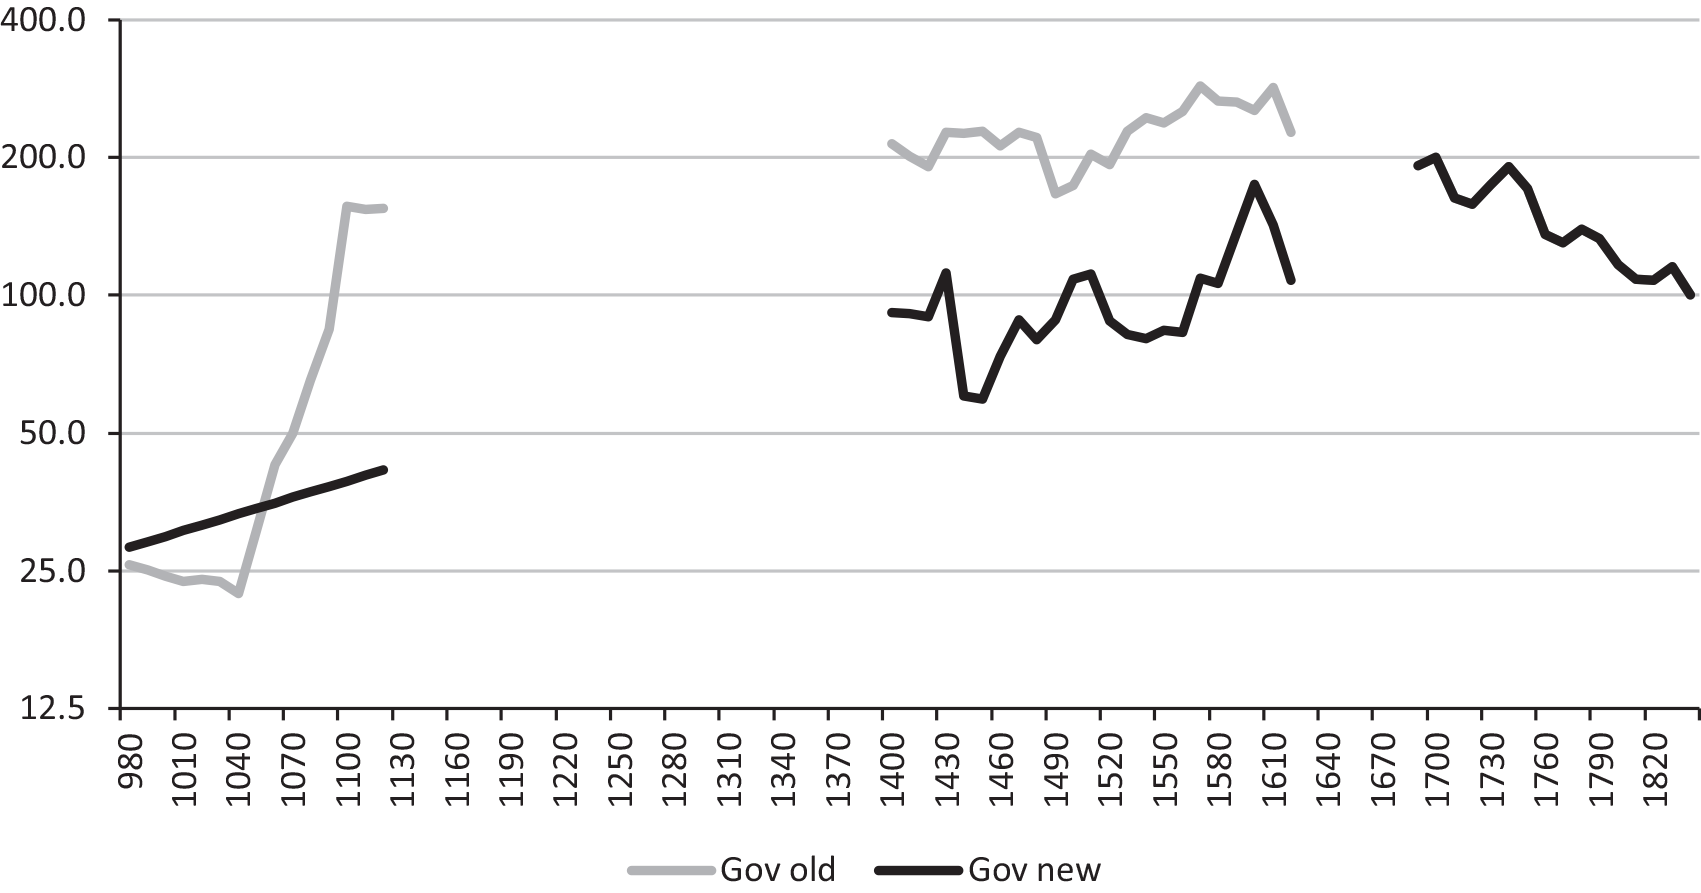
Figure 1. REAL GOVERNMENT SERVICES IN CHINA, 980–1840 (1840=100)
Sources: Gov old: Broadberry, Guan, and Li (Reference Broadberry, Guan and Li2018). Gov new: See text for details.
Another reason for the high share of government during the Ming period in our original estimates was its weight in the benchmark year of 1840. We now think that our original estimates over-weighted the government sector and have lowered its share to 2.1 percent, in line with the share suggested by Liu (Reference Liu2009). It should be emphasized that although the shares of industry and services in our benchmark are taken from a study by Zhang (Reference Zhang1987) for the 1880s, the nominal GDP in 1840 is anchored in the value of agricultural output derived from crop output and prices for that year. Solar is, therefore, wrong to state that our 1840 benchmark is based on an extrapolation from the 1880s to 1840 using only a series for grain output. Our use of Zhang’s sectoral share estimates was dictated by the more detailed breakdown within industry than in other benchmarks, combined with the broad stability of the breakdown between agriculture, industry, and services in alternative estimates of sectoral shares for the nineteenth and early twentieth centuries. However, drawing on Ma and de Jong’s (2019) useful comparison of four benchmarks between 1840 and 1933, we now see that Zhang’s benchmark stands out as overweighting government and have reduced its share accordingly to the 2.1 percent suggested by Liu (Reference Liu2009), and increased the share of commerce by an offsetting amount. Our amended weighting scheme is presented in Table 1. This reduction in the share of government services in the base year brings their implied peak share in 1400 down to 8.6 percent, still high relative to the early nineteenth century but a much more reasonable magnitude.
Table 1. 1840 GDP WEIGHTS FOR CHINA

Sources: Broadberry, Guan, and Li (Reference Broadberry, Guan and Li2018, p. 973), amended as described in the text.
Before re-estimating Chinese GDP, we take the opportunity to adjust the agricultural sector during the Ming dynasty to bring our estimates in line with the recent research of Shi (Reference Shi2015) for all three dynasties. The main focus of Shi’s research was the Qing dynasty, where we had already adopted his estimates of the cultivated land area. However, Shi also included estimates of the cultivated land area in 1600 and 1072. Our old estimates for the Northern Song dynasty are consistent with Shi’s figure of 660 million mu in 1072, but our old estimates for the Ming dynasty are not consistent with his figure of 830 million mu in 1600. Our previous estimate of the cultivated area in 1600 was 760 million mu, so this involves raising the Ming cultivated area by 9.2 percent. The revised land series is plotted together with the old series in Figure 2.Footnote 2
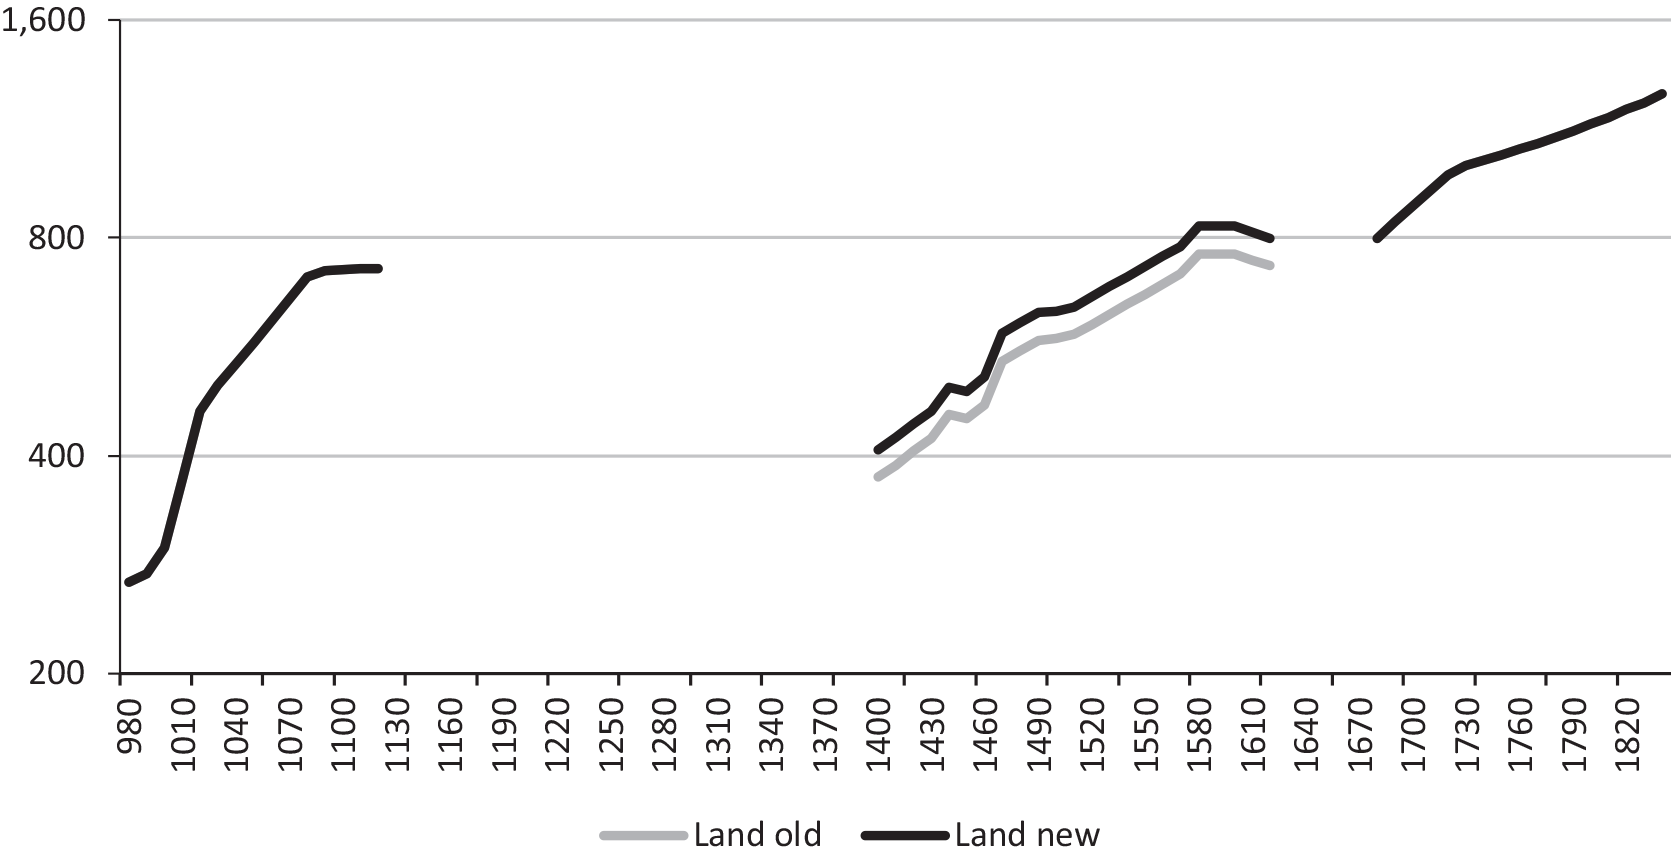
Figure 2. CULTIVATED LAND IN CHINA, 980–1840 (MILLION MU)
Sources: Land old: Broadberry, Guan, and Li (Reference Broadberry, Guan and Li2018). Land new: See text for details.
IMPLICATIONS FOR THE GREAT DIVERGENCE
Combining the new estimates of government spending with the revised cultivated land area produces the changes in per capita GDP shown in Figure 3. The revised series for aggregate GDP and its main sectoral components are provided in Appendix 1, together with population and GDP per capita. The replication file can be downloaded from Reference Broadberry, Guan and LiBroadberry, Guan, and Li (2021). Compared with our 2018 estimates, Chinese GDP per capita is smaller by an average of just 2.6 percent in the Northern Song dynasty and 2.3 percent in the Qing dynasty. Although the difference averages 13.8 percent for the Ming dynasty as a whole, this falls to 10.5 percent during the decades after 1490. Both figures are within the ±5 to 15 percent subjective error margins offered for Ming GDP by Broadberry, Guan, and Li (Reference Broadberry, Guan and Li2018, p. 980). Solar is thus correct in pointing to the general reduction of the level of GDP per capita during the Ming dynasty relative to the Northern Song dynasty, but the scale of the difference is not as large as he suggests, and the peak level during the early Qing dynasty is just as high as during the Northern Song peak. As a result, these changes do not affect the timing of the Great Divergence, which was the primary concern of our paper. This is because GDP per capita for the period after 1690 is very little changed, and we claimed that the Great Divergence emerged only after 1700.

Figure 3. REAL GDP PER CAPITA IN CHINA, 980–1840 (1990 INTERNATIONAL DOLLARS)
Sources: GDP p.c old: Broadberry, Guan, and Li (Reference Broadberry, Guan and Li2018). GDP p.c. new: See text for details.
Solar’s concerns about the government series were motivated by his observation that the implied share of government in constant prices was too high in some years, particularly during the Ming dynasty, thus also distorting the shares of agriculture, industry, and services. Accordingly, we have included Table 2, setting out the implied shares of agriculture, industry, and services for six benchmark years at the beginning and end of each dynasty. The final column tracks the share of government. There is now a high degree of stability in the shares of agriculture, industry, and services and much reduced fluctuations in the share of government. Furthermore, the peak share of government at 8.6 percent occurs at the start of the Ming dynasty, which Liu (Reference Liu2015, p. 49) characterizes as “the largest command economy in the pre-industrial world.”Footnote 3
Table 2. IMPLIED SECTORAL SHARES OF GDP AT CONSTANT 1840 PRICES, CHINA 980–1840 (%)

Source: Derived from Appendix Table 1.
Figure 4 also plots GDP per capita in the leading Chinese region, together with the series for the leading European nation (Italy to 1540, the Netherlands between 1540 and 1800, and Britain from 1800). It is important to realize that the level of per capita GDP in our China leader series was obtained from Li and van Zanden’s (2012) comparison between the Yangzi delta and the Netherlands and is independent of our benchmark for China as a whole. This ratio of 1.75 is then projected back in time, on the assumption that there was always one Chinese region that had GDP per capita higher than the Chinese average by this ratio.Footnote 4 Bearing in mind that the European leader was as small in terms of territory and population as the Netherlands between 1540 and 1800, this must be regarded as a conservative assumption. Solar’s series will be discussed in the next section. Note that our new China leader series remains in touch with the European leader until around 1700 and the first half of the eighteenth century remains a critical juncture. This is despite the fact that for China as a whole, GDP per capita was just 55 percent of the level of the European leader in 1700. Regional variation makes a huge difference, and this matters because the population of China was vastly larger than the population of any European nation. In 1700, for example, the Chinese population was 138 million, compared with just 13.3 million in Italy, 6.2 million in Great Britain, and 1.9 million in the Netherlands (Maddison Reference Maddison2010).
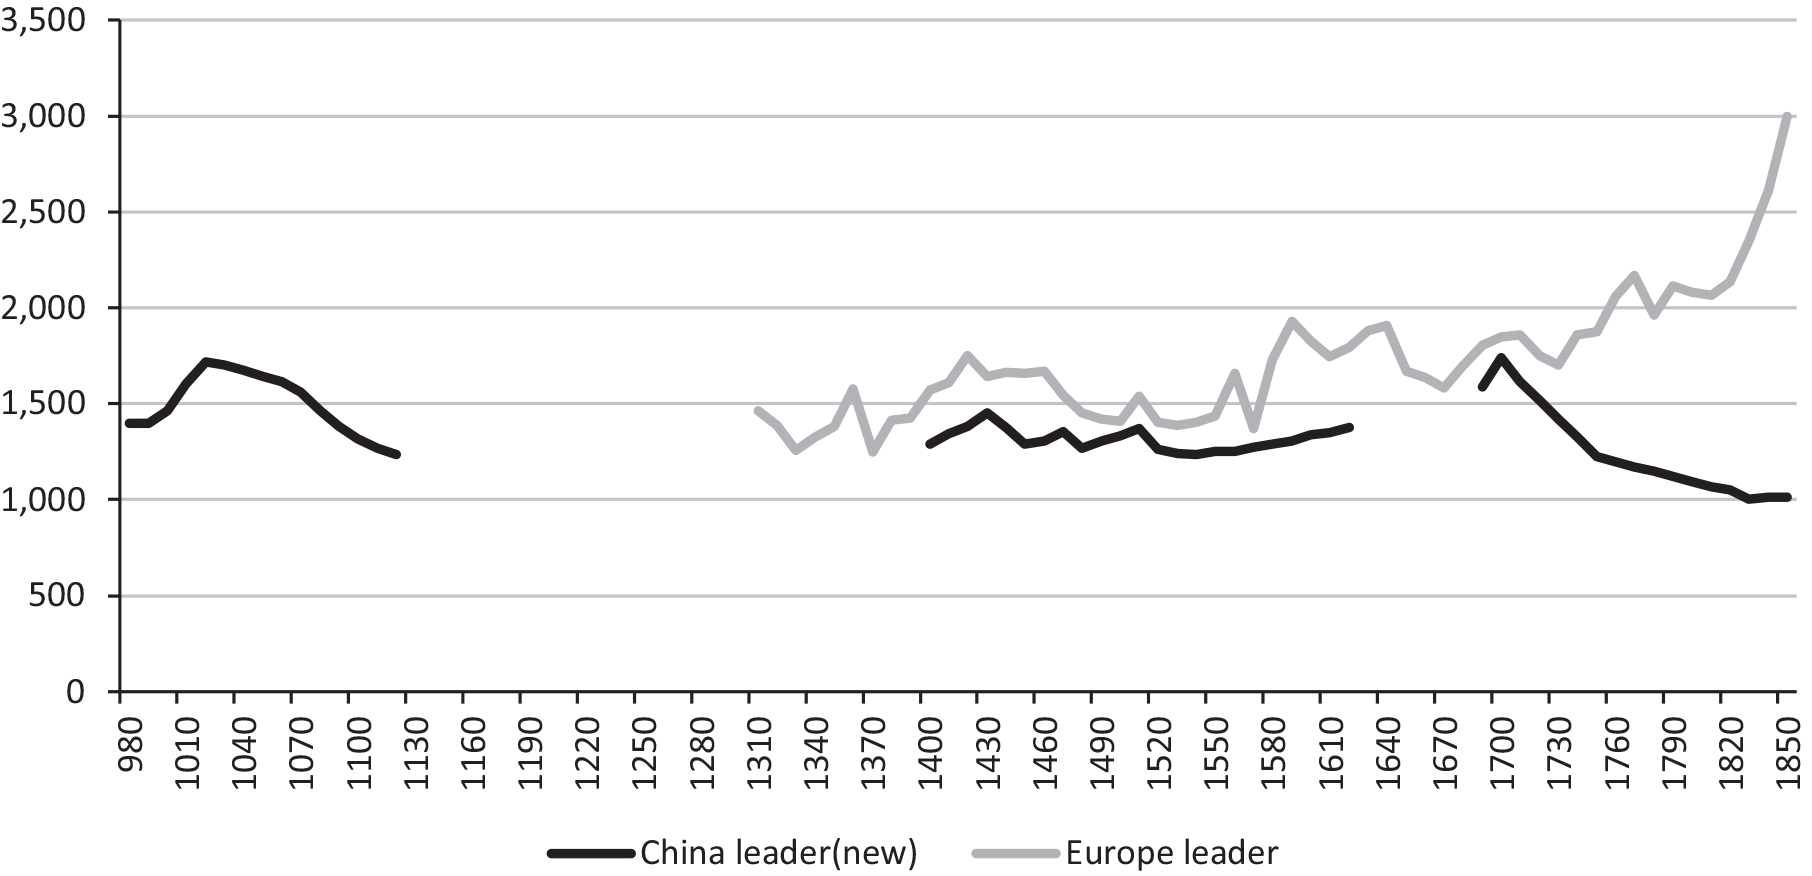
Figure 4. GDP PER CAPITA IN THE LEADING REGIONS OF EUROPE AND CHINA, 1300–1850 (1990 INTERNATIONAL DOLLARS)
Sources: Europe leader: Broadberry, Guan, and Li (Reference Broadberry, Guan and Li2018). China leader (new): See text for details.
SOLAR’S ESTIMATES AND INTERPRETATION
Solar presents revised estimates of GDP per capita in China as a whole and in the Yangzi delta, which he treats as the leading region throughout the period, in line with our earlier paper. He interprets his estimates of the leading Chinese region as inconsistent with our conclusions and offers an alternative narrative of the Great Divergence. Here, we point out that his Yangzi estimates fall within the range bounded by the high and low Yangzi estimates in Broadberry, Guan, and Li (Reference Broadberry, Guan and Li2018) and question his alternative interpretation.
To obtain his mid-nineteenth century benchmark for the Yangzi delta, Solar uses our ratio of 75 percent above the level for China as a whole, but applies it to a benchmark for China of $535, or 11 percent lower than our figure of $600 in 1990 international dollars. There are a number of problems with this procedure. First, as noted earlier, this is not consistent with the way that the Yangzi benchmark was obtained, from a direct comparison between the Yangzi delta and the Netherlands. Strictly speaking, lowering the benchmark for China as a whole should increase the ratio of Yangzi to average Chinese per capita income rather than lower the level of Yangzi per capita income. Secondly, however, having chided us for projecting back from the 1880s to 1840 for our benchmark, Solar now makes use of an 1850 benchmark which has been obtained by projecting back from Ma and de Jong’s (2019) benchmark for 1912. However, this figure of $535 in 1850 is actually higher than the figure of $470 for the 1850 benchmark that we allowed for when calculating our lower bound estimate for the Yangzi delta. Thus Solar’s estimate falls between our high and low estimates for the leading Chinese region and is therefore not something we regard as troubling.Footnote 5 As in Broadberry, Guan, and Li (Reference Broadberry, Guan and Li2018), our revised figures are consistent with the Great Divergence occurring only after 1700.
Given the error margins in the data, we limited our findings on the Great Divergence to the observation that China only fell behind Europe decisively after 1700, and we stand by that judgement after revising the series for government services. Figure 4 makes clear that developments after 1700 merit the use of the term Great Divergence, whereas earlier developments do not justify Solar’s multiplication of the Greats. We do not see how Solar’s Figure 3 can possibly be said to establish a “Great Crossing” in the middle ages without any data on the European leader before 1300 and a gap of 280 years in the Chinese data. Neither do we think it is appropriate to describe the volatility of the seventeenth century in both Europe and China, somewhat visible in our decadal data but totally smoothed away in Solar’s Figure 3, as a “Great Convergence.”
Solar attempts to suggest that the high level of GDP per capita in China during the early Qing dynasty may be an artifact of our choice of population series. However, he is thwarted in this by the limited scale of disagreement between most economic historians of China over the level of the population during the Qing dynasty. The only population estimates that differ significantly are those of Deng (Reference Deng2004), which, if combined with our GDP estimates, would imply an unrealistically high level of GDP per capita during the Ming dynasty. Solar still tries to make the most of the small differences between our estimates and those of other scholars, but his Table 2 and Figure 4 paint a misleading picture, based on the selective use of the data. Our Figure 5 plots Shi’s (Reference Shi2020) benchmark estimates for 1661, 1685, 1724, 1766, and 1812 together with our interpolated data for the same years. Plotting the two series together on the same basis makes clear that our series is not based on a higher rate of growth during the early Qing period, and our population estimates around the year 1700 are no lower than Shi’s. None of the population estimates considered by Solar can possibly make the existing GDP estimates consistent with his suggestion of a Great Divergence from the fifteenth or sixteenth century.
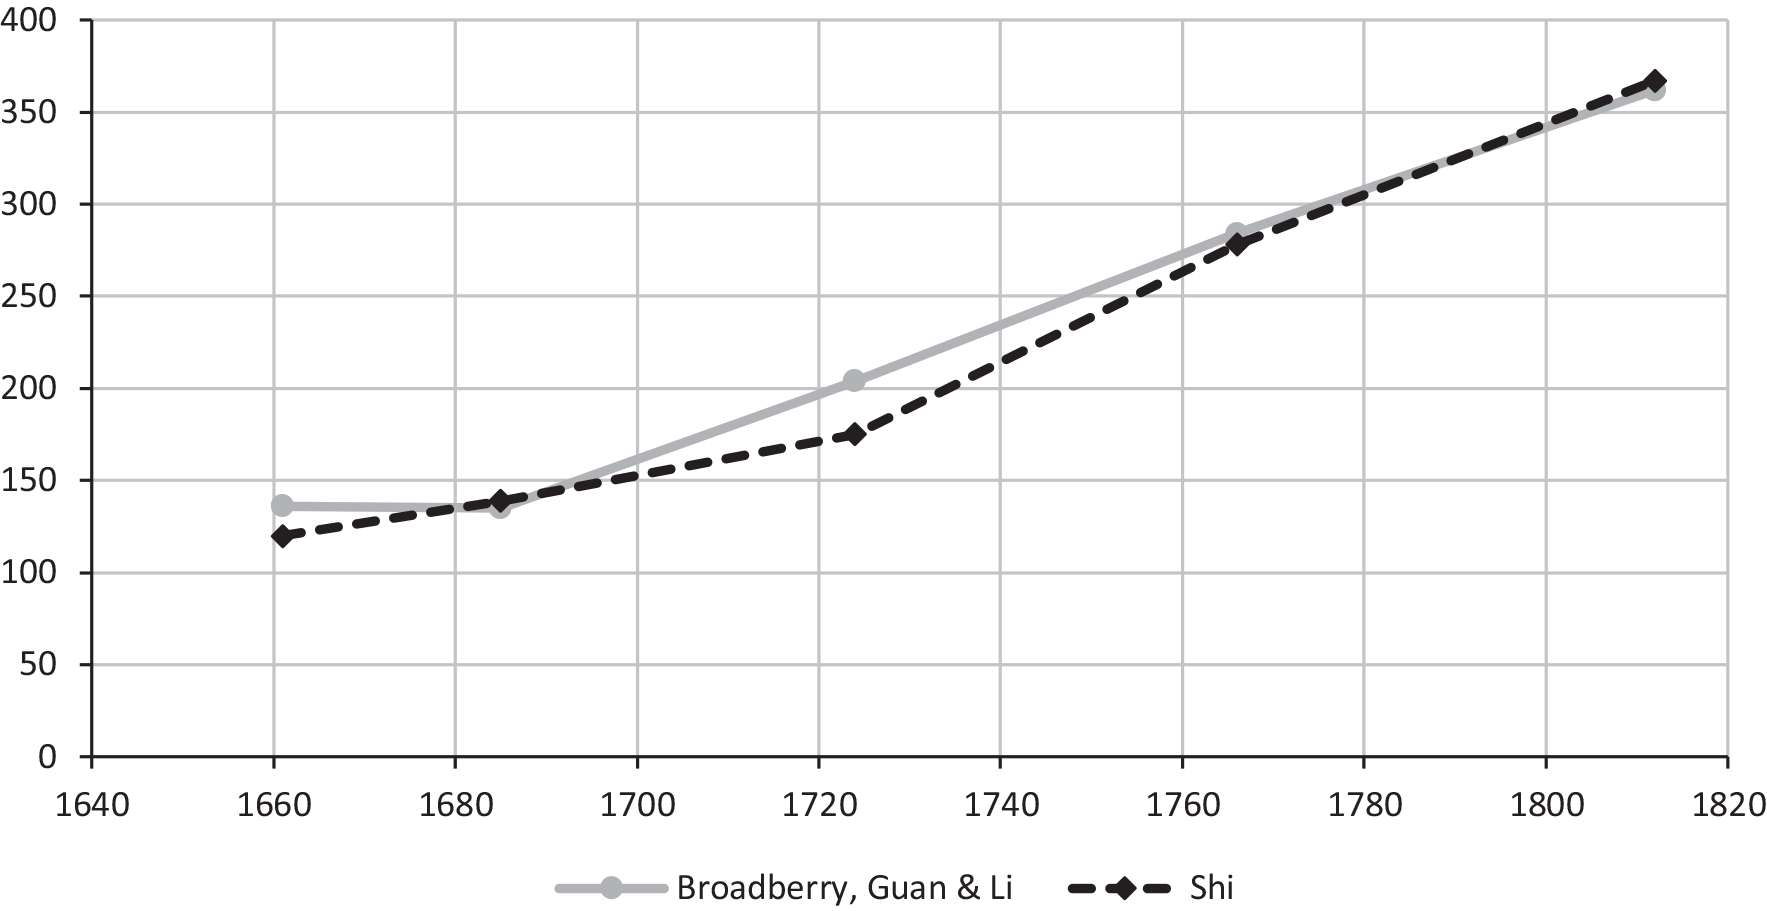
Figure 5. ALTERNATIVE ESTIMATES OF CHINESE POPULATION DURING THE QING DYNASTY (MILLIONS)
Sources: Broadberry, Guan, and Li (Reference Broadberry, Guan and Li2018); Shi (Reference Shi2020, p. 181).
The importance of 1700 as the critical juncture in the Great Divergence is also supported by other evidence on wages and prices and the timing of the transition to modern economic growth in northwest Europe. Broadberry and Gupta (2006) note how the grain wage in the rich regions of both China and India remained close to the levels of Britain and the Netherlands until the end of the seventeenth century. Broadberry et al. (Reference Broadberry, Campbell, Klein, Overton and van Leeuwen2015) note that although Britain experienced growth phases during the second half of the fourteenth century and the second half of the seventeenth, these were not modern economic growth because they were accompanied by a falling population. Only with the return to population growth around 1700 and the continued per capita income growth was the breakthrough to modern economic growth achieved.
Solar cautions against the large role played by grain output, population, and urbanization in our estimation of Chinese GDP. His reasoning here is based on the example of England, where per capita grain output remained flat despite rising GDP per capita as the economy went through a process of economic development, structural change, and extensive participation in international trade. However, there can be no suggestion that these conditions apply to China during the period under consideration here, since there is abundant evidence that mid-nineteenth-century China was a poor, largely agricultural economy not far above subsistence. The only issue is, therefore, whether China was once richer, which leaves open the possibility of a late Great Divergence. This is, in fact, our principal finding, but there are practical limits to the possible level of per capita GDP achieved in the pre-industrial world due to energy constraints. For small nation-states, the effective ceiling for per capita GDP before the Industrial Revolution lies in the range of $1,500 to $2,000 in 1990 international dollars (Bolt and van Zanden 2014). Given the huge scale of China and the observed regional variation in the nineteenth century, GDP per capita for China as a whole could not have been much more than $1,000 during the Northern Song and Ming dynasties, leaving room for a GDP per capita in the leading Chinese region of $1,500 to $2,000. This also leaves room for a decline of GDP per capita for China as a whole from $1,000 during the Northern Song to $600 by the mid-Qing dynasty, driven by a decline in cultivated land per capita as the population expanded.
We can agree in general with Solar that improving the series for population, agriculture, industry, and services are important priorities in Chinese historical national accounting. However, the points raised by Solar towards the end of his comment do not make a material difference. First, within agriculture, Xu et al. (Reference Xu, Zhihong, Bas, Yuping, Zipeng and Ye2017) make explicit allowance for cash crops during the Qing dynasty, when they grew in importance, but their GDP per capita series moves very closely in line with ours where the two series overlap. Second, in a large continental economy like China, imports and exports together accounted for less than 1 percent of GDP before 1800, drastically limiting the effect that exports of silk, cotton, and ceramics could have had on overall GDP (Brandt, Rawski, and Ma 2014, p. 55). Third, there is a large Chinese language literature on salt production in China covering the three dynasties, and the changing levels of production in this very large industry can be explained by the expansion of production in different regions, a fuel shortage, technological change, and relaxation in the degree of state control (Guo Reference Guo1997; Liu Reference Liu1996).Footnote 6
Important as improving the estimates for aggregate Chinese GDP may be, in terms of the Great Divergence debate, we think that what is most needed is a more detailed picture of regional variation within China. For Europe, there are now estimates of GDP per capita for many small regions and national economies covering the period between the fourteenth and nineteenth centuries, and to pin down the Great Divergence more fully, we need similar information on China.
Appendix Table 1 REVISED MAIN DATA SERIES (1840=100)
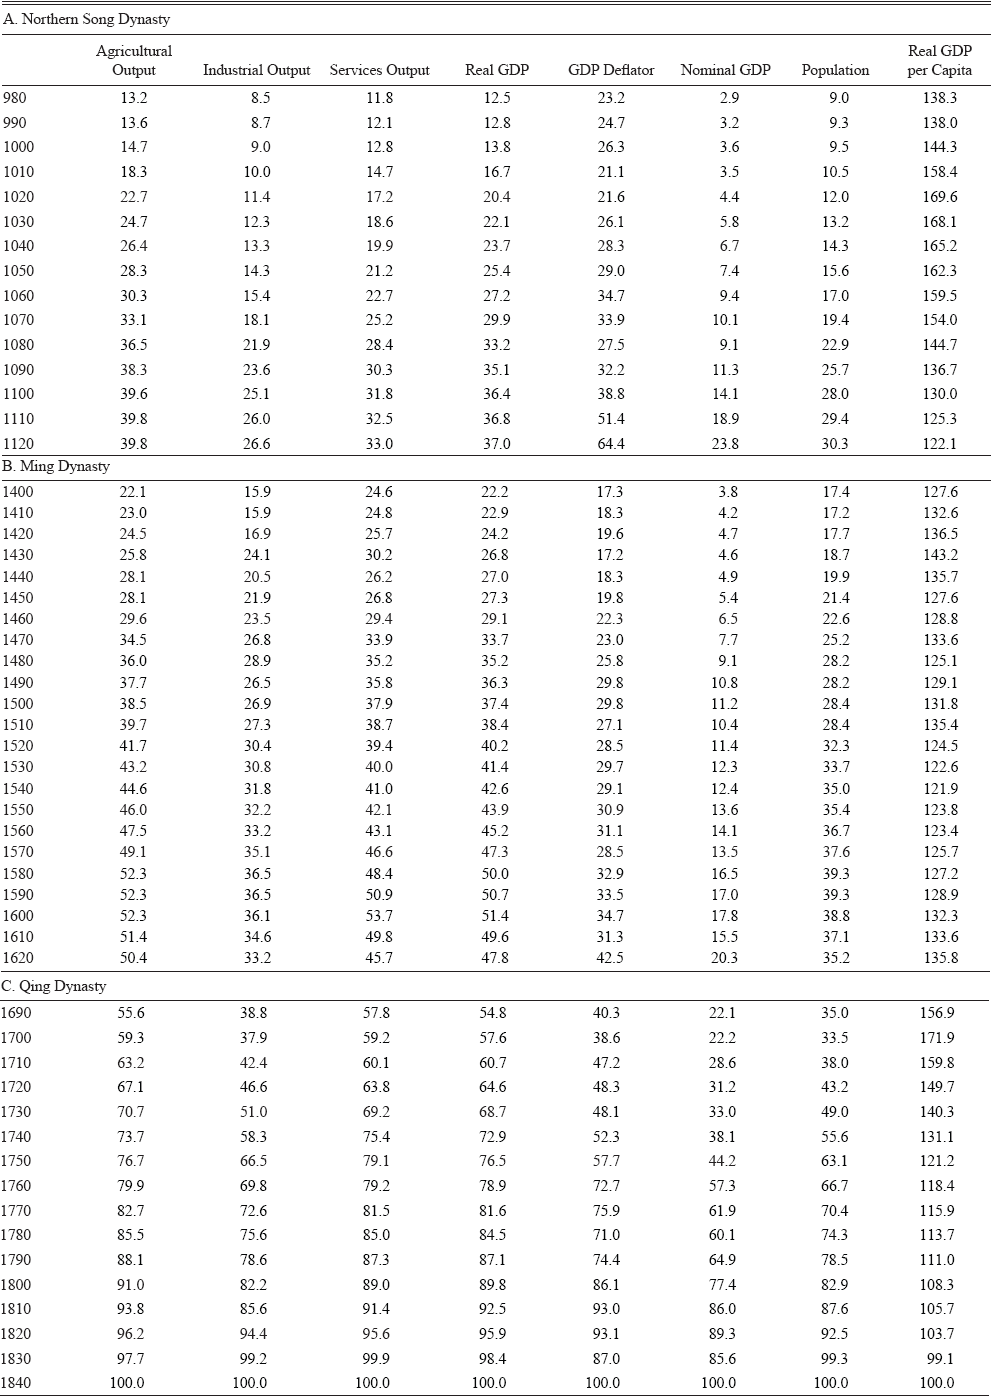
Source: Broadberry, Guan, and Li (Reference Broadberry, Guan and Li2018), amended as described in the text.


