

Introduction
Research participants’ perceptions of their experiences during a research study can be used to design and test processes to improve their experiences, and possibly improve study recruitment, retention, and research integrity as well. Administering validated surveys to patients about their experiences is now standard in patient care environments, but administering such surveys to research participants is relatively new and experience is thus far limited [Reference Kost1]. Barriers to implementation vary by the mode of survey administration and include cost, navigating privacy issues and logistics to identify research participants, and low response rates. It is not clear how to best administer the survey in an academic medical center. The goal of this study was to determine the most effective method, at our academic medical center, for sampling participants’ perceptions of their research experiences.
The administration of surveys has evolved from traditional approaches (mailing and phone) to include electronic approaches (email and internet). Since 74% of North Carolinians (and 77% of all US households) have internet access and an email application on a home computer, much of our population should be reachable through email or internet-related methods [Reference Ryan and Lewis2]. Nonetheless, response rates to online surveys are up to 10% lower than for mail or phone surveys, and as low as 5% [Reference Fan and Yan3–Reference Sinclair5]. A patient portal—a secure online Web site that gives patients access to personal health information from anywhere with an internet connection—is a new opportunity to contact patients and potential research participants. The purpose of the patient portal is to allow efficient access to test results, appointment details, and to communicate with the provider. Increasingly, such portals are being used to collect patient-reported outcome measures as part of clinical care [Reference Wagner6]. However, there is a dearth of information about using patient portals to collect data on participant-centered research experiences. Thus, to fill this evidence gap, we compared 2 traditional methods of survey delivery (mail and interview by phone) with 2 electronic methods of delivery (email and patient portal). Outcomes include response rates, completeness, cost of implementing, and overall rating score using the Research Participant Perception Survey across these 4 modes of delivery.
Materials and Methods
Study Instrument
Our survey combined the validated Research Participants Perception Survey—Ultrashort Version [Reference Kost and Correa de Rosa7] with 6 additional questions drawn from the validated longer version of the survey [Reference Kost1] (online Supplementary Material). This 20-item survey is estimated to take less than 5 minutes to complete when administered on paper or computer, and slightly longer when administered as an interview by phone. A Spanish-language version of the survey was provided to individuals whose medical record listed Spanish as their primary language. This study was approved by the Institutional Review Board with a waiver of signed consent. Participants indicated consent to participate within the survey tool by checking a box.
Sampling
All persons who enroll in a clinical research study at Wake Forest Baptist Health (WFBH) are tracked in its electronic health records system (Epic Systems, Verona, WI, USA). We extracted a list of those who had participated in (and consented for) one or more IRB-approved clinical research studies at WFBH between January 1 and August 31, 2016 and had provided contact information for one or more of the delivery methods: email, phone number, address, or patient portal account. Other eligibility criteria included: age 18 years or older, or caregiver of a research participant aged 17 years or younger; caregiver of research participant with memory problems; and English or Spanish language spoken. For all approaches in which the selected research participant was <18 years of age, the caregiver was asked to respond for the child, with the exception of the patient portal for which accounts are not available to persons <18 years.
Of the 4013 records obtained, 100% had a mailing address, 99% had a phone number, 60% had an email address, and 39% had a patient portal account active in the last 6 months. Among these, 200 were randomly selected from each of the 4 groups with complete contact information for that group: 200 from 4013 with mailing addresses, 200 from 3992 with phone numbers, 200 from 2416 with email addresses, and 200 from 1556 with patient portal accounts. No individual was selected for more than one delivery method. This sample size was selected to allow us to detect differences of 5% between response rates with 95% confidence.
Implementation
Participants were mailed an introductory letter and the survey with a self-addressed stamped envelope to be returned to the institution. After 15 days, a second mailing was sent to nonresponders.
Interview by Phone
Participants were contacted by telephone by a member of our research team. Interviews were conducted utilizing a detailed script and following the approach used by national patient satisfaction surveys [Hospital Consumer Assessment of Healthcare Providers and Systems (HCAHPS)]. HCAHPS recommends a maximum of 5 attempts to contact the individual, which we followed.
Using the SoftLayer© email delivery service, participants were notified of the survey by email from a WFBH email address, with a link to a Research Electronic Data Capture (REDCap) survey. An email reminder was sent to the participants who had not responded within 15 days.
Patient Portal
An invitation to create a patient portal account is provided to all persons who receive clinical care at WFBH. Consequently, in this study, those sampled to receive their survey via the patient portal included only those who received care at WFBH and who had opted-in to a patient portal account. Access to patient portal accounts for this study was approved by the institutional privacy office and privacy committee. Upon approval, a new message was posted in the patient portal of the 200 selected participants. The new message prompted an alert to their email address that a new message had been posted in their patient portal account. The participant is requested to log in to their patient portal account to open the new message. This message contained an invitation to participate with a link to the REDCap survey. Nonresponders received a reminder within 15 days.
For all approaches in which the selected research participant was <18 years of age (with the exception of the patient portal), the caregiver was asked to respond for the child. Also, except for phone interviews, surveys were collected for a total of 4 weeks at which time the study database for this analysis was closed.
Outcome Measures
Response rates were calculated by dividing the number of surveys returned (whether complete or incomplete) by the number of surveys sent. A survey was deemed as complete when 80% of the questions were answered (16 of 20), the standard used by HCAHPS. Unadjusted response rates are presented by age, race (white, black, other), and ethnicity (Hispanic, non-Hispanic); differences are evaluated using χ2 tests. Logistic regression analysis was conducted to evaluate effects of delivery method on response rates, adjusted for age (<65, 65+ years), gender, and race (white, nonwhite). Interactions of these characteristics with delivery method on response rates were also considered. p-Values for pairwise comparisons were calculated using Fisher exact test.
A survey was considered nondeliverable when it was returned as nondeliverable by mail, when an email was flagged as nondeliverable in the system, when a phone number was determined to be wrong or the participant was unable to speak (n=1) or hear (n=2), or when the patient portal flagged the message as nondeliverable.
The total cost per survey was calculated using the total time invested in the delivery plus other expenses, divided by the total number of completed surveys. Personnel costs were calculated at $20.00 per hour, an approximate hourly rate plus fringe for the administrative staff member who conducted all activities required for the delivery of the surveys.
Overall rating score was obtained from the single question: “Please use the scale below to rate your overall experience in the research study, where 0 is the worst possible experience and 10 is the best possible experience.” A positive overall rating score was considered a score of 9 or 10.
Results
The sample of 4013 patient records was 68.9% white, 20.9% black, and 10.2% other or missing (Table 1). A large portion of the sample (41.5%) was age 65 years or older indicative of the geriatrics research portfolio at this institution. Those with email and patient portal accounts were less likely to be black or in the pediatric or geriatric age groups as compared with the full sample with mailing addresses.
Table 1 Demographics of available population (of 4013 research participants in the electronic medical record) for each of 4 survey delivery methods, and demographics of sample

* Patient portal accounts not available for persons <18 years of age.
Of the 800 surveys we attempted to deliver, 217 surveys were returned for an overall response rate of 27.1% (Table 2). The response rates differed by delivery method. Although there were no differences between response rates for mail, interview, and patient portal (all pairwise contrasts: p>0.59), the response rate for email was lower than all others (all pairwise contrasts: p<0.001). Across all delivery methods, 89.8% (194/217) of the received surveys were considered complete (Table 2). Rate of completeness was highest for phone (98.4%) and lowest for patient portal (79.7%). Comparing response rates utilizing only completed surveys yields similar results to response rates based on returned surveys: response rate for email was lower than all others (all pairwise contrasts: p≤0.01) with all other pairwise comparisons p>0.07.
Table 2 Response rates and overall rating score, Research Participant Perception Survey, by the method of delivery
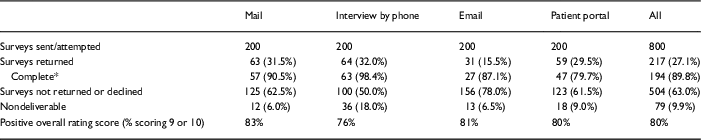
* Complete defined as >80% of questions completed.
Response rates were highest among the oldest participants (age 65+ years) except in the patient portal group (Table 3), where response was highest among the 18–65 year age group. The highest response rate (46.1%) occurred among those aged 65+ years whose surveys were mailed. Response rates were lower for blacks compared with whites for all methods of survey delivery.
Table 3 Response rates by age, race, gender, and ethnicity
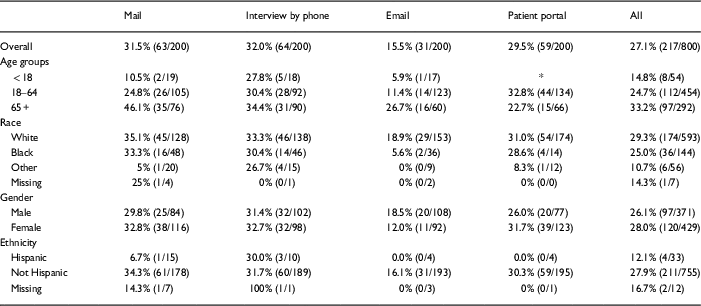
* Patient portal accounts not provided for patients <18 years.
Response rates differed little between men and women (26.1% vs. 28.0%, overall). Samples sizes were too small to make conclusions about response rates in Hispanics (33 of 800 surveys were sent to persons who indicated Hispanic ethnicity). Of the 25 Spanish-language surveys delivered, only 4 were returned (3 of 8 for interview, 1 of 5 for patient portal, 0 of 10 for mailing, and 0 of 2 for email).
Logistic regression modeling indicated significant effects of race (p=0.047) and the interaction between age and delivery method (p=0.002) on response rate. Gender and interactions of race and gender on delivery method were nonsignificant (p>0.59). Nonwhites had lower response rates than whites. In the <65 year age group, all delivery methods performed better than email (Fig. 1, p<0.01) but did not differ from each other (p>0.07). In the 65+ year age group, mail performed better than email (p=0.02), and patient portal (p=0.004) but not better than phone.
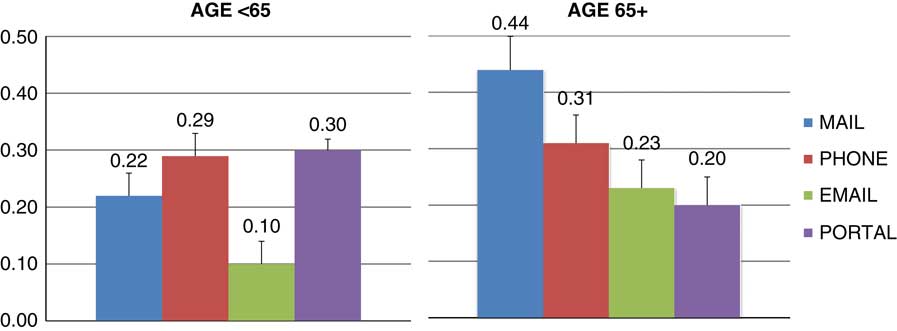
Fig. 1 Response rates (percent and standard errors) for delivery method and age group adjusted for race and gender.
Surveys delivered by phone had decreasing completion rates across the 5 attempts (52%, 20%, 9%, 11%, and 8%, respectively). For surveys provided by mail, 65% of responses were returned after the first contact and 35% in the second round. Of surveys delivered by email, 72% of responses were received in the first round and 28% in the second round. Of all surveys provided via patient portal, 81% were received after the first attempt and 18% in the second round. Five surveys were returned after the data collection period ended (within 4 months), all via the patient portal, increasing the response rate from 29.5% (59/200) to 32% (64/200). All 5 surveys were complete (these data were not used as the primary outcome).
Overall, 9.9% of surveys were nondeliverable, which was highest in the phone interview group (18%).
Those who gave their experience an overall rating score of 9 or 10 was 80% overall, ranging from 76% for interview to 83% for mail (Table 2).
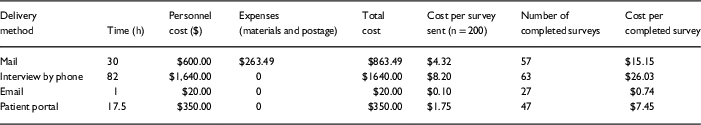
The cost of obtaining a completed survey ranged from $0.74 (email) to $26.03 (interview by phone), with intermediate costs of $7.45 (patient portal) and $15.15 (mail) (Table 4). These costs were driven primarily by personnel costs. For mailing and interview, data entry was also required. The interview cost was also increased due to the 5 attempts to contact participants.
Table 4 Cost of 4 different methods for delivering the Research Participants Perception Survey
Discussion
The modified Ultrashort Research Participant Perception Survey was successfully implemented in an academic medical center using several different methods of delivery, with an overall response rate of 27.1%. Response rates were comparable with previous research perception surveys administered by mail (29%) [Reference Yessis8] and slightly higher than the overall 26% response rate for hospital patient experience surveys (HCAHPS) fielded in North Carolina during the same period [9]. Overall, response rates were lower in nonwhites than in whites but did not differ by gender. Age was the only factor that interacted with delivery method to impact response rate. Among those aged <65 years, response rates did not differ when surveys were delivered through the patient portal, mail, and by telephone interview, but were significantly lower when delivered by email. However, among older participants (65+ years), surveys delivered by mail yielded better response rates than both electronic methods.
The wide range in cost per completed survey was not surprising and is driven by personnel costs. Consequently, electronic methods requiring little staff time to manage are efficient and should be considered as long as response rates are acceptable and data completeness is high. We employed 2 electronic approaches and email delivery was much cheaper ($0.74 per completed survey vs. $7.45 per completed survey via the patient portal). The higher cost for the latter resulted from the need to manually manage the workflow. Based on the success of the pilot, a more automated implementation is planned, which we anticipate will decrease survey costs considerably. Approaches to automation include, for example, delivering a survey through the patient portal within a defined period after obtaining consent for a research study.
Among those aged <65 years, the patient portal method yielded a similar response rate as traditional but more expensive methods using phone or mail, and a rate far superior to email. However, it has several disadvantages. First, patient portal accounts are available only to persons who receive care at the health care entity and who create and utilize an account (39% in this study). Consequently, they do not represent the pool of participants who had participated in research studies (fewer black participants, few pediatric, and geriatric participants). Indeed, a national survey indicated that about one-third of US adults reported being offered online access to their health care information and about one-quarter accessed their information in the past 12 months through a secure Web site [Reference Peacock10]. Characteristics associated with low rates of being offered access to the patient portal and of using the patient portal were similar, and included older age, nonwhite race, Hispanic ethnicity, lower income, and poor self-reported health. Indeed, important segments of the US population are not utilizing these online health care portals. Other disadvantages observed for the patient portal in our study included more surveys being returned incomplete. It appears that some participants did not click the “continue” button after agreeing to participate in the survey, hence closing the survey after completing only 2 questions. A similar issue was observed with the email survey although at a lower rate. And finally, implementation requires approval from appropriate oversight bodies to address privacy issues. At WFBH, approval was granted by the Privacy Office because we confined our participants to those who had already agreed to participate in a research study.
The greater response rate using the patient portal relative to email in the <65 year age group (30% vs. 10%, p<0.0001) is not intuitive. These 2 electronic delivery methods both use the participant’s email address to deliver the invitation or notification of a message in the portal for the survey. We attribute the higher response rate from the patient portal in its requirement to “opt in.” Since patients are expecting messages from the portal, they trust messages that appear. In contrast, among those aged 65+ years, there was no difference in response rates for patient portal and email (20% vs. 23%, p=0.61). In this group, one could consider using email, the lowest cost and least labor-intensive method, albeit with a lower response rate than mail.
The ability to communicate with research participants about their research experiences through the patient portal presents multiple opportunities for researchers. For example, participant-generated data can be used to drive initiatives to improve the research participant experience, including how we communicate with volunteers about participation opportunities, and potentially improve recruitment and retention into clinical trials. The advent of pragmatic clinical trials will require inexpensive electronic methods for patient recruitment to yield the large numbers of participants necessary to answer important research questions. Our findings suggest that the patient portal is a platform through which research participants are willing to provide feedback; it may also prove a viable avenue for recruitment, or even for conducting some aspects of the research itself [Reference Obeid11]. We observed a high positive overall rating score, with 80% of respondents providing a score of 9 or 10, and no difference in scores among delivery methods. This indicates that research participants were highly satisfied with their overall research experience, and the awarding of a high score was not influenced by the method of survey delivery. Both findings were unexpected. First, participant’s perception of their research experience is higher at WFBH than has been reported previously [Reference Kost1]. Second, more positive scores have been observed for phone compared with mail methods [Reference Elliott12]. In this study, fewer positive overall rating scores were observed for phone (76%) compared with all other modes (80%–83%).
Strengths of this study are its comparisons of multiple methods to deliver and receive information about participant’s perceptions of their research experience—including, for the first time, via a patient portal. A limitation is that we did not design the study to randomly select participants from a single pool to receive 1 of 4 delivery methods. Consequently, differences exist between participants, particularly between those who do and do not have an active patient portal account. The logistic regression modeling adjusts for these differences. Finally, response rates to our surveys were low (although similar to response rates of other experience surveys [Reference Yessis8, 9]), and may reflect those who were satisfied with their research experience.
Our study shows the feasibility of using a patient portal as a delivery method for the Research Participant Perception Survey. This method was less expensive than the others tested and had a high response rate among the broadest age group (<65 years). The portal can be more fully integrated into an electronic health system for automation and even lower cost. This work provides evidence that the patient portal is a viable communication platform to reach potential participants in clinical research. However, until the patient portal is used more broadly, it may be necessary to utilize multiple approaches to reach all population subgroups.
Acknowledgments
The authors acknowledge the REDCap team, and statistical and editorial assistance provided through the Wake Forest Clinical and Translational Science Institute. This work is supported by the National Center for Advancing Translational Sciences, National Institutes of Health, through grant award numbers UL1TR001420 (I.J.K.-P., P.Q.H., J.T.R., J.E.A., L.E.W.) and UL1TR001866 (R.G.K.).
Disclosures
The authors have no conflicts of interest to declare.
Supplementary material
To view supplementary material for this article, please visit https://doi.org/10.1017/cts.2018.32


 Open access