


1 INTRODUCTION
Astronomical data acquisition and online reduction of data are steadily becoming more resource-intensive, not just for new and upcoming telescopes such as the Low Frequency Array and the Square Kilometre Array, but also for new instruments at established facilities. Field Programmable Gate Arrays (FPGAs) have long been used at the output of analogue-to-digital converters (ADCs) for data reduction and/or packetisation, followed by a computer that manages the recording of data to disk. FPGAs have traditionally been considered suitable for high-bandwidth applications, but the relative difficulty in programming them and the lack of support for floating-point arithmetic, coupled with the relatively inexpensive pricing of graphics processing unit (GPU) cards, have popularised the use of GPUs in astronomical instrumentation. Several real-time GPU-based signal processing systems intended for pulsar astronomy have been developed in recent years (Ransom et al. Reference Ransom2009; Magro et al. Reference Magro2011; Armour et al. Reference Armour2012; Barsdell et al. Reference Barsdell, Bailes, Barnes and Fluke2012; Magro, Hickish, & Adami Reference Magro, Hickish and Adami2013, for instance). Many new instruments combine the high-bandwith data acquisition capability of FPGAs with the high-performance data reduction capability of GPUs, glueing them together with high-throughput networking hardware. Such a heterogeneous architecture is expected to scale up to meet the data-handling requirements of future instruments and telescopes.
In this paper, we give an overview of a heterogeneous, wide-bandwidth, multi-beam spectrometer that we have built for the Green Bank Telescope (GBT), focussing on the GPU-based spectrometry code and its performance. This spectrometer forms part of the ‘Versatile GBT Astronomical Spectrometer’ (VEGAS) (Roshi et al. Reference Roshi2011; Ford et al. Reference Ford2013). VEGAS has multiple modes of operation that are broadly classified into two categories – the so-called high-bandwith (HBW) and low-bandwidth (LBW) modes. The HBW modes are characterised by higher bandwidths and faster spectral dump rates. The HBW mode spectrometry takes place exclusively on FPGA boardsFootnote 1 , with integrated spectra sent to data recording personal computers (PCs). The LBW modes, on the other hand, involve heterogeneous instrumentation, combing FPGAs for data acquisition followed by GPUs for spectrometry. These modes are based on GPUs as they require a larger number of channels (up to 524 288) than what FPGAs can support. The LBW modes have slower spectral dump rates (i.e., more spectra are integrated) compared to the HBW modes. Although these are low-bandwith modes in the context of VEGAS, these modes are based on code that, with sufficient spectral integration time, can support a per-polarisation bandwidth of up to 1.4 GHz. Since these modes make use of both FPGAs and GPUs, for the remainder of this paper, they will be referred to as ‘heterogeneous modes’.
The organisation of this paper is as follows. In Section 2, we introduce the GPU-programming paradigm, in Section 3 we describe our software, and in Section 5 we explain our benchmarking procedure and performance figures.
2 THE GPU-PROGRAMMING PARADIGM
In the past, computing performance was improved most commonly by using smaller silicon features and increasing the clock rate. Since computer designers are no longer able to increase the clock rate further due to power constraints, parallelisation is the primary method to improve performance in recent times. The central processing unit (CPU) of a typical PC has traditionally contained a single instruction-processing core that can perform only one operation at a time. Multi-tasking on a PC powered by such a CPU is usually achieved by interleaving tasks in time. This obviously degrades the performance of time-critical tasks such as rendering graphics for computer games. One solution to this problem is to offload graphics processing to a dedicated co-processor, the GPU. The GPU contains multiple processing cores that enables it to run multiple instructions simultaneouslyFootnote 2 . This parallelisation makes it suitable not just for graphics processing, but also for general purpose computing that requires high performance. Modern GPUs are designed with this in mind, and programming platforms are available that let developers take advantage of this computing power.
The most common general purpose GPU programming platform is Compute Unified Device ArchitectureFootnote 3 (CUDA). CUDA lets developers access the hardware (the parallel compute engine in the GPU) using programming instructions. This is enabled by extending the C language to invoke routines that run on the GPU and using CUDA libraries for numerical computation and signal processing, such as CUDA Basic Linear Algebra Subroutines and CUDA Fast Fourier Transform.
Since GPUs are suitable computing platforms for data-parallel applications, they are increasingly used as dedicated co-processors for data analysis applications that use the high-performance hardware to accelerate their time-critical paths. This also makes GPUs ideal for data-acquisition instruments such as VEGAS.
3 OVERVIEW OF VEGAS
The heterogeneous modes of operation of VEGASFootnote 4 and their specifications are given in Table 1. These modes are divided into single-sub-band modes and eight-sub-band modes. The single-sub-band modes can have 32 768–524 288 channels, with sub-band bandwidths in the range 11.72–187.5 MHz, whereas the eight-sub-band modes have 4 096–65 536 channels with bandwidths ranging from 15.625 to 23.44 MHz.
Table 1. Heterogeneous modes of operation of VEGAS and their specifications.
Figure 1 shows a block diagram of the software section of the VEGAS heterogeneous-mode data acquisition pipeline. In the heterogeneous modes, the FPGA board packetises the signal sampled by an ADC and sends it over 10-Gigabit Ethernet (10 GbE) to a PC with a GPU. The VEGAS software pipeline, based on the Green-Bank Ultimate Pulsar Processing Instrument (Ransom et al. Reference Ransom2009) is made up of multiple concurrent threads, each associated with a separate CPU core. The first thread, called the ‘network thread’ reads packets off the network and writes the payload to a shared memory ring buffer. The next thread, called the ‘GPU thread’ reads the data off the buffer and performs spectrometry, including accumulation of multiple spectra, if needed. Once the accumulated spectra are ready, the output is written to another ring buffer from which the third thread – the ‘CPU thread’ – reads data and performs further accumulation as needed. Once this is done, the output is sent to the ‘disk thread’ that writes it to disk. This paper describes the spectrometer implemented in the GPU thread.
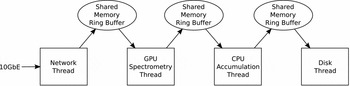
Figure 1. Data flow diagram of the software part of the VEGAS data acquisition pipeline. This paper focusses on the software used in the GPU spectrometry thread.
VEGAS supports multi-beam receivers, in which case the signal from each beam is processed by a separate software data acquisition pipeline. The implementation utilises dual-socket, dual-NIC, dual-GPU PCs, wherein one PC processes signals from two beams independently.
4 THE GPU SPECTROMETER
Spectrometry is a discrete Fourier transform (DFT; see, for example, Bracewell Reference Bracewell1999) operation, usually implemented as a fast Fourier transform (FFT) for its performance benefits. Due to the finite length of the ‘DFT window’ (the number of input time samples), the single-bin frequency domain response of the DFT is not rectangular, but is a sinc function, with side lobes spread across the entire bandwidth. This ‘spectral leakage’, and the related phenomenon of ‘scalloping loss’ – due to the non-flat nature of the main lobe of the sinc function – can be mitigated by suppressing the side-lobes of the sinc function and changing the single-bin frequency response of the DFT to approximate a rectangular function. One way of achieving this is using the polyphase filter bank technique (PFB), also known as weighted overlap-add method, in which a ‘pre-filter’ is introduced preceding the FFT stage (for details, see Crochiere & Rabiner (Reference Crochiere and Rabiner1983) and Harris & Haines (Reference Harris and Haines2011)). The GPU spectrometer described in this paper implements an 8-tap PFB.
The input data to our PFB spectrometer is made up of dual-polarisation, 8-bit, complex-valued samples, while the output contains X 2, Y 2, Re(XY*), and Im(XY*), where X is the Fourier transform of the horizontal polarisation, Y is the Fourier transform of the vertical polarisation, and X* and Y* are the corresponding complex conjugates. Note that full-Stokes spectra can easily be derived from these values.
The high-level algorithm of the spectrometerFootnote 5 is as follows. Here, following GPU-programming parlance, ‘host’ indicates code and memory that is associated with the CPU, whereas ‘device’ indicates code and memory that is associated with the GPU.
-
1. Initialisation
-
a. Load filter coefficients from host to device memory.
-
b. Create FFT plan to perform two FFTs in parallel in the case of single-sub-band modes and 16 FFTs in parallel in the case of eight-sub-band modes.
-
-
2. Copy time series data for one set of parallel FFTs to device.
-
3. Perform pre-filtering.
-
4. Perform parallel FFTs.
-
5. Accumulate spectra for desired duration.
-
6. Copy output to host.
-
7. Repeat from Step 2.
4.1. Test observations
We observed the Galactic H ii region W3 using the seven-beam K-Band Focal Plane Array (KFPA) receiver of the GBT during commissioning tests. Figure 2 shows a plot of antenna temperature versus velocity for multiple sub-bands corresponding to one of the KFPA beams, in which ammonia lines are visible.
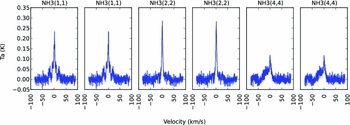
Figure 2. A plot of antenna temperature versus velocity for multiple sub-bands corresponding to one of the KFPA beams of the GBT. The plots show ammonia lines towards RA (J2000) = 02h25m40s5,Dec. (J2000) = 62° 06′ 24′′, in the Galactic H ii region W3. Some of the sub-bands were tuned to the same frequencies.
5 BENCHMARKING AND PERFORMANCE RESULTS
Benchmarking of the software spectrometer was performed on a server-class PC running a flavour of the Linux operating system, with an NVIDIA GeForce GTX TITAN commercial (gaming) GPU card. A stand-alone version of the spectrometer program was used, wherein data were read off disk files and pre-loaded in memory, to simulate reading from the shared memory ring buffers of VEGAS described in Section 3. Each test was repeated 100 times and we report the average values. The peak bandwidth achieved was ~ 638 MHz (dual-polarisation), corresponding to a data rate of ~ 10.2 Gbps which is more than what a 10 GbE link can support. The peak performance was achieved for an FFT length of 216, with long integrations (accumulation length of 1 000 spectra). When direct FFT was used, the peak bandwidth achieved was ~ 794 MHz, corresponding to a data rate of ~ 12.7 Gbps, again, more than what is supported by 10 GbE. This peak was for a 220-point FFT with an accumulation length of 1 000 spectra. The performance of the code as a function of transform length and accumulation length is depicted in Figure 3.

Figure 3. Bandwidth per polarisation processed by the GPU spectrometer running on an NVIDIA GeForce GTX TITAN, for (a) direct FFT and (b) 8-tap PFB, for various values of spectral accumulation length (number of spectra accumulated), a. Without the PFB technique (i.e., direct FFT), the spectrometer is able to process a bandwidth of up to 1.4 GHz, whereas with the PFB, the maximum bandwidth achieved is 1.1 GHz.
The performance of the code is lower at low values of FFT length due to the following: Each FFT kernel invocation (that does either two FFTs in parallel for single-sub-band modes, or 16 FFTs in parallel for eight-sub-band modes) is preceded by a host-to-device data copy step and a pre-filter stage (in the case of PFB), and followed by a device-to-host data copy step. Given the overhead involved in launches of both the copy and compute kernels, this translates to fewer data processing operations per unit time, resulting in reduced performance. This becomes less of an issue at larger FFT lengths.
6 CONCLUSION
We have developed a GPU-based PFB spectrometer that supports a dual-polarisation bandwidth of up to 1.1 GHz (or a single-polarisation bandwidth of up to 2.2 GHz). Without doing PFB (i.e., direct FFT), it supports a dual-polarisation bandwidth of up to 1.4 GHz (or a single-polarisation bandwidth of up to 2.8 GHz). This bandwidth is sufficient for most spectral line observations, and can be traded off with spectral integration time for some pulsar observations. Future work would involve improving the performance of this software. The simplest way to speed it up would be to run it on the latest generation of GPU cards. Each new generation of GPU cards typically have, compared to its predecessors, more processing cores and larger memory bandwidth. This naturally leads to some improvement in performance. However, to significantly improve performance between two consecutive generations of GPUs, the code would need to be tuned keeping in mind the architecture of the GPU used. A better – albeit, brute-force – way to speed up the code would be to implement support for scalability, by enabling the software to take advantage of dual-GPU cards, and/or to spread the load across multiple GPU cards. This has the potential to increase the bandwidth processed by up to a factor of a few, depending on the number of GPUs used. Additionally, algorithm-level and further code-level optimisations – such as pipelining kernel launches using CUDA streams – may also have the potential to yield higher performance.
ACKNOWLEDGEMENTS
We thank Mike Clark for suggestions on code optimisation, and Ben Barsdell, Matthew Bailes, Jonathon Kocz, Gregory Desvignes, David MacMahon, and Terry Filiba for useful discussions. We also thank the anonymous referee for comments that served to clarify the paper. NVIDIA, GeForce, GeForce GTX TITAN, and GTX are trademarks and/or registered trademarks of NVIDIA Corporation in the U.S. and/or other countries.


