


INTRODUCTION
Although influenza is a major cause of morbidity and mortality, most incident influenza cases are not detected by routine (laboratory-based or virological) disease surveillance as flu patients are rarely tested for influenza [Reference Rothberg, Haessler and Brown1]. Surveillance systems based on laboratory testing are often expensive to implement and maintain compared to alternatives, may not be sensitive enough to detect the early stages of an outbreak, and may not be suitable to detect outbreaks of novel influenza strains in a timely manner [Reference Sosin2, Reference Elliot3]. Syndromic surveillance is an alternative approach which involves the use of ‘health-related data that precede diagnosis and signals sufficient probability of a case or an outbreak to warrant further public health response’ [4]. Examples of influenza syndromic indicators include the use of pre-diagnostic information, such as the volume of patients presenting with influenza-like illness (ILI) to emergency departments (EDs) or primary-care sites, and tracking health information-seeking behaviour such as phone calls to health lines [Reference Cadieux5–Reference Moore7], or internet searches for flu-related information (e.g. the Google flu trends (GFT) website, which provides near real-time estimates of influenza activity in more than 20 countries [Reference Ginsberg8]). Several studies have investigated the performance of GFT data in monitoring influenza activity. GFT ILI rate estimates have been shown to closely correlate with influenza disease activity during the recent H1N1 influenza pandemic [Reference Cook9, Reference Wilson10], and to anticipate pandemic H1N1 influenza activity in Manitoba (Canada), up to 2 weeks in advance [Reference Malik11].
Malik et al. also found that the volume and percentage of ED visits triaged as ILI were strongly correlated with GFT-based syndromic indicators and with influenza activity during the 2009 H1N1 pandemic [Reference Malik11]. EDs are common points of entry into the healthcare system for people with ILI [Reference Afilalo, Stern and Oughton12], so it is reasonable to expect that a syndromic surveillance system based on ED ILI case volumes might function equally well during non-pandemic influenza seasons. The recently implemented Emergency Department Information System (EDIS) – a real-time monitoring system tracking triage information for all patient visits to a hospital ED in the city of Winnipeg, Canada – provides an opportunity to assess this hypothesis. We constructed several influenza syndromic indicators using ED and GFT data, and used a time-series analysis to evaluate their utility for the timely monitoring of seasonal influenza activity measured as the weekly count of laboratory-confirmed influenza A and B cases.
METHODS
ED data
Information on ED visits to Winnipeg hospitals during the 2008–2009, 2009–2010 and 2010–2011 flu seasons was obtained from the EDIS database. EDIS was implemented in 2008, and therefore the data was only available for these three seasons. EDIS is a real-time ED monitoring system implemented across Winnipeg hospitals that records patient demographics, ‘chief complaints’, and other triage information for every ED visit. We obtained aggregated daily data capturing the total number of visits to the EDs (for any reason) and the number of visits attributed to ‘ILI’, defined as having any of the following chief complaints: weakness, shortness of breath, cough, headache, fever, sore throat, upper respiratory tract infection, or respiratory arrest. As these complaints are not specific to the ILI syndrome, this definition is likely to overestimate the actual number of ILI visits. However, this definition was used consistently throughout the study period and therefore time trends could still reflect changes over time in ED use due to ILI. Two syndromic indicators were used: weekly count of all ED visits (ED ILI volume), and percentage of all ED visits that were triaged as an ILI (ED ILI percent). Although probably correlated, these indicators measure different aspects of ED utilization. It is possible at times to have a low volume of ILI visits (compared to other periods) but still represent a large percentage of all ED visits.
GFT data
Estimates of GFT ILI consultation rates for Manitoba were downloaded from the GFT website [13] for the period December 2005 to February 2011. GFT uses a validated algorithm (updated annually) and Google's aggregated search query data to provide region-specific estimates of flu activity in near real-time [13]. In Canada, these estimates are validated using data from the FluWatch sentinel surveillance system capturing ILI-related primary-care visits [14]. Hence, GFT estimates are presented as the number of ILI cases/100 000 physician visits, which we refer to as the GFT ILI consultation rate [13].
Virological data
Weekly counts of laboratory-confirmed influenza A, including pandemic H1N1 (pH1N1), and influenza B cases were obtained from the Flu Surveillance website of Manitoba Health for the 2005–2006 to 2010–2011 flu seasons [15]. In Manitoba, the number of laboratory-confirmed influenza is usually reported on weekly basis between November and April the following year (the period corresponding to influenza seasons in the Northern hemisphere). However, during 2009 reporting continued throughout the year. Over the study period, laboratory testing for influenza was commonly performed using a polymerase chain reaction assay, and occasionally using viral culture or immunoassays [Reference LeBlanc16]. As per convention, specimen collection date is used for assignment to reported weekly counts.
Statistical analysis
Time-series curves for the virological data consisting of the weekly counts of the laboratory-confirmed influenza A and B cases for the individual seasons were plotted against the weekly ED ILI volume and ED ILI percent for the annual flu seasons of 2008–2009, 2009–2010 and 2010–2011, and against the weekly GFT ILI consultation rates.
To determine how much of the variability in the number of laboratory-confirmed influenza cases occurring during week t (y t ) could be explained by ED ILI volume at week t − τ (x t − τ ), the following linear model was fitted to the data:
 $$y_i = \beta _0 + \beta _1 x_{t - \tau}. $$
Model estimates were obtained for different lag periods of the syndromic indicators in relation to weekly laboratory-confirmed cases (τ = 0, 1 and 2 weeks, where τ = 0 indicates no lag and τ = 1 indicates a lag of 1 week whereby weekly number of laboratory-confirmed cases is correlated with syndromic indicator data of the previous week). The coefficient of determination, R 2 (0 ⩽ R 2 ⩽ 1), was used as a measure of the goodness of fit of our models to the observed data, with a larger value of R 2 (closer to 1) reflecting a better linear model fit. As there is only a single explanatory variable in model 1, R 2 is equivalent to the square of Pearson's correlation coefficient measuring the strength of association between the response and the explanatory variables. Similar models were also fitted for the other two indicators, ED ILI percent and GFT ILI consultation rates. All analyses were performed using Matlab [17].
RESULTS
Figure 1 presents time-series data, with weekly counts of laboratory-confirmed influenza cases in Manitoba plotted against ED ILI percent and GFT ILI consultation rates. The congruity between the curves of these two syndromic indicators and the curve of the weekly counts of influenza cases is evident. The two pandemic waves, May–July 2009 and October–December 2009 are clearly discernible in all time-series (Fig. 1).
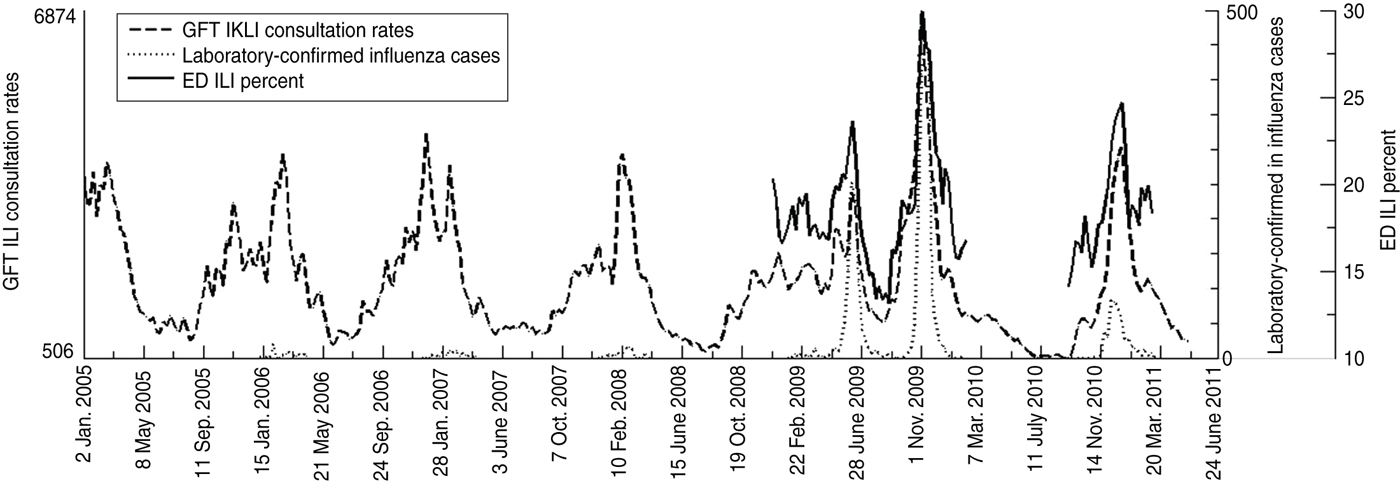
Fig. 1. Time-series for weekly counts of laboratory-confirmed influenza with corresponding Google flu trends influenza-like illness (GFT ILI) consultation rates and emergency department influenza-like illness (ED ILI) percent.
Figure 2 shows the time series for the weekly counts of laboratory-confirmed influenza cases for the 2005–2006, 2006–2007 and 2007–2008 flu seasons in Manitoba (the seasons prior to the implementation of EDIS), plotted against GFT ILI consultation rates. Over the course of these three flu seasons, there is an increasing congruence between the two time series (Fig. 2). Overall, the correlation of GFT ILI consultation rates with laboratory-confirmed cases increases consistently over the years since its introduction (Table 1). The concurrent model (with no lag) increased from 0·226 in the 2005–2006 season to around 0·698 in the two most recent seasons (2009–2010 and 2010–2011). A similar trend was seen for models with a lag of 1 and 2 weeks, although the correlation estimates were slightly weaker than the corresponding estimates from the concurrent model.
Fig. 2. Time-series for weekly counts of laboratory-confirmed influenza cases and Google flu trends influenza-like illness (GFT ILI) consultation rates in Manitoba during influenza seasons: (a) 2005–2006, (b) 2006–2007, (c) 2007–2008.
Table 1. Results from linear regression analysis, based on model 1, for the weekly counts of laboratory-confirmed influenza cases (dependent variable) with Google flu trends influenza-like-illness consultation rate (predictor variable), by flu season and lag period

Figure 3 shows the time series for the laboratory-confirmed influenza cases, plotted with the ED ILI percent and GFT ILI consultation rates for the 2008–2009, 2009–2010 and 2010–2011 flu seasons (the seasons that followed the implementation of EDIS). The three curves show similar trends, with a clear rise in the GFT ILI consultation rates and ED ILI percent curve ahead of the epidemic curve. As shown in Table 2, the ED ILI percent indicator is more strongly correlated with virological data than the indicator based on ED ILI volume. Both ED ILI volume and ED ILI percent had a stronger correlation with a 1-week lag in the 2008–2009 season, and with no lag in the subsequent two seasons. Generally, correlations for ED ILI volume were stronger in models with 1-week lag, whereas for the ED ILI percent indicator, the concurrent model was generally more strongly correlated than the models with lag time.

Fig. 3. Time-series for weekly counts of laboratory-confirmed influenza cases.
Table 2. Results from linear regression analysis, based on model 1, for the weekly counts of laboratory-confirmed influenza cases (dependent variable) with ED ILI volume and ED ILI percent (predictor variables), by flu season and lag period
ED ILI, Emergency department influenza-like illness.
Table 3 shows that the indicators based on ED ILI volume and ED ILI percent were both strongly correlated with the GFT ILI consultation rates, especially during the second wave of the 2009 pandemic. Correlations were generally weaker in the models with lag time.
Table 3. Results from linear regression analysis, based on model 1, for the weekly counts of ED ILI volume and ED ILI percent (dependent variables) with Google flu trends ILI consultation rate (predictor variable), by flu season and lag period
ED ILI, Emergency department influenza-like illness.
DISCUSSION
We found that ILI syndromic indicators based on GFT and ED utilization data were highly correlated with each other, and with the number of laboratory-confirmed influenza specimens collected in the same or the following week. This suggests that GFT and ED indicators may be better able to detect the early stages of influenza circulation and ILI outbreaks than laboratory data.
Our results are plausible because individuals experiencing early symptoms of influenza may be likely to perform internet searches about their symptoms, and GFT incorporates search query data into its estimations. Many of these individuals may also present to EDs, but most of them are unlikely to have specimens taken for laboratory-confirmation in the absence of severe disease and secondary complications [Reference Zheng6, Reference Westheimer18]. As a result, ED data reflecting increased utilization by ILI patients is probably more sensitive than virological surveillance for monitoring influenza disease activity. Further, whereas data from GFT and ED information systems become available to surveillance and public health officials by the end of the week of interest, the number of positive laboratory-confirmed influenza specimens collected that week do not become available until all specimens have been tested and results transferred from the various laboratories to public health authorities for collation and analysis and may not become available for decision-making until several days have elapsed. Thus, GFT and EDIS data can provide a timely and economical way of monitoring influenza disease activity.
The correlation of GFT data with laboratory-confirmed cases has increased consistently over the past six flu seasons, despite only one change to the GFT prediction model which occurred between the 2009 and 2010 flu seasons (Dr R. Patel, personal communication, February 2013). The change in the prediction model does not explain the strengthening correlation because all the data used in the analysis (including pre-2009 data) were generated using the new model. The reasons for the improved correlation are not clear, but might be related to a documented increase in influenza testing across Canada [19] (improving the quality of the virological data), or possibly to increased internet use [20] (improving the quality of GFT data [Reference Ginsberg8]). There was a significant increase in influenza testing volumes in Manitoba in 2009 due the H1N1 pandemic, and changes to surveillance and clinical testing guidelines, and testing volumes have remained high in subsequent influenza seasons [19].
Our findings that GFT data correlated well with virological data and ED utilization data are consistent with the results of a similar study conducted in Baltimore [Reference Dugas21]. Like our study, strong correlations were found between GFT estimates and laboratory-confirmed influenza cases (0·88), GFT and adult ED ILI presentations (0·88), and GFT and ED ILI volume (0·65) [19]. Our results are also consistent with those of another study which found that the correlation between GFT and US CDC virological data from 140 laboratories across the USA was 0·72 from 2003 to 2008, and the mean of individual seasonal correlations was 0·79 [Reference Ortiz22].
Most studies of the use of ED syndromic indicators for influenza surveillance have investigated its use for early outbreak detection. One such study found that a syndromic surveillance system in New York City which uses ED chief complaints to identify ILI cases could detect influenza outbreaks 2 weeks sooner than increases in laboratory-confirmed cases were noted and 3 weeks sooner than sentinel physicians reported increases in ILI [Reference Heffernan23]. A study conducted in Washington, DC compared ED complaints and diagnoses to CDC regional ILI data and found that those consistent with pneumonia, viral illness, and upper respiratory infection were together good indicators of the start of the flu season [Reference May24]. Like our study, these studies demonstrate that readily available syndromic indicators may be able to predict influenza activity. Very few studies that were aware of that investigated the use of EDIS and GFT data to monitor seasonal influenza activity specifically and not their use as early warning systems to detect outbreaks. The use of electronic ED patient data for syndromic surveillance of seasonal influenza was investigated in Victoria, Australia using data from July 2001 to August 2009 [Reference Moore25]. During the flu seasons (but not outside of the flu seasons), five ICD-10 codes in combination (influenza, pneumonia, acute upper respiratory infection, acute lower respiratory infection, unspecified viral infection) were found to be moderately (r = 0·56) correlated with weekly counts of laboratory-confirmed influenza cases, and the authors suggested that the observed seasonality was due to the influence of what the ED staff believed was occurring in the community [Reference Moore25].
Although correlated, ED ILI percent and ED ILI volume are distinct measures. This might be quite apparent in small EDs or EDs in communities with low disease volumes, which may have relatively few patients with other more serious illnesses and therefore, while the volume of ILI cases may be low because of the low number of patients in smaller or healthier communities, it would represent a relatively large proportion of patients compared to other EDs. Similarly, while specialized EDs and large EDs serving large and diverse populations with a range of illnesses may have considerably more ILI cases than smaller EDs, this could represent a minority of patients presenting to these EDs.
Our study has several limitations. As this study is based on Manitoba data only, the results may not apply to other regions. Our analysis of EDIS data is limited to EDs in Winnipeg only, whereas GFT and virological data apply to the whole province. This is likely to have weakened the correlation between EDIS data and provincial flu activity, although this impact is probably limited because most EDs in Manitoba are located in Winnipeg. Our study is also limited by the fact that EDIS data were available for only three flu seasons, one of which corresponded to the 2009 H1N1 pandemic.
In this study, we assessed the ability of GFT and EDIS data to act as signals of the level of influenza activity in the community. These signals are not specific to the demographic characteristics of the community or the circulating viral subtypes, which is data that we did not have, and thus only provide indications of the start and magnitude of the epidemic wave and not the predominant influenza subtype or the severity of resulting disease. The effect of circulating subtypes and age groups affected by influenza in particular seasons on the ability of these indicators to predict circulating influenza could be the subject of future research.
We found that ED ILI percent, ED ILI volume, and the GFT ILI consultation rates were strongly correlated with the weekly number of laboratory-confirmed influenza cases during three recent flu seasons suggesting that ED and GFI data can provide a timely and economic way of monitoring influenza disease activity. Information obtained from these syndromic surveillance sources can be used to plan for public health interventions, such as messages to healthcare facilities, schools, and the public regarding appropriate measures for infection prevention and control. EDIS may also be particularly useful for acute-care service utilization planning because data is specific to particular hospitals (and their catchment areas). In our experience, information from syndromic indicators is most helpful in understanding disease activity when interpreted collectively in relation to each other and to other sources of surveillance information (e.g. sentinel and routine laboratory virological data). Because of their lack of specificity, individual syndromic indicators may overestimate or underestimate disease activity, e.g. when other respiratory viruses are circulating in the community [Reference Butler26]. While the use of syndromic indicators may be useful for monitoring influenza activity, they are not intended to replace traditional influenza surveillance systems and should rather be used to complement them.
ACKNOWLEDGEMENTS
L.H.T. is supported by a joint University of Manitoba Graduate Fellowship/Manitoba Health Research Council Studentship and the Canada Institutes of Health Research International Infectious Disease & Global Health Training Program. S.M.M. was supported by an Establishment grant from the Manitoba Health Research Council. S.M.M. is a Canada Research Chair in Pharmaco-epidemiology and Vaccine Evaluation and the Great-West Life, London Life and Canada Life Junior Investigator of the Canadian Cancer Society (grant no. 2011-700644). The authors are grateful to anonymous external reviewers for their careful review of this manuscript.
DECLARATION OF INTEREST
None.


