


1 Introduction
X-ray imaging is an essential method to measure mass distribution and opacity of matter in high-energy density physics (HEDP) experiments, such as inertial confinement fusion (ICF)[ Reference Landen, Farley, Glendinning, Logory, Bell, Koch, Lee, Bradley, Kalantar, Back and Turner 1 , Reference Jarrott, Bachmann, Ma, Benedetti, Field, Hartouni, Hatarik, Izumi, Khan, Landen, Nagel, Nora, Pak, Peterson, Schneider, Springer and Patel 2 ], magnetized liner inertial fusion (MagLIF)[ Reference Lynn and Gilmore 3 , Reference Gomez, Slutz, Sefkow, Hahn, Hansen, Knapp, Schmit, Ruiz, Sinars, Harding, Jennings, Awe, Geissel, Rovang, Smith, Chandler, Cooper, Cuneo, Harvey-Thompson, Herrmann, Hess, Lamppa, Martin, McBride, Peterson, Porter, Rochau, Savage, Schroen, Stygar and Vesey 4 ], z-pinch physics[ Reference Lebedev, Beg, Bland, Chittenden, Dangor, Harines, Zakaullah, Pikuz, Shelkovenko and Hammer 5 , Reference Yang, Liu, Mu, Huang, Dan, Xie, Deng, Feng, Wang, Ye, Peng and Li 6 ], Thomson scattering[ Reference Ao, Harding, Bailey, Lemke, Desjarlais, Hansen, Smith, Geissel, Maurer, Reneker, Romero, Sinars, Rochau and Benage 7 ], and dynamic material properties researches[ Reference Crum, Homel, Pagan, Herbold, Miller, Lind, Jensen, Iverson and Akin 8 ]. High-energy lasers have become one of the most important tools[ 9–12 ] to generate X-rays with high spatial and temporal resolution[ Reference Bradley, Landen, Bullocks, Glendnning and Turner 13 ]. When a high-energy laser beam is focused on a target, a high-temperature plasma is formed near the target surface and an X-ray is emitted from the plasma. In general, the performance of the generated X-ray is determined by the characteristics of the laser, including output energy, wavelength, pulse length, and beam quality[ Reference Kyrala, Fulton, Wahlin, Jones, Schappert, Cobble and Taylor 14 ]. Compared with a 1 μm laser beam, a 527 nm laser beam can reduce the risk of target back-reflection and improve the coupling efficiency of the X-ray, meanwhile avoiding serious absorption and optical damage when using the ultraviolet laser[ 15–18 ]. In particular, the X-ray with energy of several kiloelectronvolts, which is suitable for X-ray radiography in the HEDP experiments[ Reference Gomez, Slutz, Sefkow, Hahn, Hansen, Knapp, Schmit, Ruiz, Sinars, Harding, Jennings, Awe, Geissel, Rovang, Smith, Chandler, Cooper, Cuneo, Harvey-Thompson, Herrmann, Hess, Lamppa, Martin, McBride, Peterson, Porter, Rochau, Savage, Schroen, Stygar and Vesey 4 , Reference Yang, Liu, Mu, Huang, Dan, Xie, Deng, Feng, Wang, Ye, Peng and Li 6 , Reference Koenig, Benuzzi-Mounaix, Ozaki, Ravasio, Vinci, Lepape, Tanaka and Riley 16 ], Thomson scattering, and compressed materials studies[ Reference Ao, Harding, Bailey, Lemke, Desjarlais, Hansen, Smith, Geissel, Maurer, Reneker, Romero, Sinars, Rochau and Benage 7 , Reference Crum, Homel, Pagan, Herbold, Miller, Lind, Jensen, Iverson and Akin 8 ], could be generated by using a kilojoule-class nanosecond-level 527 nm laser.
In these applications, the 527 nm laser beam should simultaneously possess kilojoule-level energy and high beam quality to generate the desired X-ray. To achieve high-energy output, a laser system with complex optical structure (e.g., multi-pass amplifier structure), numerous optical mirrors (generally more than 50 pieces), and large beam aperture (generally larger than 200 mm) should be designed and built. However, wavefront distortion caused by imperfect installations and thermal effects of large-aperture optical components has become inevitable in such complex multi-pass amplification high-energy laser systems[ 19–24 ]. It seriously reduces the energy coupling efficiency and degrades the output laser beam quality. In other words, it is very hard for the 527 nm laser to achieve near diffraction limited (diffraction limit (DL), the size of the first zero of an Airy disk) beam quality and kilojoule-level energy simultaneously. Adaptive optics (AO) is the most commonly employed technology to correct the wavefront distortion in high-energy laser systems, including the National Ignition Facility in the USA and the Laser MégaJoule facility in France. For traditional AO technology, the deformable mirror (DM) is usually set as the cavity mirror of the multi-pass amplifier and in the middle of the beam path through it, while the Shack–Hartmann (SH) wavefront sensor is usually set in the output sensor package of the main-amplifier to ensure high efficiency correction on the wavefront distortion caused by thermal effects in the main amplifier[ 25–27 ]. However, the wavefront distortion generated from the output of the main amplifier to the target could not be corrected and still remains in the final laser beam, which will eventually have an influence on the intensity distribution of the focused target point[ Reference Wang, Hu, Zhou, Deng, Wang, Deng, Yuan, Zhang, Huang, Li, Xue, Yuan, Peng, Dai, Zhu and Jing 28 ].
This paper presents a 1178 J near DL 527 nm laser using off-axis multi-pass amplification and complete closed-loop AO. The 1053 nm laser beam generated from a fiber laser is amplified to 200 mJ by a rod-type pre-amplifier and then to 1900 J in the off-axis four-pass main amplifier. The 1053 nm laser beam is converted into a 527 nm laser beam with an energy of 1178 J by the 90°-cut type-I KDP crystal before being focused on the target. A complete closed-loop AO system consisting of a DM and an SH wavefront sensor is adopted in this laser. The DM is set after the main amplifier and an SH wavefront sensor is located near the target to measure the distorted wavefront transmitted by a beamsplitter and a collimating lens. The wavefront correction performance of the complete closed-loop AO configuration is simulated, and the results show that, by using the configuration, a 527 nm laser with near DL beam quality (1.12DL) could be achieved in the off-axis multi-pass amplification laser system. Finally, a 1178 J high-energy and 1.29DL high-beam-quality 527 nm laser is obtained and the intensity of the focal spot is highly concentrated at the target in the experiment. To the best of the authors’ knowledge, this is the best quality laser among the 527 nm, kilojoule-level class lasers.
2 Design and fabrication of the laser system
Figure 1 shows a schematic diagram of the 1178 J near diffraction limited 527 nm laser system using off-axis multi-pass amplification, which consists of seven primary parts, i.e., the front-end, the pre-amplifier, the main amplifier, the spatial filter, the reverser, the second harmonic generation (SHG), and the target. In the front-end part, a 1053 nm laser beam (15 μJ, 1 ns) generated from a fiber laser is collimated by lens L1 and then shaped into a 10 mm × 10 mm super-Gaussian beam (17th order, as shown in Figure 1) by a square aperture (SA) liquid crystal amplitude modulator, which is commonly used for the laser beam shaping in high-power laser systems[ Reference Heebner, Borden, Miller, Hunter, Christensen, Scanlan, Haynam, Wegner, Hermann, Brunton, Tse, Awwal, Wong, Seppala, Franks, Marley, Williams, Budge, Henesian, Stolz, Suratwala, Monticelli, Walmer, Dixit, Widmayer, Wolfe, Bude, McCarty and DiNicola 29 , Reference Barczys, Bahk, Spilatro, Coppenbarger, Hill, Hinterman, Kidder, Puth, Touris and Zuegel 30 ]. After being expanded to the size of 46 mm × 46 mm by lenses L2 and L3, the laser beam enters into the pre-amplifier and is amplified to 200 mJ by an eight-pass Nd:YAG rod amplifier.
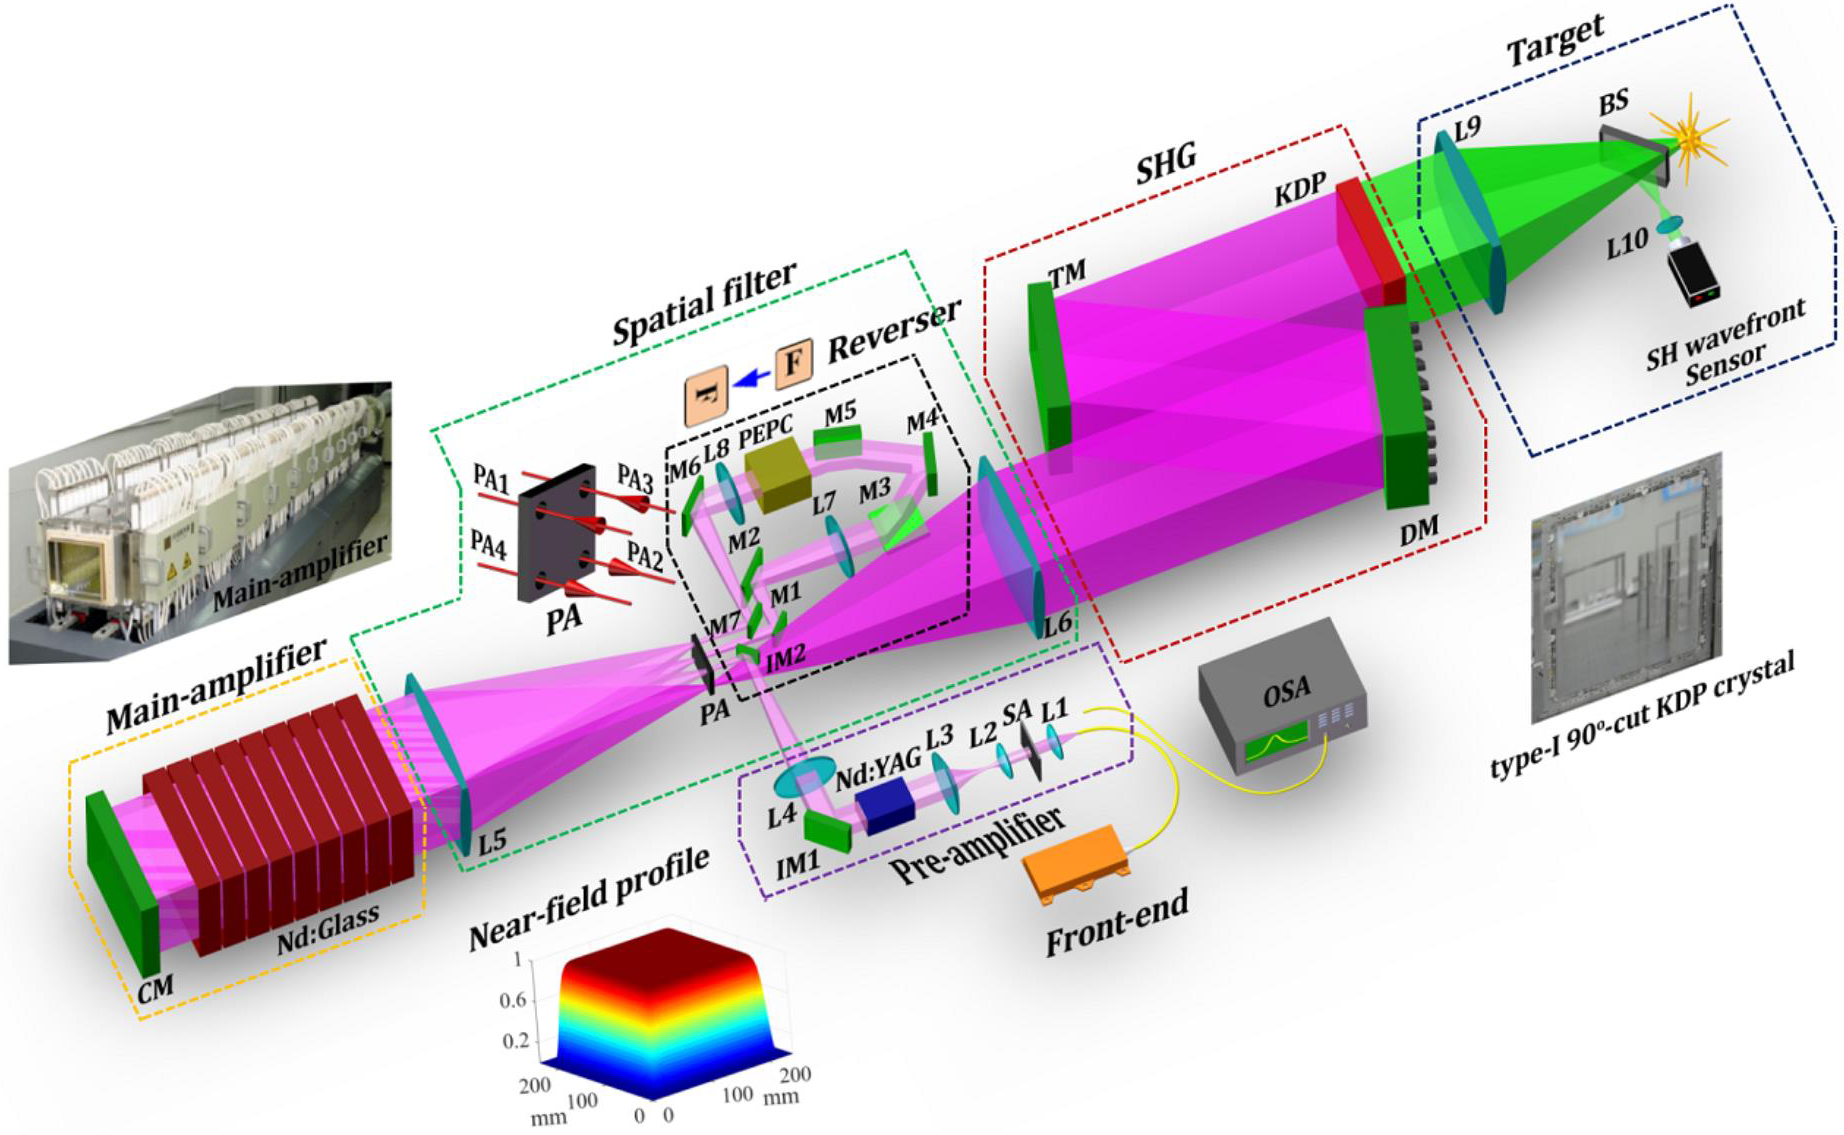
Figure 1 Schematic diagram of the 1178 J near diffraction limited 527 nm laser system using off-axis multi-pass amplification and complete closed-loop AO. BS, beamsplitter; CM, cavity mirror; DM, deformable mirror; L1–L10, focus lenses; M1–M7, IM1 and IM2, reflection mirrors; OSA, optical spectrum analyzer; PA, pinhole array; PEPC, plasma-electrode Pockels cell; SA, square aperture; TM, transport mirror.
A spatial filter part, consisting of lenses L5, L6 and a pinhole array (PA), is set to achieve high spatial components filtering and laser beam collimation. After exiting from the pre-amplifier, the laser beam is reflected by reflection mirror IM1 and then converged by lens L4. After being reflected by reflection mirror IM2, the laser beam is injected into PA1 (i.e., the first filter pinhole in PA) and collimated to a 200 mm × 200 mm aperture beam by lens L5. Then, the beam enters into the main amplifier, which is composed of nine pieces of Nd:glass (410 mm × 260 mm, set at the Brewster angle). Reflected by the cavity mirror (CM), the laser beam extracts about 70 J energy from the main amplifier after passing through it twice and propagates back into PA2 (i.e., the second filter pinhole in PA). A high damage threshold pick-off mirror M1 is located behind PA2 to reflect the laser beam coming out of the spatial filter into the reverser, which is mainly composed of seven pieces of reflection mirrors (i.e., M1 to M7, high reflectivity for 1053 nm laser beam), two collimating lenses (i.e., L7 and L8), and a plasma-electrode Pockels cell (PEPC). In the reverser part, the beam polarization and the near field of the beam are rotated 90° by the PEPC and by three reflection mirrors (i.e., M3, M4, and M5), respectively. The combined use of the PEPC and the reflection mirrors could effectively isolate the self-excitation laser beam and mitigate the gain nonuniformity caused by the main amplifier. The primary parameters of these optical mirrors are listed in Tables 1 and 2. The diameters of spatial filter pinholes PA1 and PA2 are both 30DL, while those of PA1 and PA2 are both 40DL, as listed in Table 3. Here, as the laser beam in the system is in the square aperture, the DL is defined as[ Reference Haynam, Wegner, Auerbach, Bowers, Dixit, Erbert, Heestand, Henesian, Hermann, Jancaitis, Manes, Marshall, Mehta, Menapace, Moses, Murray, Nostrand, Orth, Patterson, Sacks, Shaw, Spaeth, Sutton, Williams, Widmayer, White, Yang and Van Wonterghem 31 ]
 \begin{align}1\mathrm{DL}=2\lambda f/D,\end{align}
Table 1 Parameters of the lenses.

Table 2 Parameters of the reflection mirrors.

Table 3 Parameters of the spatial filter pinholes.

where λ is the wavelength of the laser beam, f is the focal length of the lens, and D is the side length of the square beam. It should be noted that the laser beam is focused by L4, L5, L7, and L5 (Figure 1) for the focal spots in the pinholes PA1, PA2, PA3, and PA4, respectively.
After passing through the reverser, the laser beam is emitted back into PA3 (i.e., the third filter pinhole in PA) by M7 and collimated into a 240 mm × 240 mm aperture laser beam by lens L5 before entering into the main amplifier again. It should be noted that this time, the laser beam aperture is different from the first time (i.e., 200 mm × 200 mm). After passing through the main amplifier for third and fourth times, the laser beam extracts about 980 and 850 J of energy, respectively, and finally reaches as high as 1900 J. The outputted 1053 nm laser beam is then collimated into a 240 mm × 240 mm aperture beam by lens L6, after going through the fourth filter pinhole of PA (PA4). Then, reflected by the transport reflectors (at 7.5° incident angle), including the DM and the transport mirror (TM), the 1053 nm laser beam is injected into a KDP crystal (260 mm × 260 mm, 10 mm thickness, type I, 90° cut) and converted into a 527 nm laser beam. The conversion efficiency is about 62% and the final 527 nm laser beam could reach as high as 1178 J.
As discussed previously, in this off-axis multi-pass amplification laser system, energy is mainly provided by the large-aperture gain media (i.e., Nd:glass) in the main amplifier, and the off-axis amplification configuration ensures that the laser beam passes through the main amplifier four times to achieve high-energy extraction efficiency. The far-field image of the 1178 J, 527 nm laser is as poor as 7.93DL (diameter of the circle enclosing 80% energy) before wavefront correction (Section 3.2). In the off-axis four-pass amplification laser system, wavefront distortions, mainly comprising static and dynamic distortion[ Reference Spaeth, Manes, Widmayer, Williams, Whitman, Henesian, Stowers and Honig 32 ], could not be avoided completely. The primary source of static distortion is from fabrication imperfections and mounting stress in the optical components, especially large-aperture optics (e.g., CM, Nd:glass, L5, L6, TM), whereas dynamic distortion arises from thermal effects of the gain media in the main amplifier. Under the influence of the wavefront distortions, the beam quality degrades seriously and the brightness is limited (Figure 2), although the laser beam energy is high.
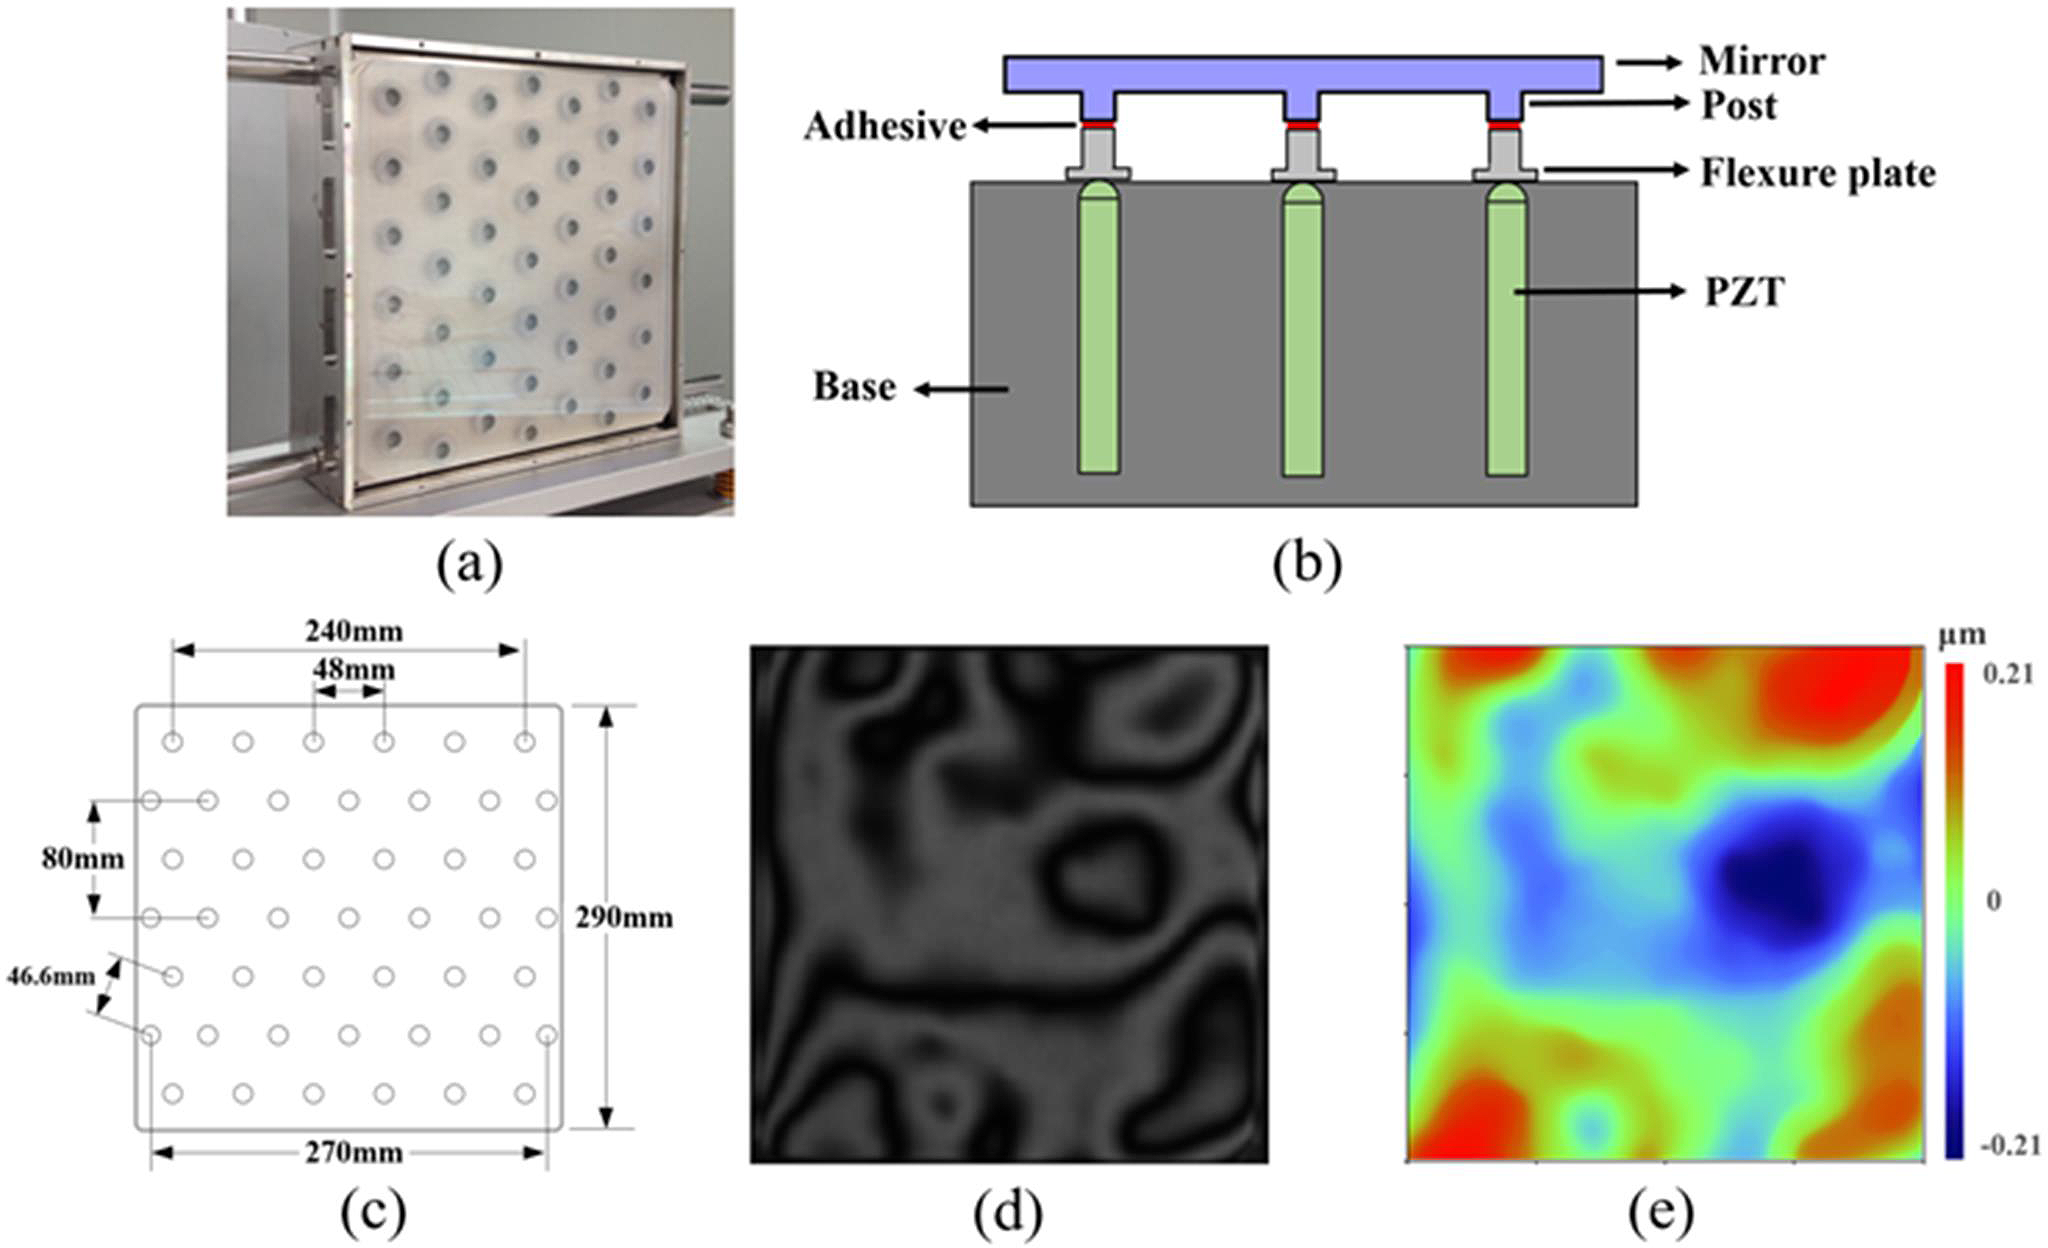
Figure 2 (a) Photo and (b) schematic diagram of the lab-manufactured DM; (c) hexagonally distributed 45 actuators in the DM; (d) interference fringe and (e) wavefront of the initial surface shape of the DM.
To improve the performance of the high-energy laser system, a complete closed-loop AO technology is used for the wavefront control from the front end to the target. As shown in Figure 1, in the complete closed-loop AO structure, an SH wavefront sensor composed of a 20 × 20 lenslet (the pitch is 250 μm and the focal length is 7.5 mm) and a CCD (Basler piA2400-17gm GigE, the pixel size is 3.45 μm × 3.45 μm) is located near the target to measure the distorted wavefront transmitted by a beamsplitter (BS; i.e., fused silica) and a focus lens (i.e., L10, biconvex lens, fused silica). The 527 nm laser beam is reflected by the BS and collimated by lens L10 before entering into the SH wavefront sensor. The BS is well polished and coated, and the peak-to-valley (PV) value and root-mean-square (RMS) value of the surface shape are 0.035 μm and 0.0067 μm, respectively. The BS, L10, and SH wavefront sensor are mounted together on a mechanical base and the distortions introduced by these optical elements are calibrated before use in the experiment. After calibration, the measured distortion will be saved and regarded as system aberration. Before operation of the kilojoule-level high-energy laser, the mechanical base is moved out of the beamline to protect the BS, lens L10, and the SH wavefront sensor from being damaged by the high-energy laser beam. A lab-manufactured DM is located after the main amplifier to provide distortion correction and beam quality improvement. In the laser system, as the parallel laser beam is focused by lens L9 and then collimated by lens L10, the distance between lenses L9 and L10 is set as 2.05 m (i.e., equal to the sum of focal lengths of lenses L9 and L10). The distance between the DM and lens L9 is set as 2 m (i.e., equal to the focal length of lens L9), and distance between the SH wavefront sensor and lens L10 is set as 50 mm (i.e., equal to the focal length of lens L10). Thus, the SH wavefront sensor is optically conjugated to the DM.
Table 4 Key parameters of the lab-manufactured DM.

Figure 2(a) displays the lab-manufactured stacked array piezoelectric DM (mirror aperture 290 mm × 290 mm), which is specially designed and fabricated for the off-axis multi-pass amplification laser system. As shown in Figure 2(b), the DM consists of a BK7 mirror with 45 mirror posts, 45 hexagonally distributed piezoelectric ceramic transducer actuators (P887.91, driving voltage range of –20 to 120 V, Physik Instrumente GmbH), a flexure plate array and a steel base. As shown in Figure 2(c), the interval between each actuator in the DM is set as 48 mm along the horizontal direction, 40 mm along the vertical direction, and 46.6 mm along the diagonal direction of the hexagon. The mirror of the DM is well polished and coated by the dielectric film (hafnium oxide, HfO2) with high reflection (99.95%) and high damage threshold (9 J/cm2) at 1053 nm and 1 ns pulse duration. The interference fringe of the initial surface of assembled DM is shown in Figure 2(d) and the corresponding surface shape is displayed in Figure 2(e) with the PV value of 0.43 μm and RMS value of 0.06 μm. The key parameters and performance features of the DM are listed in Tables 4 and 5.
Table 5 Performance of the lab-manufactured DM.

3 Simulation and experiment
3.1 Simulation analysis
To verify the wavefront distortion correction capability of the complete closed-loop AO, a numerical model was built and the simulation was implemented. As shown in Figure 3(a), the DM is set after the main amplifier in this AO configuration (denoted as configuration C1 in the simulation). Note that, in the simulation, the traditional AO configuration (denoted as configuration C2) of setting the DM at the end of the amplifier cavity is taken as a comparison (Figure 3(b)). For both configurations, wavefront distortion of the entire beamline is measured by the SH wavefront sensor located at the target and taken as the correction object.
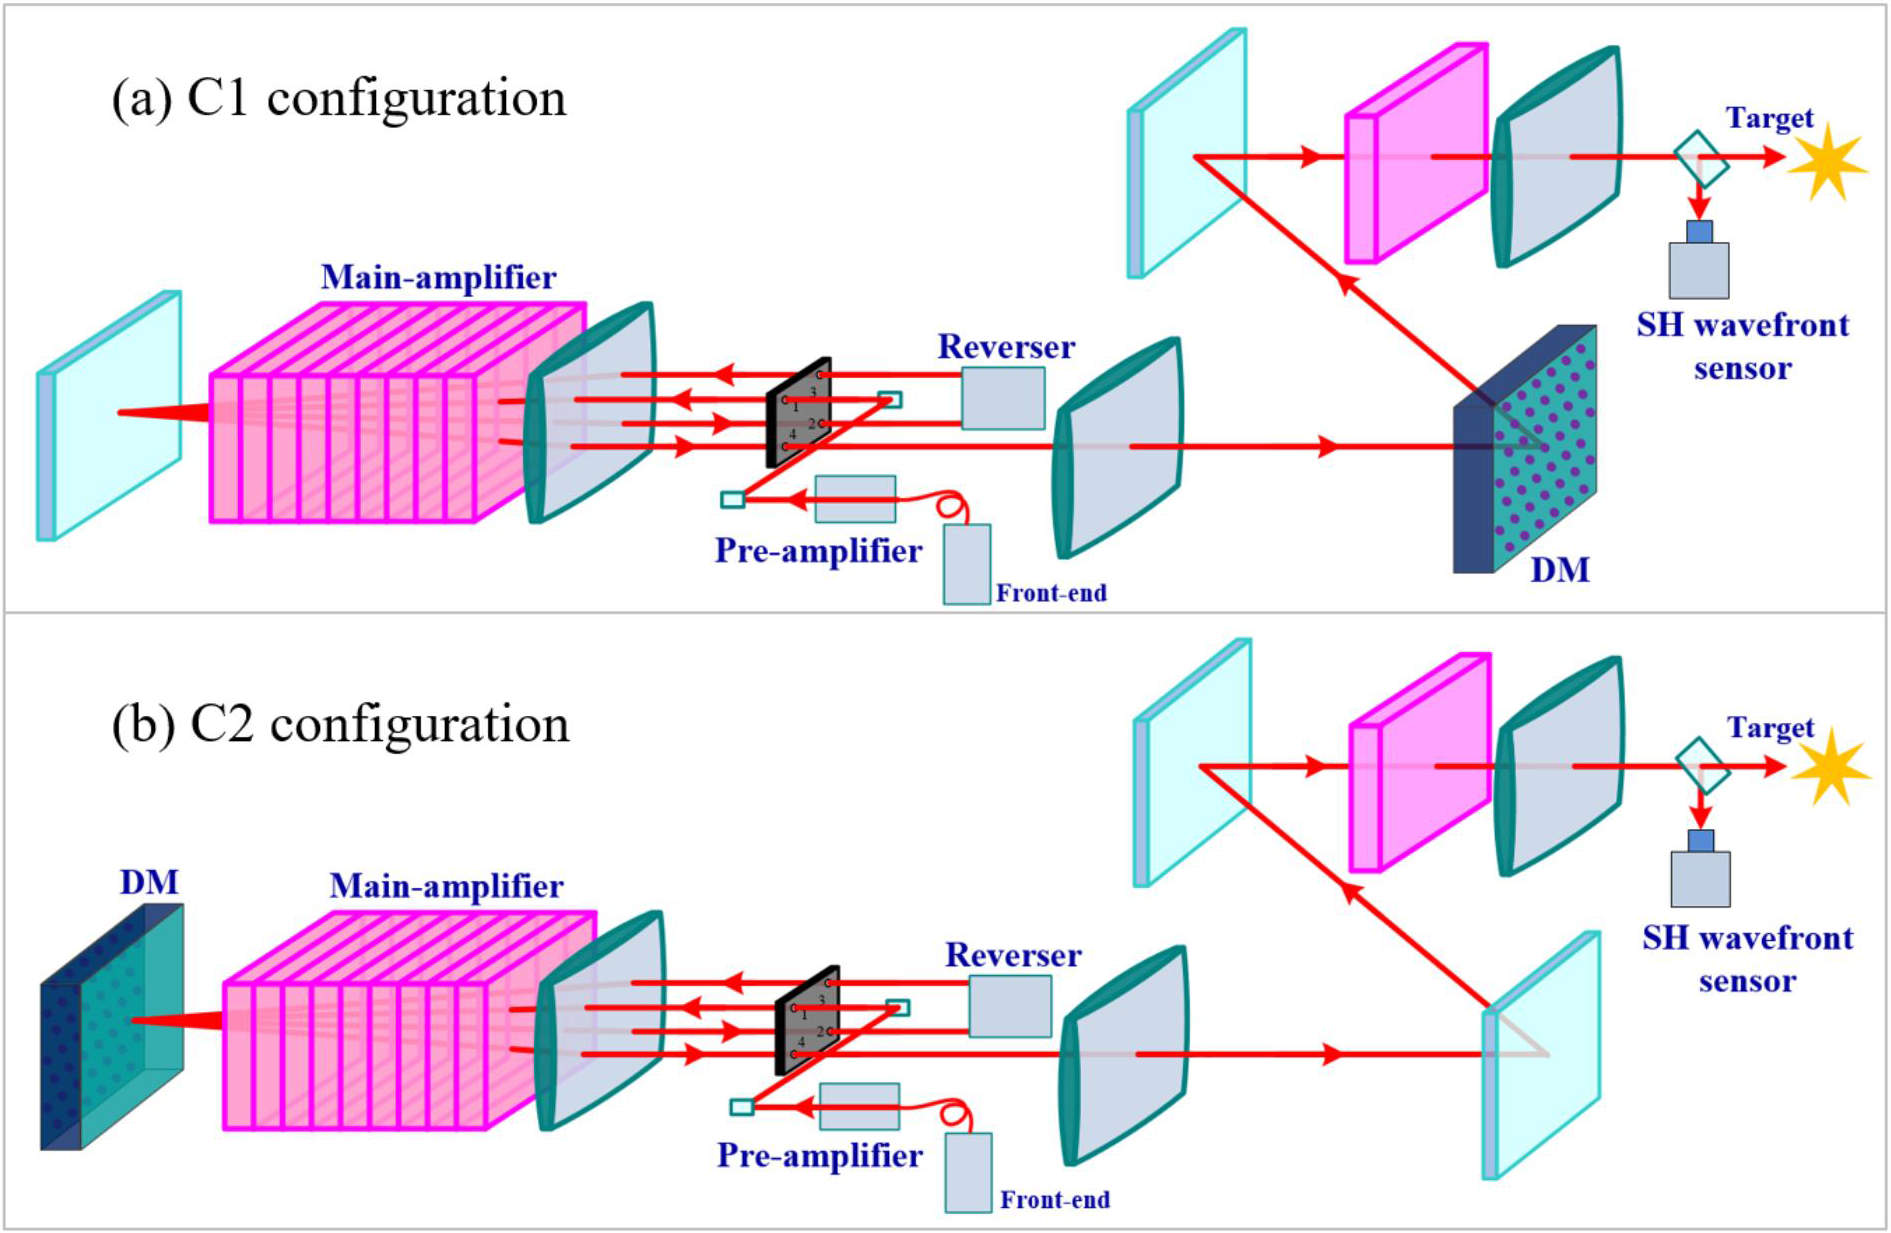
Figure 3 Optical schemes for configurations (a) C1 and (b) C2.
In configuration C1, the laser beam is reflected by the DM once the incident angle is 7.5° and the beam aperture on the DM is 240 mm × 242 mm as shown in Figure 4(a). In configuration C2, the laser beam is reflected by the DM twice (Figure 4(c)). For the first reflection, the laser beam aperture on the DM is 200 mm × 200 mm. For the second reflection, the polarization and the near field of the beam are rotated 90° and the laser beam aperture on the DM is 240 mm × 240 mm.

Figure 4 (a), (c) Laser beam on the DM in configurations (a) C1 and (c) C2. (b), (d) Influence functions for the same actuator (i.e., the actuator in the blue dashed square in (a) and (c)) for configurations (b) C1 and (d) C2.
In the simulation, a finite element model of the DM is constructed in COMSOL Multiphysics software[ Reference Tabatabaian 33 , Reference Pryor 34 ] to obtain its influence function. In the finite element model, the DM consists of a BK7 mirror with 45 mirror posts, 45 hexagonally distributed actuators, a flexure plate array, and a steel base (Figure 2). Primary parameters of the DM are listed in Tables 4 and 5. The degree of freedom of the steel base and the hysteresis of the actuator are both set to zero. The initial surface shape of the mirror is set to be an ideal plane without any distortion. In the simulation, no external force is applied on the DM, and none of the thermal performance of the DM is taken into consideration, including heating of the base material, the glass substrate, and the actuators. By using the finite element model, the influence functions of DM could be obtained. Note that the target wavefront distortion in the simulation is calculated by using Zernike polynomials and measurement data instead of this finite element model. In the wavefront correction simulation, the sizes of pinholes are set to be infinite, as they have no influence on the wavefront correction procedure.
Owing to changes in the beam size and the beam rotation, the influence functions of the same actuator are different for configurations C1 and C2. Taking the actuator marked with a blue dashed square in Figure 4(a) as an example, its influence function in configuration C1 is a common Gaussian-type shape as shown in Figure 4(b), but the function in configuration C2 has two Gaussian-type peaks as the laser beam is reflected by the DM twice. In the influence function shown in Figure 4(d), peak 1 is for the first reflected laser beam in Figure 4(c) and the same as that in Figure 4(b), whereas peak 2 is for the 90° rotated laser beam in Figure 4(c). Based on the influence function, the crosstalk of the center actuator in configuration C1 is calculated to be 0.20, whereas it is much more complex for configuration C2. Figure 5 shows the representative eigenmodes of C1 and C2 configurations, which represent the wavefront correction capability of the corresponding configuration, as the linear combinations of the eigenmodes are exactly the wavefront modes that could be achieved by the corresponding configuration[ Reference Fernández and Artal 35 ]. However, the eigenmodes of a DM in practical application are somewhat different from the ideal modes displayed in Figure 5 owing to the limited stroke of the DM.
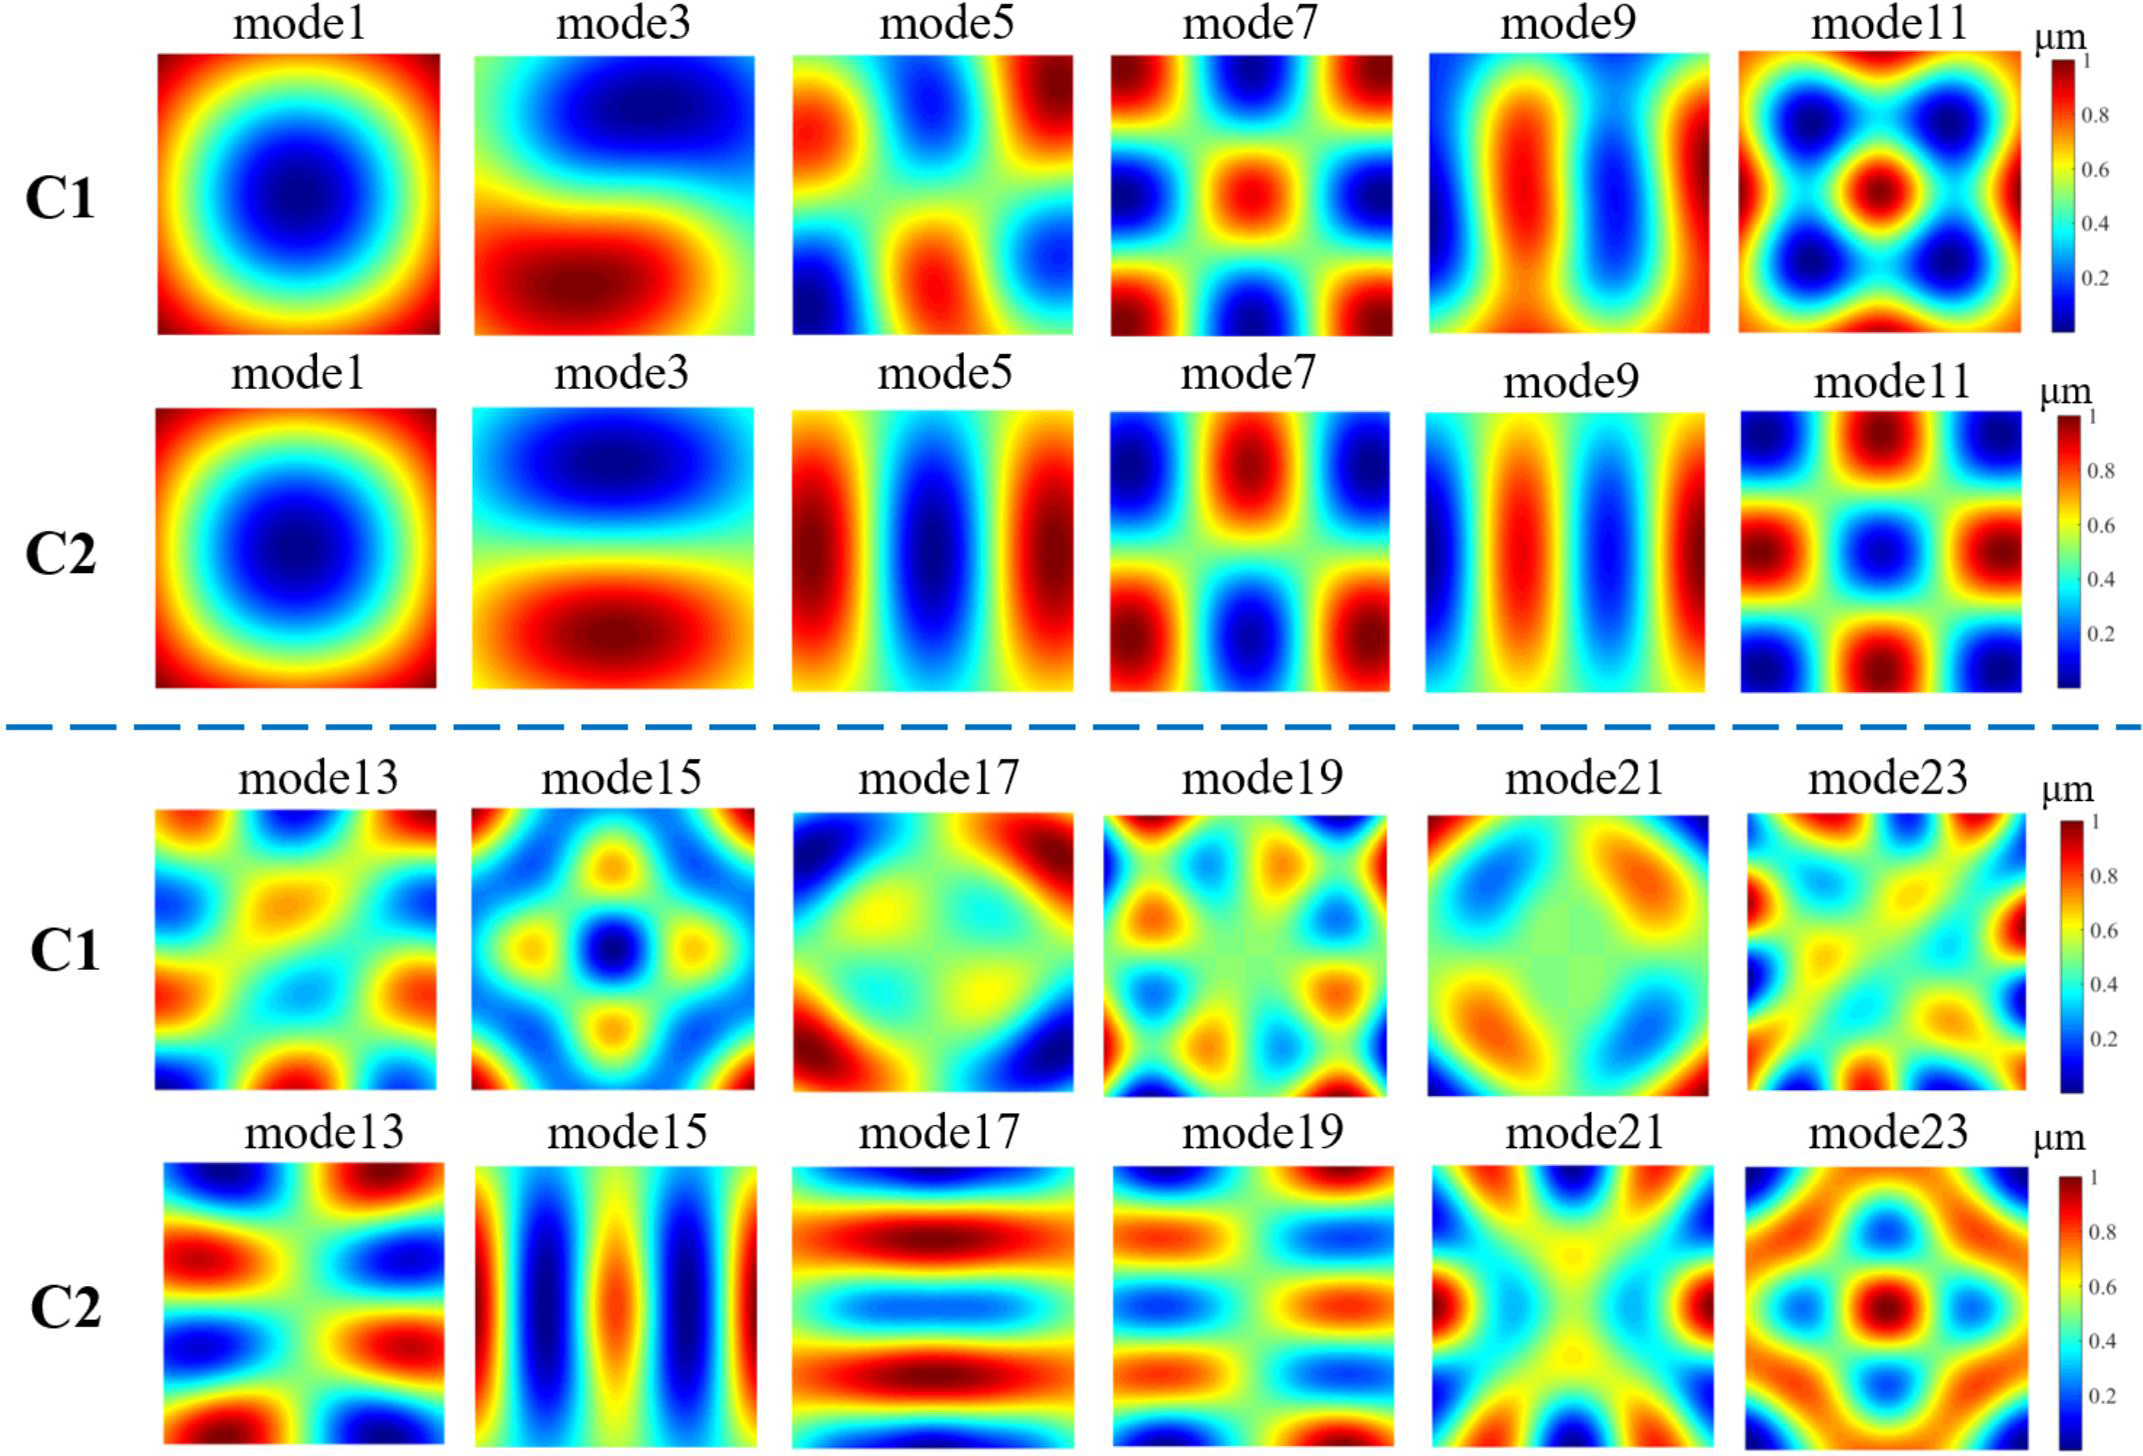
Figure 5 Comparison between the representative eigenmodes of configurations C1 and C2. The first and third rows are for configuration C1 and the second and fourth rows are for configuration C2.
To compare the correction capability of configurations C1 and C2, the 3rd to 15th Zernike-mode aberrations are taken as the target wavefront distortions[ Reference Booth, Wilson, Sun, Ota and Kawata 36 ] and the PV value of each aberration is set as 4 μm. Figure 6 shows the aberration correction results by using configurations C1 and C2. For configuration C1, the PV values of the residual errors are all less than 0.2 μm and the RMS values are less than 0.02 μm. Except for the 4th, 5th, 11th, and 12th Zernike modes (astigmatism-type aberrations, as shown in Figure 7), configuration C2 has similar correction capability to configuration C1. However, the correction capability of configuration C2 is weak and the residuals are significant (PV values are all larger than 0.4 μm and RMS values are larger than 0.05 μm) for the 4th, 5th, 11th, and 12th Zernike modes. From the analysis above, configuration C1 excels over configuration C2 in correction capability for the typical 3rd to 15th Zernike modes.

Figure 6 Correction results of configurations C1 and C2 for the 3rd to 15th Zernike-mode aberrations: (a) PV and (b) RMS values of the residual errors.

Figure 7 The 4th, 5th, 11th, and 12th Zernike modes.
As is well known, in high-energy laser systems, when laser beam passes through the pinhole, large wavefront distortion will enlarge the focal spot in the pinhole, increase the plasma-closure risk (i.e., plasma could be generated when the metal material is ionized by the laser beam) and distinctly affect the transport efficiency[ Reference Celliers, Estabrook, Wallace, Murray, Da Silva, MacGowan, Van Wonterghem and Manes 37 , Reference Murray, Milam, Boley, Estabrook and Caird 38 ]. Thus, the wavefront distortions of the laser beam passing through the pinholes PA2, PA3, and PA4 are taken into consideration in the simulation. The target static wavefront distortion is generated by random superposition of the 1st- to 15th-order Zernike polynomials, as shown in Figure 8(a). According to the reality of high-energy laser systems, the amplitude is set in the ±2 μm range for the 1st- to 5th-order polynomials, ±1 μm for the 6th- to 10th-order polynomials, and ±0.5 μm for the 11th- to 15th-order polynomials. The target dynamic wavefront distortions to be corrected in the simulation are generated according to the measurement data from the multi-pass laser system, as shown in Figure 8(b). Note that the target static and dynamic wavefront distortions of the entire beamline (shown in Figure 8) are the same for configurations C1 and C2 in the simulation.

Figure 8 The target wavefront distortions to be corrected: (a) static wavefront distortion and (b) dynamic wavefront distortion.
According to the target wavefront distortions shown in Figure 8, Figures 9(a1)–9(d1) display the wavefront distortions of the laser beam to be corrected on the image plane before pinholes PA2, PA3, and PA4 and at the target before correction, consisting of the static and dynamic wavefront distortions with the PV values of 1.32, 1.41, 2.20, and 3.43 μm, respectively. By using the fast Fourier algorithm, the far-field intensity distribution can be calculated based on the wavefront distortions and the 17th-order super-Gaussian near-field profile. The corresponding distributions of the focal spots in the pinholes PA2, PA3, and PA4 and at the target are shown in Figures 9(a2)–9(d2), with 80% energy concentrating within circles of diameters 2.61DL, 3.23DL, 5.54DL, and 8.89DL, respectively. It should be noted that the laser beam is focused by L5, L8, L5, and L9, respectively (Figure 1) for the focal spots in the pinholes PA2, PA3, and PA4 and at the target.

Figure 9 The wavefront distortions of the laser beam on the image plane before pinholes (a1) PA2, (b1) PA3, and (c1) PA4 and (d1) at the target; (a2)–(d2) are the corresponding distributions of the focal spots.
When using C1 configuration, the DM is controlled to generate a new surface shape to compensate for the wavefront distortion of the entire beamline detected by the SH wavefront sensor. The least-squares algorithm is adopted to calculate the compensation surface shape of the DM in the simulation. Figure 10(a) shows the surface shape of the DM after correction, with the PV value of 1.93 μm and the RMS value of 0.72 μm. The wavefront distortion of the 527 nm laser beam is well reduced, with the PV and RMS values of the residual error dropping to 0.37 μm and 0.07 μm (Figure 10(c)), respectively. The diameter of the circle enclosing 80% energy of the focal spot is about 1.12DL (Figure 10(d)). As the DM is located after the main amplifier and spatial filter, the wavefront distortions of the laser beam in the pinholes PA2, PA3, and PA4 are unaffected by the DM and remain unchanged.

Figure 10 (a), (b) Generated surface shapes of the DM to compensate the wavefront distortions for configurations C1 and C2, respectively; (c) residual wavefront error at the target after correction by using configuration C1; (d) distribution of the target focal spot after correction by using configuration C1.
When using configuration C2, the DM is set as the cavity mirror of the main amplifier. As shown in Figure 10(b), when the DM is adjusted to compensate for the wavefront distortion of the entire beamline, the wavefront distortion of the laser beam passing through the main amplifier will be obviously influenced by the new surface shape of the DM (Figure 10(b); PV value of 5.25 μm and RMS value of 1.83 μm). Similar to the correction result for configuration C1, the wavefront distortion of the 527 nm laser beam is well reduced with the PV value of 0.61 μm and RMS value of 0.12 μm (Figure 11(d1)) after correction. However, the wavefront distortions of the laser beam on the image plane before pinholes PA2, PA3, and PA4 grow worse. Figures 11(a1)–11(c1) demonstrate the wavefront distortions of the laser beam on the image plane before pinholes PA2, PA3, and PA4 with PV values of 7.02, 8.01, and 2.43 μm, respectively, after the wavefront distortion of the entire beamline is corrected. The distributions of the focal spots are shown in Figures 11(a2)–11(d2), corresponding to the wavefront shown in Figures 11(a1)–11(d1). As seen from Figure 11(b2), the intensity distribution of the focal spot in the pinhole PA3 is as poor as 13.83DL (80% energy encircled) in diameter, which would bring serious plasma-closure risk and cause fatal damage to the optical components.

Figure 11 Residual errors of the wavefront distortions on the image plane before pinholes (a1) PA2, (b1) PA3, and (c1) PA4 and (d1) at the target after correction by using the configuration C2; (a2)–(d2) corresponding distributions of the focal spots.

Figure 12 Experimental results: (a) static wavefront distortion of the entire beamline; (b) dynamic wavefront distortion of the main amplifier; (c) total wavefront distortion of the entire beamline composed of static and dynamic wavefront distortions; (d) residual error of the wavefront distortion at the target after correction; (e) distribution of the focal spot at the target before correction; (f) distribution of the focal spot at the target after correction.
From the simulation results, the complete closed-loop AO configuration (i.e., configuration C1) has the unique advantage in the entire beamline wavefront distortion correction and beam quality improvement for the off-axis multi-pass amplification laser system.

Figure 13 Measured wavefront distortion of the 527 nm laser at the target and the corresponding distribution of the focal spot for: (a1), (a2) the first shot; (b1), (b2) the second shot; (c1), (c2) the third shot.
3.2 Experiment and discussion
Based on the off-axis multi-pass amplification and the complete closed-loop AO configuration (i.e., configuration C1), a verification experiment is carried out and the 527 nm, 1 ns, and 1178 J laser with near diffraction limited beam quality is achieved. In the experiment, before the 527 nm, 1178 J laser works, the static and dynamic wavefront distortions of the entire beamline are measured and then superposed together to form the to-be-corrected target distortion.
First, a 1053 nm front-end seed beam (1 Hz, 15 μJ, 1 ns), coming out from the front-end part and passing through the pre-amplifier and main amplifier, is converted into a 527 nm laser beam (1 Hz, 5 nJ, 1 ns) by the KDP crystal, whereas the pre-amplifier and main amplifier are on standby. The 527 nm beam is detected and the static wavefront distortion of the entire beamline is measured by the SH wavefront sensor at the target. Figure 12(a) shows the measured static wavefront distortion of the entire beamline with the PV value of 2.21 μm.
Second, the thermal distortion of the main amplifier is measured, which is taken as the primary dynamic distortion of the entire laser system. In the measurement, the flashlamps in the main amplifier are activated and the main amplifier is set to work. The 1053 nm front-end seed beam (single pulse, 1 μJ, 1 ns) from the front-end part is amplified to about 1 mJ by the main amplifier and converted into about 5 μJ by the KDP crystal. By setting the acquired static wavefront distortion as the reference, the thermal distortion of the Nd:glass in the main amplifier is measured by the SH wavefront sensor. Note that a 0.1% attenuator (i.e., OD 3.0 filter, with OD referring to optical density) is added in front of the SH wavefront sensor to avoid laser beam damage in the dynamic distortion measurement. Figure 12(b) shows the measured dynamic distortion of the entire beamline with a PV value of 2.70 μm. Note that, during these two steps, the DM maintains its initial surface shape (i.e., Figures 2(d) and 2(e)) without any driving voltage exerted on it.
Third, taking the acquired static and dynamic wavefront distortions as the correction object, the entire beamline wavefront distortion is corrected by the DM and the final control voltage matrix of the actuators in the DM is calculated and stored. When the pre-amplifier and main amplifier cool down completely, the 1053 nm front-end seed beam (1 Hz, 15 μJ, 1 ns) is emitted from the front-end part. After passing through the laser system, the 1053 nm laser beam is converted into a 527 nm laser beam by the KDP crystal and then gets into the SH wavefront sensor. By using the 1 Hz 527 nm front-end seed beam, the influence functions of the DM can be measured by the SH wavefront sensor and recorded. The total distortion of the entire beamline is obtained with a PV value of 3.32 μm as shown in Figure 12(c) by superposing the static and dynamic wavefront distortions. Based on the total distortion and the influence functions of the DM, a least-squares algorithm is employed to calculate the driving voltage matrix of the actuators in the DM, whereas the residual error is taken as the judgment criterion. After five iterations, the PV value of the residual error converges to a stable value, thus the control loop being accomplished. Then, the final driving voltage matrix of the actuators in the DM is achieved and stored. Figure 12(d) displays the residual error of the corrected wavefront with a PV value of 0.28 μm and RMS value of 0.06 μm. The distribution of the focal spot at the target before correction is shown in Figure 12(e), where the x-axis and y-axis are both scaled from –7.5DL to 7.5DL. The diameter of the circle enclosing 80% energy of the focal spot is 7.93DL. The distribution of the focal spot at the target after correction is displayed in Figure 12(f), where the x-axis and y-axis are both scaled from –3DL to 3DL. After correction, the intensity of the focal spot is highly concentrated and the diameter of the circle enclosing 80% energy is as small as 1.16DL.
Considering that the thermal distortion of the main amplifier could be regarded approximately as the same for other laser shots, the wavefront distortion of the entire beamline could be taken as a constant value. Thus, the ultimate surface shape of the DM, which is aimed to achieve the distortion correction in the third step, could be used to realize pre-correction for dynamic laser shots of this multi-pass amplification laser system. In the experiment, the driving voltages exerted on the DM are kept unchanged and correspondingly the surface shape of the DM remains stable during the laser operation. Figure 13 shows the measurement results for three consecutive laser shots. Note that the interval time between two adjacent shots is set as no less than 2 hours to ensure the main amplifier cools down completely. Figures 13(a1)–13(c1) and 13(a2)–13(c2) show the measured wavefront distortions of the 527 nm laser beam at the target and the corresponding distributions of the focal spot for the first, second, and third shot, respectively. The PV values of the residual errors are 0.40, 0.43, and 0.44 μm and the RMS values are 0.06, 0.07, and 0.07 μm, respectively, whereas the diameters of the circles enclosing 80% energy of the focal spots are 1.30DL, 1.29DL, and 1.33DL respectively, as listed in Table 6. It should be noted that the slight differences between the correction effects for the three laser shots result from the dynamic distortion varieties and the thermal residual. In the future, real-time measurement technique for thermal distortion and optimized correction algorithm would be considered to use for improving the beam quality further.
Table 6 Residual errors and beam quality for three consecutive shots.

4 Conclusion
In conclusion, a 1178 J near diffraction limited 527 nm laser has been achieved by using an off-axis multi-pass amplification structure composed of a front-end part, pre-amplifier, main amplifier, spatial filter, reverser, SHG, and target using a complete closed-loop AO configuration consisting of an SH wavefront sensor and a DM. In the laser system, the main amplifier is one of the most important parts providing more than 99.9% energy for the 1053 nm laser beam, which reaches as high as 1900 J after passing through the main amplifier four times. The 1053 nm laser beam is converted into a 527 nm laser beam by a KDP crystal with a conversion efficiency of 62%, energy of 1178 J, and beam quality of 7.93DL. A complete closed-loop AO configuration has been adopted to compensate for the wavefront distortion of the laser system and improve the beam quality of the laser beam by using a lab-manufactured DM and a least-squares algorithm. After correction, the diameter of the circle enclosing 80% energy is 1.29DL and the intensity of the focal spot is highly concentrated. Thus, the beam quality of the 1178 J, 527 nm laser is improved up to near DL.
Funding
This work was supported by the National Natural Science Foundation of China (Nos. 61775199 and 61775112).
Disclosure
The authors declare that there are no conflicts of interest related to this article.


 Open access