


Between 28 and 35 % of older individuals aged ≥65 years experience at least one fall annually, with this proportion increasing to 32–42 % in ≥75 year age group( Reference Masud and Morris 1 ). As elderly women are at an increased risk of falling compared with their male counterparts( Reference Gale, Cooper and Aihie Sayer 2 , Reference Johansson, Nordström and Nordström 3 ), research specific to this population is warranted.
In addition to the fall itself, complications, especially fractures, often further reduce quality of life and increase healthcare costs( Reference Masud and Morris 1 , Reference Ambrose, Paul and Hausdorff 4 ). Falls propensity risk factors in the elderly include age, sex, number of chronic diseases, body composition, muscular strength and poor physical function( Reference Ambrose, Paul and Hausdorff 4 , Reference Deandrea, Lucenteforte and Bravi 5 ). Thus, the interventions capable of improving any or a combination of these risk factors have the potential to reduce falls propensity. Typically, previous studies have concentrated on physical function measures or other comorbidities, while nutritional aspects have often been overlooked. Considering that suboptimal nutrition is a well-known problem and risk factor for frailty in the elderly( Reference Payette, Coulombe and Boutier 6 ), this area warrants closer examination.
The health benefits of high vegetable and fruit diets are recognised in public health guidelines. Benefits relate to reduced risk of cancer, CVD and all-cause mortality( Reference van Berleere and Dauchet 7 ). In relation to neuromuscular disease, higher vegetable and fruit intakes in the elderly have been linked to greater muscle strength and mass( Reference Kim, Lee and Kye 8 – Reference Neville, Young and Gilchrist 11 ) and physical function( Reference Myint, Welch and Bingham 12 ), all of which are falls propensity risk factors for this population. Despite these benefits, the magnitude of the influence of vegetable and fruit consumption on the risk of falling remains unknown.
The primary aim of this investigation was to examine the associations of whole food vegetable and fruit intakes, separately, with 14·5 years of falls-related hospitalisations in a prospective cohort of postmenopausal women aged ≥70 years. Specific vegetable and fruit types were also examined for their relationship to falls-related hospitalisations. In addition, the associations of vegetable and fruit intake with markers of muscular strength and physical function, including grip strength and timed-up-and go (TUG), which may lie upon the aforementioned causal pathway, were also examined.
Methods
Study population
The population included females in the Perth Longitudinal Study of Aging in Women (PLSAW). The women were originally recruited to a 5-year, double-blind, randomised controlled trial of daily Ca supplementation to prevent fracture, the calcium intake fracture outcome study (CAIFOS). The women were included on the basis of an expected survival beyond 5 years and not receiving any medication (including hormone replacement therapy) known to affect bone metabolism and has been previously described( Reference Prince, Devine and Dhaliwal 13 ). The women (n 1500) were recruited from the Western Australian general population of women aged ≥70 years by mail using the electoral roll, which is a requirement of Australian citizenship. At the completion of the 5-year trial, women were invited to participate in two follow-up observational studies. Total duration of follow-up was 14·5 years. A total of 1485 women completed an FFQ at baseline in 1998. Participants (n 17/1485, 1·1 %) with implausible energy intakes (<2100 kJ (500 kcal) or >14 700 kJ (3500 kcal)) or undertaking vitamin D supplementation (due to its link with falls( Reference Bischoff-Ferrari, Dawson-Hughes and Willett 14 ), n 39/1485) were not included in the analysis. The current study then included 1429 women (online Supplementary Fig. S1). All participants provided written informed consent. Ethics approval was granted by the Human Ethics Committee of the University of Western Australia. Both studies were retrospectively registered on the Australian New Zealand Clinical Trials Registry (CAIFOS trial registration number #ACTRN12615000750583 and PLSAW trial registration number #ACTRN12617000640303) and complied with the Declaration of Helsinki. Human ethics approval for the use of linked data was provided by the Human Research Ethics Committee of the Western Australian Department of Health (project number #2009/24).
Dietary assessment
Dietary intake was assessed at baseline (1998) using a self-administered, semiquantitative FFQ developed and validated by the Cancer Council of Victoria( Reference Hodge, Patterson and Brown 15 – Reference Woods, Stoney and Ireland 17 ). The women were supported when completing the questionnaire by a research assistant. Food models and food charts as well as measuring cups and measuring spoons were provided to ensure the accuracy of reported food consumption. The Cancer Council of Victoria calculated energy (kJ/d) and nutrient intakes by using the NUTTAB95 food composition database( Reference Lewis, Milligan and Hunt 18 ) and other sources where necessary. Intakes of individual food items were calculated in g/d. This included twenty-four vegetables and eleven fruits. The diet assessment analysis also included estimates of protein, Ca and alcohol intakes.
Vegetable and fruit intake
The intake of vegetables and fruits was calculated in serves per d. This was based on the 2013 Australian Dietary Guidelines of one serve of vegetables equivalent to 75 g and one serve of fruit equivalent to 150 g( 19 ). Serves per d were calculated as continuous variables and then categorised as discrete variables (vegetables: <2 serves, 2 to <3 serves, ≥3 serves; fruit: <1 serve, 1 to <2 serves, ≥2 serves). Estimations of vegetable intake did not include ‘potatoes, roasted or fried, including hot chips’ as hot chips are not recommended as part of a healthy diet( 19 ). ‘Potatoes cooked without fat’ were included. Estimations of fruit intake did not include ‘tinned or frozen fruit (any kind)’ or ‘fruit juice’ as foods and drinks containing added sugars are not recommended as part of a healthy diet( 19 ).
Vegetable and fruit type
Vegetables were grouped into five types and based on the 2013 Australian Dietary Guidelines( 19 ) and modified slightly to include cruciferous vegetables (cabbage, Brussels sprouts, cauliflower and broccoli), allium vegetables (onion, leek and garlic), yellow/orange/red vegetables (tomato, capsicum, beetroot, carrot and pumpkin), leafy green vegetables (lettuce and other salad greens, celery, silverbeet and spinach) and legumes (peas, green beans, bean sprouts and alfalfa sprouts, baked beans, soyabeans, soyabean curd and tofu and other beans). For fruits, classification of type included apples and pears (pome fruit), oranges and other citrus (citrus), bananas and other fruits (melon, pineapple, strawberries, apricots, peaches, mango and avocado). Intakes of vegetable and fruit types were calculated in g/d as continuous variables. Intakes of vegetable types were also categorised as discrete variables into quartiles of intake.
Nutrient-rich foods index
Overall diet quality was assessed using the nutrient-rich foods index by calculating nutrient density scores( Reference Fulgoni, Keast and Drewnowski 20 ). This index was adapted using the Nutrient Reference Values for Australia and New Zealand based on adult females aged >70 years( 21 ). The calculation of the nutrient-rich foods index in this cohort of older women has been described previously( Reference Blekkenhorst, Bondonno and Lewis 22 ).
Falls outcome assessment
Falls outcomes over 14·5 years were tracked through the Western Australian Data Linkage System (Department of Health Western Australia, East Perth, Australia). Data on injurious falls were retrieved from the Western Australia Hospital Morbidity Data System. Records were obtained for each of the study participants from 1998 until 2013 using the international classification of external causes of injury codes and the international classification of diseases (ICD) coded diagnosis data pertaining to all public and private inpatient admissions in Western Australia. This allows complete ascertainment of hospitalisations independent of self-report and avoids the problems of patient self‐reporting and loss to follow‐up. Falls from standing height or less, not resulting from external force, were included (ICD‐10 codes): W01, W05‐W08, W10, W18, and W19.
Baseline characteristic assessment
Questionnaires completed at baseline were used to assess values for potential confounding variables including age, physical activity and smoking history. Participants were asked about participation in sport, recreation and/or regular physical activities undertaken in the 3 months before their baseline visit. This has previously been described in greater detail within this cohort( Reference Bruce, Devine and Prince 23 , Reference Devine, Dhaliwal and Dick 24 ). The level of activity, expressed in kJ/d, was then calculated using a validated method applying the type of activity, time engaged in the activity, and the participant’s body weight( Reference McArdle, Katch and Katch 25 ). Smoking status was coded as non-smoker or smoked ever (if they had smoked more than one cigarette per d for more than 3 months at any time in their life or is a current smoker). Body weight was measured using digital scales to the nearest 0·1 kg and height was assessed using a wall-mounted stadiometer to the nearest 0·1 cm, both whilst participants were wearing light clothes and without socks and shoes. BMI (kg/m2) was then calculated. Lean appendicular muscle mass was assessed using a Hologic Acclaim QDR4500A (Hologic Corp.) dual-energy X-ray absorptiometry machine. Treatment (placebo or Ca) over the 5 years of the CAIFOS trial was included as a covariate. Current medication use at baseline was used to assess prevalent diabetes mellitus. Medications were verified by participants’ general practitioner where possible and were coded (T89001–T90009) using the International Classification of Primary Care-Plus method which allows aggregation of different terms for similar pathologic entities as defined by the ICD-10 coding system( Reference Britt, Scahill and Miller 26 ). Socio-economic status (SES) was calculated using the socio-economic indexes for areas developed by the Australian Bureau of Statistics which ranked residential postcodes according to relative socio-economic advantage and disadvantage( 27 ). Participants were then coded into six groups from the top 10 % most highly disadvantaged to the top 10 % least disadvantaged.
Markers of muscle strength and physical function
Grip strength and TUG were assessed at baseline. Grip strength was used to assess muscular strength of the upper limb, and measures the amount of force the forearm flexors can produce using a dynamometer (Jamar Hand Dynamometer; Lafayette Instrument Company). TUG was adopted to assess physical function and measure the time it takes an individual to rise from a chair, walk 3 m and turn around to return to sit on the chair. It is a commonly adopted method to assess functional mobility among older adults in geriatric clinics to evaluate physical performance( Reference Podsiadlo and Richardson 28 ).
Statistical analysis
Statistical analysis was performed using IBM SPSS Statistics for Windows, version 24.0 (IBM Corp.) and Stata software, version 14 (StataCorp LLC). Statistical significance was set at a two-sided type 1 error rate of P<0·05 for all tests. Descriptive statistics of normally distributed continuous variables were expressed as mean values and standard deviations. Non-normally distributed continuous variables (physical activity, alcohol intake and all fruit types) were expressed as median and interquartile range. Categorical variables were expressed as number and proportion (%). Baseline characteristics were tested for differences across vegetable and fruit intake categories using one-way ANOVA for normally distributed continuous variables, the Kruskal–Wallis test for non-normally distributed variables and the χ 2 test for categorical variables.
The primary outcome of the study was falls-related hospitalisations with the primary exposure variable being vegetable and fruit consumption, while the secondary outcome variables of interest were muscle strength (weak grip strength; <22 kg)( Reference Duchowny, Peterson and Clarke 29 ) and physical function (slow TUG; >10·2 s)( Reference Zhu, Devine and Lewis 30 ), due to their association with adverse health outcomes (e.g. weakness, risk of falling, fractures). We had 14·5 years of follow-up falls-related hospitalisations and deaths for all women that remained in Western Australia over the study period. The follow-up time period for each participant commenced from their baseline visit date until the first fall-related hospitalisation or loss to follow-up due to death or end of the study follow-up period (14·5 years). Kaplan–Meier curves and the log-rank test were used to assess univariate associations between fruit/vegetable consumption and fall-related hospitalisations. A Cox proportional hazards modelling was used to assess the adjusted associations between vegetable intake, fruit intake, grip strength, TUG and falls-related hospitalisation. In all, three models of adjustment were adopted based on hypothesised causal pathways in the relationship between vegetable and fruit consumption and the risk of hospitalised falls (online Supplementary Fig. S2): age-adjusted, multivariable-adjusted and multivariable-adjusted+grip strength+TUG. The multivariable-adjusted model included age, BMI, treatment code (Ca or placebo), prevalent diabetes mellitus, SES, physical activity, ever smoked and intakes of energy, protein, Ca and alcohol. Associations were explored using vegetable and fruit intake, separately, as continuous variables and then as discrete variables. We also tested for evidence of linear trends across categories of discrete variables using the median value for each category as continuous variables in separate Cox proportional hazards models. Cox proportional hazards assumptions were tested using log–log plots, which were shown to be parallel indicating that proportional hazards assumptions were not violated. For the primary analysis, we treated deaths as censored. This cause-specific approach meant that the hazard ratios (HR) could be interpreted as the relative risk of a fall-related hospitalisation within the follow-up period assuming an individual remains alive. This approach assumes that the risk of a fall would have remained the same during the remainder of the follow-up period in those that died and in those that did not. This model was chosen as we have previously demonstrated that fruit and/or vegetable intakes are associated with mortality risk and fractures in this cohort using the same cause-specific approach( Reference Hodgson, Prince and Woodman 31 , Reference Blekkenhorst, Hodgson and Lewis 32 ). Falls-related hospitalisation absolute risk difference (ARD) and number need to treat to prevent one fall was calculated between women with high (≥3 serves/d) v. low (<2 serves/d) vegetable intake.
All five vegetable types were examined individually in separate multivariable-adjusted Cox proportional hazards models to determine their association with falls-related hospitalisation. The relationship between the five separate vegetable types as well as total vegetable intake was investigated using Spearman’s rank order correlation (ρ). Subsequently, to examine the associations for the five specific vegetable types, a multivariable-adjusted Cox proportional hazards model with the five vegetable types as individual variables was assessed. Variance inflation factor for each of the five vegetable types were low (1·08–1·29), suggesting minimal multicollinearity. In addition, since weak grip strength( Reference Duchowny, Peterson and Clarke 29 ) and slow TUG( Reference Zhu, Devine and Lewis 30 ) are associated with adverse fall-related outcomes, OR for these variables by vegetable and fruit serve intake categories in both the age and multivariable-adjusted models were calculated using logistic regression.
Additional analyses
The impact of grip strength and TUG on the relationship between total vegetable intake and fall-related hospitalisations was investigated by including grip strength and TUG in the multivariable-adjusted model with vegetable intake. Since vegetable intake may also be considered a surrogate marker of a healthier diet, we adjusted for diet quality using the nutrient-rich foods index in the multivariable-adjusted Cox proportional hazards model for all falls-related hospitalisations. This was separately completed for cruciferous and total vegetable intake. To examine the possibility of reverse causality (i.e. increased frailty potentially affecting vegetable consumption), a sensitivity analysis in which participants who experienced a falls-related hospitalisation within first 2 years were removed from the multivariable-adjusted Cox proportional hazards model and effect estimates were compared with those from the primary analysis.
Results
Vegetable consumption
Participant baseline characteristics according to serves of vegetables per d are presented in Table 1. Daily total vegetable intake was 196·7 (sd 79·3) g, equating to 2·6 (sd 1·1) serves. Daily intake of the different vegetable types (in descending order of weight) were as follows: yellow/orange/red vegetables 51·8 (sd 27·5) g, cruciferous vegetables 32·1 (sd 21·9) g, legumes 27·5 (sd 18·6) g, leafy green vegetables 18·7 (sd 12·0) g and allium vegetables 7·8 (sd 6·8) g. Variables including energy, protein and Ca intake, as well as grip strength and TUG, were greater (or faster) (P<0·05) in high vegetable consumers (≥3 serves/d).
Table 1 Baseline characteristics in all participants and by vegetable serve intake categories (Numbers and percentages; mean values and standard deviations; medians and interquartile ranges (IQR))
* Vegetable serves were calculated based on the 2013 Australian Dietary Guidelines of a vegetable serve equal to 75 g/d.
† P values are a comparison between groups using ANOVA, Kruskal–Wallis test and χ 2 test where appropriate.
Vegetable intake and prospective falls-related hospitalisation
Over 14·5 years (15 539 person-years) of follow-up (10·9 (sd 4·2) years), 39·7 % (568/1429) of participants experienced a fall-related hospitalisation. Specifically, for <2 and ≥3 serves of vegetables per d, 42·8 and 35·7 % of the participants experienced a fall-related hospitalisation, respectively (Table 2). The Kaplan–Meier survivor function for unadjusted falls-related hospitalisation risk was significantly different (P=0·007) among vegetable serve categories (Fig. 1). In the multivariable-adjusted model, increased total vegetable intake was inversely associated with falls-related hospitalisations (Table 2). High vegetable intakes (≥3 serves/d) were associated with a 26 % hazard reduction in falls-related hospitalisations compared with low vegetable intakes (<2 serves/d) (Table 2). Finally, compared with low vegetable intake (<2 serves/d), women with high (≥3 serves/d) vegetable intake had a 7·1 (95 % CI 0·6, 13·6) % ARD, for a falls-related hospitalisation. The number needed to adopt a high vegetable intake (≥3 serves/d) to prevent one fall-related hospitalisation was 14 (95 % CI 7, 163) compared with low vegetable intake (<2 serves/d).
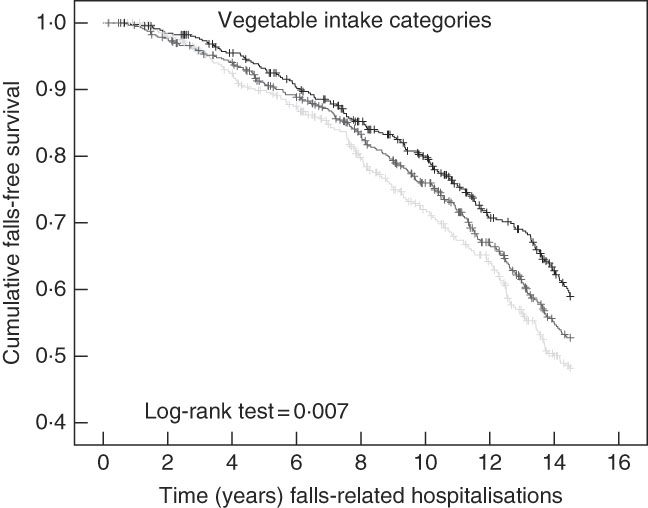
Fig. 1 Kaplan–Meier survival curve for vegetable intake categories on falls-related hospitalisations. Low: <2 serves/d, moderate: 2 to <3 serves/d and high: ≥3 serves/d intake categories are represented by the light grey, grey and black lines, respectively.
Table 2 Falls-related hospitalisation by vegetable and fruit serve intakeFootnote * (Hazard ratios (HR) and 95 % confidence intervals)
Ref., referent.
* HR (95 % CI) for falls-related hospitalisation by vegetable and fruit serve intake analysed using Cox proportional hazard models.
† Vegetable and fruit serves were calculated based on the 2013 Australian Dietary Guidelines of a vegetable and fruit serve equal to 75 and 150 g/d, respectively.
‡ Test for trend conducted using median value for each vegetable (1·6, 2·5 and 3·6 serves/d) and fruit serve category (0·7, 1·5 and 2·5 serves/d).
§ Multivariable-adjusted model included age, BMI, treatment code, prevalent diabetes mellitus, socio-economic status, physical activity, smoking history and energy, protein, Ca and alcohol intake.
Vegetable types and prospective falls-related hospitalisation
When examining specific vegetable types, intake of cruciferous vegetables (per 20 g serve) had the strongest inverse association with falls-related hospitalisations (P=0·015 for fully adjusted model) (Table 3). Lower hazards for falls-related hospitalisation was recorded for quartiles 2 (25 %), 3 (21 %) and 4 (22 %), compared with quartile 1 of cruciferous vegetable intake (Table 3). However, there was no statistically significant dose–response trend across intake quartiles (P trend=0·085). For both allium and yellow/orange/red vegetables, total intake per serve (10 and 20 g/d, respectively) was not associated with falls-related hospitalisations (P>0·05); however, a significant trend across quartiles was recorded (P trend=0·012, 0·044, respectively). Compared to the lowest intake of cruciferous, allium and yellow/orange/red vegetables (quartile 1), women in quartile 4 of each vegetable type had a 6·6 (95 % CI −0·6, 13·9), 8·3 (95 % CI 1·2, 15·4) and 5·4 (95 % CI −1·8, 12·5) % ARD for falls-related hospitalisation, respectively. The number of women needed to adopt a high vegetable intake (quartile 4 compared with quartile 1) to prevent one falls-related hospitalisation specific to cruciferous, allium and yellow/orange/red vegetables was 15 (95 % CI 7, ∞), 12 (95 % CI 6, 83) and 19 (95 % CI 8, ∞), respectively. Correlations for the five different vegetables classes and total vegetable intake are presented in online Supplementary Table S3. In a multivariable-adjusted Cox proportional hazards model including all five classes of vegetables simultaneously, significant model parameters for falls-related hospitalisations included age (HR: 1·13 (95 % CI 1·10, 1·16), P<0·001), diabetes (HR: 1·14 (95 % CI 1·01, 1·95), P=0·043) and cruciferous vegetables (HR: 0·90 (95 % CI 0·82, 0·97), P=0·010).
Table 3 Multivariable-adjusted hazard ratios (HR) for falls-related hospitalisation by vegetable typeFootnote * (HR and 95 % confidence intervals)
Q, quartiles; Ref., referent.
* Multivariable-adjusted HR (95 % CI) for falls-related hospitalisation by vegetable type analysed using Cox proportional hazard models, adjusted for age, BMI, treatment code, prevalent diabetes mellitus, socio-economic status, physical activity, smoking history and energy, protein, Ca and alcohol intake.
† Quartiles for cruciferous vegetables were Q1 (<15 g/d), Q2 (15–28 g/d), Q3 (29–44 g/d), Q4 (>44 g/d); allium vegetables were Q1 (<3 g/d), Q2 (3–6 g/d), Q3 (7–11 g/d), Q4 (>11 g/d); yellow/orange/red vegetables were Q1 (<32 g/d), Q2 (32–47 g/d), Q3 (48–68 g/d), Q4 (>68 g/d); leafy green vegetables were Q1 (<9 g/d), Q2 (9–16 g/d), Q3 (17–25 g/d), Q4 (>25 g/d); and legumes were Q1 (<15 g/d), Q2 (15–23 g/d), Q3 (24–36 g/d), Q4 (>36 g/d).
‡ Results are presented per 10 g/d for allium vegetables and per 20 g/d for all other vegetable types.
§ Test for trend conducted using median values of each quartile of vegetable type.
Vegetable intake, muscle strength and physical function
Online Supplementary Table S1 shows the OR of weak grip strength for vegetable intake (per 75 g serve) for both the age (P=0·006) and multivariable-adjusted models (P=0·014). An increase in vegetable serve intake reduced the odds of weak grip strength by 13 %. Compared with low vegetable intake (<2 serves/d), high vegetable intake (≥3 serves/d) was associated with a 31 % lower odds of weak grip strength in both the age (P=0·008) and multivariable-adjusted models (P=0·021). An inverse association was also demonstrated between vegetable intake and slow TUG in the multivariable-adjusted model (P=0·032), with a 12 % lower odds of slow TUG for every 75 g/d increase in vegetable intake (online Supplementary Table S1). Compared with low vegetable intake (<2 serves/d), high vegetable intake (≥3 serves/d) was associated with a 31 % lower odds of slow TUG (P=0·021).
Additional analysis
Including grip strength and TUG to the multivariable-adjusted model attenuated the relationship between total vegetable intake and falls-related hospitalisations (per 75 g serve, HR: 0·93 (95 % CI 0·85, 1·02), P=0·119). The model parameters that were significantly associated with falls-related hospitalisations were age (per year increase, HR: 1·10 (95 % CI 1·07, 1·14)), diabetes (HR: 1·54 (95 % CI 1·11, 2·13)), grip strength (per kg increase HR: 0·97 (95 % CI 0·95, 0·99)) and TUG (per second increase HR: 1·05 (95 % CI 1·03, 1·08)). Adjustment for nutrient-rich foods index in the multivariable-adjusted models attenuated the association between falls-related hospitalisations and total vegetable intake (per 75 g/d serve; HR: 0·92 (95 % CI 0·83, 1·02), P=0·096), but remained similar for cruciferous vegetable intake (per 20 g/d serve; HR: 0·91 (95 % CI 0·84, 0·99), P=0·033). Finally, to limit any possibility of reverse causality, a multivariable-adjusted Cox proportional hazards model excluding individuals who had a falls-related hospitalisation within the first 2 years (n 51) recorded similar results for total vegetable intake and falls-related hospitalisations (per 75 g serve/d, HR: 0·90 (95 % CI 0·82, 1·00), P=0·043).
Fruit consumption
Participant baseline characteristics according to serves of fruit per d are presented in online Supplementary Table S2. Variables including ever smoked, physical activity, energy, protein and Ca intake were greater (P<0·05) in high fruit consumers (≥2 serves/d). Daily fruit intake was 244·5 (sd 3·4) g, which equated to 1·6 (sd 0·9) serves; the median (in descending order) were apples and pears 54·4 (interquartile range (IQR) 22·3–103·7) g, other fruits 49·3 (IQR 22·0–95·4) g, bananas 44·4 (IQR 18·6–72·3) g and oranges 35·0 (IQR 5·1–85·3) g.
Fruit intake, prospective falls-related hospitalisation, surrogate markers of muscle strength and physical function
The Kaplan–Meier survivor function curves for falls-related hospitalisation risk were not different between the different fruit intake categories (P=0·504) (online Supplementary Fig. S3). Similarly fruit intake (per 150 g serve) was not significantly associated to falls-related hospitalisations in both age and multivariable-adjusted models (P>0·05) (Table 2). Different fruit types were also not significantly associated with falls-related hospitalisation (online Supplementary Table S4). Fruit intake (per 150 g serve) was inversely associated with weak grip strength in both the age (P=0·001) and multivariable-adjusted models (P=0·010) (online Supplementary Table S1). High (≥2 serves/d) in comparison with low (<1 serves/d) fruit intake was associated with a 30 % lower odds of weak grip strength (P=0·012) only in the age adjusted model.
Discussion
Identification of falls propensity risk factors in the elderly is a major focus of research given the importance of balance and falling in older women( Reference Deandrea, Bravi and Turati 33 ). Our results identify substantial potential benefits of increased vegetable intake on reduced falls propensity in this population, which appears in part to be a consequence of superior muscular strength (grip strength) and physical function (TUG). This is of particular interest as muscular strength is considered an important contributor in the cycle of frailty( Reference Fried, Tangen and Walston 34 ). Specifically, poor grip strength has previously been associated with a decline in functional capacity( Reference Lauretani, Semba and Bandinelli 35 ), disability( Reference Rantanen, Guralnik and Foley 36 ) and frailty( Reference Syddall, Cooper and Martin 37 ). In addition, TUG is a useful and practical measure of physical mobility for assessing frail elderly persons, which correlates well with more extensive measures of balance, gait speed and functional abilities( Reference Podsiadlo and Richardson 28 , Reference Viccaro, Perera and Studenski 38 ). However, due to the multifactorial nature of falling, the importance of other functional fall propensity risk factors such as poor lower limb strength and/or power, balance, gait speed, cognition and eyesight cannot be understated( Reference Ambrose, Paul and Hausdorff 4 , Reference Perry, Carville and Smith 39 ). Nonetheless, this study provides insight into a nutritional strategy linked to favourable levels of muscular strength and physical function, with the potential to reduce falls-related hospitalisations.
Our data are consistent with previous studies examining muscle function and diet. In older females (mean age=66·6 years) within the Hertfordshire cohort study, higher vegetable consumption was also independently related to greater grip strength( Reference Robinson, Jameson and Batelaan 10 ). A variety of constituents of vegetables may play an important role. Specifically, several vegetable compounds have been positively associated with muscle strength as well as physical and neuromuscular function( Reference Robinson, Jameson and Batelaan 10 , Reference Neville, Young and Gilchrist 11 , Reference Myint, Welch and Bingham 12 , Reference Houston, Stevens and Cai 40 , Reference Cesari, Pahor and Bartali 41 ). Of interest, cruciferous vegetables were most strongly associated with lower falls-related hospitalisations. While the exact pathway through which such benefits might occur is unclear, cruciferous vegetables have been linked to improved insulin resistance( Reference Bahadoran, Tohidi and Nazeri 42 ), with the presence of diabetes presenting as a known risk factor for falls propensity( Reference Lee and Colon-Emeric 43 ) (also demonstrated in our study). Higher dietary intake of carotenoids commonly found in vegetables and fruits may also improve eyesight by reducing age-related macular degeneration risk( Reference Abdel-Aal, Akhtar and Zaheer 44 ). Another potential benefit of cruciferous vegetables as well as other vegetable types and fruits may be associated with their anti-inflammatory effects.
Results from the Health, Ageing and Body Composition Study on 3075 elderly multiracial elderly adults (aged 70–78 years) reported that higher plasma concentrations of IL-6 and TNF-α were associated with both lower muscle mass and strength( Reference Visser, Pahor and Taaffe 45 ). Similarly, the Longitudinal Ageing Study Amsterdam reported increases in both IL-6 and C-reactive protein to be associated with greater declines in muscle strength loss( Reference Schaap, Pluijm and Deeg 46 ). Therefore, it is plausible that diets high in vegetables (especially cruciferous( Reference Shan, Zhao and Geng 47 ), yellow/orange/red( Reference Semba, Lauretani and Ferrucci 48 ) and allium( Reference Arreola, Quintero-Fabián and López-Roa 49 ) vegetables) and fruits through their anti-inflammatory effects have the capacity to minimise muscular strength loss. Our cross-sectional data support this theory, as individuals who consumed higher amounts of vegetables and fruits had approximately 30 % reduction for weak grip strength as compared with low vegetable and fruit intake. Another plausible explanation could be related to reduced metabolic acid load associated with alkaline diets (typically from vegetables and fruits), which favour lean tissue mass preservation in the elderly( Reference Dawson-Hughes, Harris and Ceglia 50 ). Clearly, future work examining the influence of increased vegetable and fruit intake on inflammation, metabolic acid load and its impact on muscular strength and physical function is warranted.
Limitations of the study include its observational nature, increasing the possibility of bias due to residual confounding. Second, there was a lack of a complete suite of physical function measures assessing different domains such as power, gait speed, balance and other associated risk factors such as eye sight. Specifically, impoverished visual input, balance control and obstacle avoidance abilities may be compromised due to misinterpretation of spatial information and poor judgement of distances( Reference Ambrose, Paul and Hausdorff 4 ). Third, despite similar BMI, individuals with high (≥3 serves/d) compared with low (<2 serves/d) vegetable intake reported higher total energy intakes (approximately 23 %) but similar physical activity levels that were relatively low. This highlights potential limitations of capturing physical activity data using questionnaires. Fourth, despite the use of a previously validated and reproducible method of dietary intake assessment, dietary information including habitual intakes of vegetables and fruits were self-reported, which could have led to misclassification of these variables. Fifth, although we adjusted for potential confounders such as dietary and lifestyle factors known to be associated with falls propensity, higher vegetable intakes may be a marker of a healthier lifestyle not completely captured by the lifestyle variables that we included as potential confounders in the multivariable-adjusted analyses. Sixth, adjustment for nutrient-rich foods index attenuated the association between falls-related hospitalisations and total vegetable intake suggesting other food (and their associated nutrients) may play a role in falls-related hospitalisations. Due to the observational nature of our investigation, causal links cannot be established, although the finding that associations remained similar when subjects with falls within the first 2 years were removed reduces the possibility for reverse causality. Finally, results may not be generalised to other populations such as elderly men or younger cohorts.
Strengths of the current study include the prospective design and population-based setting with ascertainment of verified falls-related hospitalisations with almost no loss to follow-up. Study participants were representative of older women within the Australian population, with a mean daily intake of 2·6 and 1·6 serves of vegetables and fruits( 51 ), respectively. Detailed information of potential confounders including diabetes, alcohol intake, SES and physical activity were also considered.
In summary, to our knowledge, this is the first investigation to identify a beneficial influence of vegetable intake on falls-related hospitalisations associated with better strength and physical function in a prospective cohort of elderly women. Finally, the loss of a significant association between vegetable intake and falls-related hospitalisations with the inclusion of muscle function measures in the multivariable-adjusted model indicates an indirect relationship between higher vegetable intake and lower falls-risk via better muscle strength and/or physical function.
Acknowledgements
The authors wish to thank the staff at the Western Australia Data Linkage Branch, Hospital Morbidity Data Collection and Registry of Births, Deaths and Marriages, for their work on providing the data for this study.
The Perth Longitudinal Study of Aging in Women was funded by Healthway, the Western Australian Health Promotion Foundation and by project grants 254627, 303169 and 572604 from the National Health and Medical Research Council (NHMRC) of Australia. The salary of J. M. H. is supported by a NHMRC of Australia Senior Research Fellowship and a Royal Perth Hospital Medical Research Foundation Fellowship. The salary of J. R. L. is supported by a NHMRC of Australia Career Development Fellowship (ID: 1107474). None of these funding agencies had any input into any aspect of the design and management of this study.
M. S., L. C. B., J. M. H., J. R. L., C. P. B. and R. L. P. conceived and designed the study. J. R. L., A. D., K. Z. and R. L. P. collected the data. M. S., J. M. H. and J. R. L. prepared the manuscript; all authors reviewed the manuscript; and M. S. had the primary responsibility for the final content. All authors read and approved the final manuscript.
The authors declare that there are no conflicts of interest.
Supplementary material
For supplementary material/s referred to in this article, please visit https://doi.org/10.1017/S0007114518002155


