


Introduction
A space–time suicide cluster can be defined as multiple suicides that occur closer to each other in time and space than would be expected based on the expectation of the community or statistical chance (Robinson et al., Reference Robinson, Pirkis, O’Connor, O’Connor and Pirkis2016a). One single suicide cluster could have a tremendous impact on the community and lead to serious concerns of imitation, i.e., further occurrences of suicide (Heffel et al., Reference Heffel, Riggs, Ruiz and Ruggles2015; Robinson et al., Reference Robinson, Pirkis, O’Connor, O’Connor and Pirkis2016a, Reference Robinson, Too, Pirkis and Spittal2016b).
Previous studies of clusters of suicidal behaviour have mainly focused on suicide deaths (Benson et al., Reference Benson, Rigby, Brunsdon, Cully, Too and Arensman2022; Haw et al., Reference Haw, Hawton, Niedzwiedz and Platt2013; Niedzwiedz et al., Reference Niedzwiedz, Haw, Hawton and Platt2014; Robinson et al., Reference Robinson, Pirkis, O’Connor, O’Connor and Pirkis2016a), although non-fatal suicidal behaviour may also occur as part of a cluster of suicide deaths, and the incidence of non-fatal suicidal behaviour can be 20-fold higher than that of fatal events (Fazel and Runeson, Reference Fazel and Runeson2020). Not including non-fatal suicidal behaviour in the analysis may lead to many clusters of suicidal behaviour being overlooked.
Two previous studies have investigated clusters of suicidal behaviour by including both suicide deaths and non-fatal suicide attempts. Too et al. (Reference Too, Pirkis, Milner and Spittal2017) analysed the spatio-temporal clusters of (i) hospital admissions for suicide attempt and (ii) suicide deaths separately using data from Western Australia. The study identified a small proportion of suicide attempts (1%) and suicides (0.6%) occurring within clusters, and the clusters of suicide attempts and suicides were geographically close to each other. The same study also found an association of cluster-related suicide attempts with several area characteristics such as low socioeconomic status, the proportion of people who had changed addresses in the previous year, and the proportion of indigenous people. Another study by Too et al. (Reference Too, Pirkis, Milner, Robinson and Spittal2019) focused on young people aged 15–24 years and used data for suicidal acts (suicide attempts and suicides combined) from Western Australia and New South Wales for two periods. The study showed that cluster-related suicidal acts accounted for 0–3% of all events over the periods studied.
The two previous studies used aggregated data for suicide attempt and suicide by the month of occurrence and geographic area, which has an average population size of 10,000–16,000; the analysis used area centroids as a proxy for the person’s place of residence (Too et al., Reference Too, Pirkis, Milner, Robinson and Spittal2019, Reference Too, Pirkis, Milner and Spittal2017). Calculating risks based on artificially defined areas might result in the modifiable areal unit problem, which means that the choice of aggregation area unit might influence the results of statistical tests and cause biases (Openshaw, Reference Openshaw1984). By contrast, a scan statistic model that utilizes the exact location information (i.e., point data), such as Space Time Permutation Scan Statistics (STPSS), is available but was rarely used in past research to detect the clusters of suicidal behaviour, with only two exceptions (Jones et al., Reference Jones, Gunnell, Platt, Scourfield, Lloyd, Huxley, John, Kamran, Wells and Dennis2013; Perez-Costillas et al., Reference Perez-Costillas, Blasco-Fontecilla, Benitez, Comino, Anton, Ramos-Medina, Lopez, Palomo, Madrigal, Alcalde, Perea-Milla, Artieda-Urrutia, de Leon-Martinez and de Diego Otero2015). Moreover, the two Australian studies used hospital admission data for suicide attempt, not including emergency department presentation data, and the residential address information was missing for a significant proportion of suicide attempts and suicides (up to 22–33%) – both could result in potential under-detection of suicidal behaviour clusters.
This study aimed to investigate the space–time cluster of suicidal acts (self-harm, suicides, and both combined) in two cities in Taiwan. Specifically, we examined (i) the prevalence of space–time clusters of different suicidal acts (self-harm, suicide, and self-harm and suicide combined) and (ii) the characteristics of cluster-related suicidal acts compared with those not in clusters. To bridge the gaps in previous literature, this study included emergency room presentations of self-harm and used data with fine-grained spatial information. We used the term ‘self-harm’ when referring to self-injury or self-poisoning, irrespective of the motivation and degree of suicidal intent (Hawton et al., Reference Hawton, Harriss, Hall, Simkin, Bale and Bond2003).
Method
Data
Taipei City (population = 2.6 million in 2004) and New Taipei City (population = 3.9 million in 2012) are both in northern Taiwan (Fig. 1). New Taipei City is the surrounding area of Taipei City, while it is officially a city of its own; both cities are part of the Taipei Metropolitan area. Self-harm and suicide data for Taipei City (2004–2006) and New Taipei City (2012–2016) were from two separate research projects supported by respective city governments.

Figure 1. Location of the study cities: Taipei City (A) and New Taipei City (B) in Taiwan.
Self-harm data for Taipei City were obtained from the city’s self-harm surveillance system. Details of the surveillance system were described elsewhere (Kuo et al., Reference Kuo, Gunnell, Chen, Yip and Chen2012; Kwok et al., Reference Kwok, Yip, Gunnell, Kuo and Chen2014). In brief, all of the 26 hospitals in Taipei City were required to report self-harm presentations to emergency departments by uploading a form with the patients’ basic demographic information, current address and the date and method of self-harm onto the system, so that the aftercare workers can contact the patients and provide aftercare.
Suicides for Taipei City were identified from the national cause-of-death data files using the following International Classification of Diseases, Tenth Revision, (ICD-10) codes: X60-X84 for certified suicides; Y10-Y34 for undetermined deaths; X48 for accidental pesticide poisoning and W75, W76, W83 and W84 for accidental suffocation (Lin et al., Reference Lin, Hsu, Gunnell, Chen and Chang2019). In keeping with findings from other countries (Gunnell et al., Reference Gunnell, Bennewith, Simkin, Cooper, Klineberg, Rodway, Sutton, Steeg, Wells, Hawton and Kapur2013), previous studies from Taiwan (Chang et al., Reference Chang, Sterne, Lu and Gunnell2010) showed that many of these undetermined and accidental deaths were likely to be misclassified suicides and were therefore included in the study. For simplicity, we used the term ‘suicide’ when referring to both certified and possible suicides combined in the paper.
Self-harm and suicide data for New Taipei City were obtained from a project investigating the geographic distribution of self-harm and suicide in the city (Liang, Reference Liang2019) based on data from Taiwan’s National Suicide Surveillance System (NSSS), which included data for self-harm episodes, suicides and suicidal ideation presenting to emergency departments, the police, firefighters, or other governmental agencies (Chen et al., Reference Chen, Liao, Lee, C-Y, Lin and Chen2016; Pan et al., Reference Pan, Chang, Lee, Chen, Liao and Caine2013). Patients’ basic demographic information, contact address, and the date and method of the suicidal acts were uploaded onto the system. Similar to Taipei City, suicide data for New Taipei City were extracted from the national cause-of-death data files to capture suicides not reported to the NSSS as well as possible suicides (Chang et al., Reference Chang, Sterne, Lu and Gunnell2010).
Supplementary Figure S1 shows the flowcharts to identify self-harm episodes and suicides for the study. A total of 5,291 (89% of eligible episodes) and 20,531 (98%) self-harm records and 1,406 (99% of eligible cases) and 2,329 (95%) suicides in Taipei City and New Taipei City, respectively, were included in the analysis. The process to identify eligible self-harm episodes and suicides was described in detail in the Supplementary materials.
The Taiwan Geospatial One Stop (https://www.tgos.tw/tgos/Web/Address/TGOS_Address.aspx) was used to identify the geographic coordinates (latitudes and longitudes) for each suicidal episode based on the residential address. By adopting the coordinates of the exact address (i.e., point data) rather than using the centroid of its administrative district, the cluster identification results would not suffer from aggregation and therefore cluster location accuracy was kept for precise identification. When comparing the area-level characteristics between cluster-related and unrelated episodes of self-harm and suicide, each suicide or self-harm episode was assigned to one of the ‘neighbourhoods’ (an administrative unit; n = 432 in Taiwan City and 1,032 in New Taipei City) based on the geocoded coordinates.
Population data at the neighbourhood level for both cities were extracted from the household registration data. Data for median household income were extracted from the Income Tax Statistics.
Statistical analysis
STPSS (Kulldorff et al., Reference Kulldorff, Heffernan, Hartman, Assunção and Mostashari2005) was used to identify spatio-temporal clusters of self-harm episodes, suicides, and both combined in the two study cities over the respective time periods. The STPSS was adopted as this approach allows the use of point data (i.e., geographic coordinates of address) to identify clusters with more exact location information. STPSS uses a Poisson-based likelihood to identify clustering within a scanning window by assessing whether the number of observed events occurring inside the window is greater than that expected (Kulldorff et al., Reference Kulldorff, Heffernan, Hartman, Assunção and Mostashari2005). The window is a cylinder with different radiuses and heights, which, respectively, indicate the cluster area and duration. The window that has the maximum likelihood ratio between the observed and expected numbers of cases is considered the most likely candidate for a space–time cluster. The temporal information used in the analysis was the day of the suicidal acts, and the spatial information was the geographic coordinates of the addresses. The maximum spatial and temporal size of the cluster was set at 10% of the population at risk and 1 year, respectively, based on previous research (Jones et al., Reference Jones, Gunnell, Platt, Scourfield, Lloyd, Huxley, John, Kamran, Wells and Dennis2013; Milner et al., Reference Milner, Too and Spittal2018; Sugg et al., Reference Sugg, Woolard, Lawrimore, Michael and Runkle2021; Too et al., Reference Too, Pirkis, Milner and Spittal2017). Overlapping of clusters was allowed if less significant clusters did not centre in more likely clusters. The Monte Carlo method with 999 replications was used to generate p-values. Clusters with a p value less than 0.10 were considered as possible clusters in the study. SaTScan version 9.6 was used to conduct the spatio-temporal cluster detection analyses (Kulldorff, Reference Kulldorff2018).
All-age and age-specific analyses were conducted. Consistent with previous research in an Asian population (Yamaoka et al., Reference Yamaoka, Suzuki, Inoue, Ishikawa and Tango2020), six different age groups were considered (10–19, 20–29, 30–39, 40–49, 50–59, and 60 years and above).
We conducted a robustness test to examine the impact of self-harm repetition. We intended to identify space–time clustering of suicidal acts of different individuals rather than repeated episodes by the same individuals. Similar to the approach used by Too et al. (Reference Too, Pirkis, Milner and Spittal2017), a two-stage analysis was conducted. In the first stage, all suicidal acts, including repeated self-harm episodes, were included in the space–time cluster detection analysis. If any detected clusters contained repeated self-harm episodes by the same individuals, one of the episodes was randomly chosen, with the others being excluded, and a cluster detection analysis was re-run to check for evidence of a similar spatio-temporal cluster. The re-run was repeated multiple times according to the maximum number of individual repetitions in the target cluster. A cluster passed the test if a similar cluster covered more than 50% of the space–time period and individuals of the target cluster in any of the re-runs. Final cluster detection results were plotted using ArcGIS 10.7.
The cluster detection analysis revealed some groups of suicides having the same address and date of occurrence. These are likely to be ‘suicide pacts’, i.e., where several people agree to take their lives together at the same time. News reports of suicides were searched and descriptions were compared with these possible suicide pacts regarding sex, age, date of death, and address to determine if these were actually suicide pacts. The etiology of suicide pacts would differ from suicide clusters, and thus they were not included in the analysis of the characteristics of cluster-related vs cluster-unrelated episodes.
Logistic regression analysis was conducted to investigate the characteristics associated with cluster-related episodes of self-harm and suicide. The outcome was a binary variable indicating whether the suicidal episode was in an identified cluster. For individuals with multiple self-harm episodes, we included only one episode for cluster-related cases and one episode for cluster-unrelated episodes, both chosen randomly. We, therefore, excluded a total of 893 self-harm repetition episodes (13.3% of 5,291 self-harm episodes and 1,406 suicides combined) in Taipei City and 5,376 self-harm repetition episodes (23.5% of 20,531 self-harm episodes and 2,329 suicides combined) in New Taipei City from the analysis. Individual-level characteristics included sex and age (10–29 years vs 30+ years), while area-level characteristics include neighbourhood population density and median household income (in terciles). Both unadjusted and sex/age-adjusted odds ratios (ORs) and their 95% confidence intervals (CIs) were estimated. We accounted for within-neighbourhood correlation using generalized estimating equations. The logistic regression analysis was conducted using the geepack package in R software (version 4.0.3).
Results
Table 1 shows the number and rate of self-harm and suicide, as well as the ratio between the number of self-harm episodes (repeated episodes included) and suicide, overall and by sex and age in the two cities over the respective study periods. During 2004–2006, there were a total of 5,291 (male = 1,361; 26%) self-harm episodes and 1,406 (male = 939; 67%) suicides among people aged 10+ years in Taipei City (Table 1a). During 2012–2016, there were a total of 20,531 (male = 6,579; 32%) self-harm episodes and 2,329 (male = 1,465; 63%) suicides among people aged 10+ years in New Taipei City (Table 1b). The annual age-standardized self-harm and suicide rates (per 100,000) were 75.4 and 20.1, respectively, in Taipei City; the corresponding rates were 113.4 and 12.9, respectively, in New Taipei City in the study periods.
Table 1. The number and annual rate (per 100,000) of self-harm episodes and suicides in Taipei City (a) and New Taipei City (b), Taiwan

In both cities, self-harm rates were higher in females than males, while suicide rates were higher in males than females. Self-harm rates were higher in younger groups (highest in 20- to 29-year-olds in Taipei City and 30- to 39-year-olds in New Taipei City); by contrast, suicide rates were highest in the oldest group aged 60+ years. The ratio between self-harm and suicide was highest in the youngest group aged 10–19 and decreased with age.
Cluster detection using space–time permutation scan statistics
Table 2 shows a summary of identified clusters. Two self-harm clusters (Taipei City), four suicide clusters (one in Taipei City and three in New Taipei City) and two self-harm and suicide combined clusters (one in Taipei City and one in New Taipei City) were identified. These identified clusters all passed the robustness test. Additionally, three suicide pacts (one in Taipei City and two in New Taipei City) were also found.
Table 2. Self-harm and suicide space–time clusters in Taipei City (a) and New Taipei City (b), Taiwan
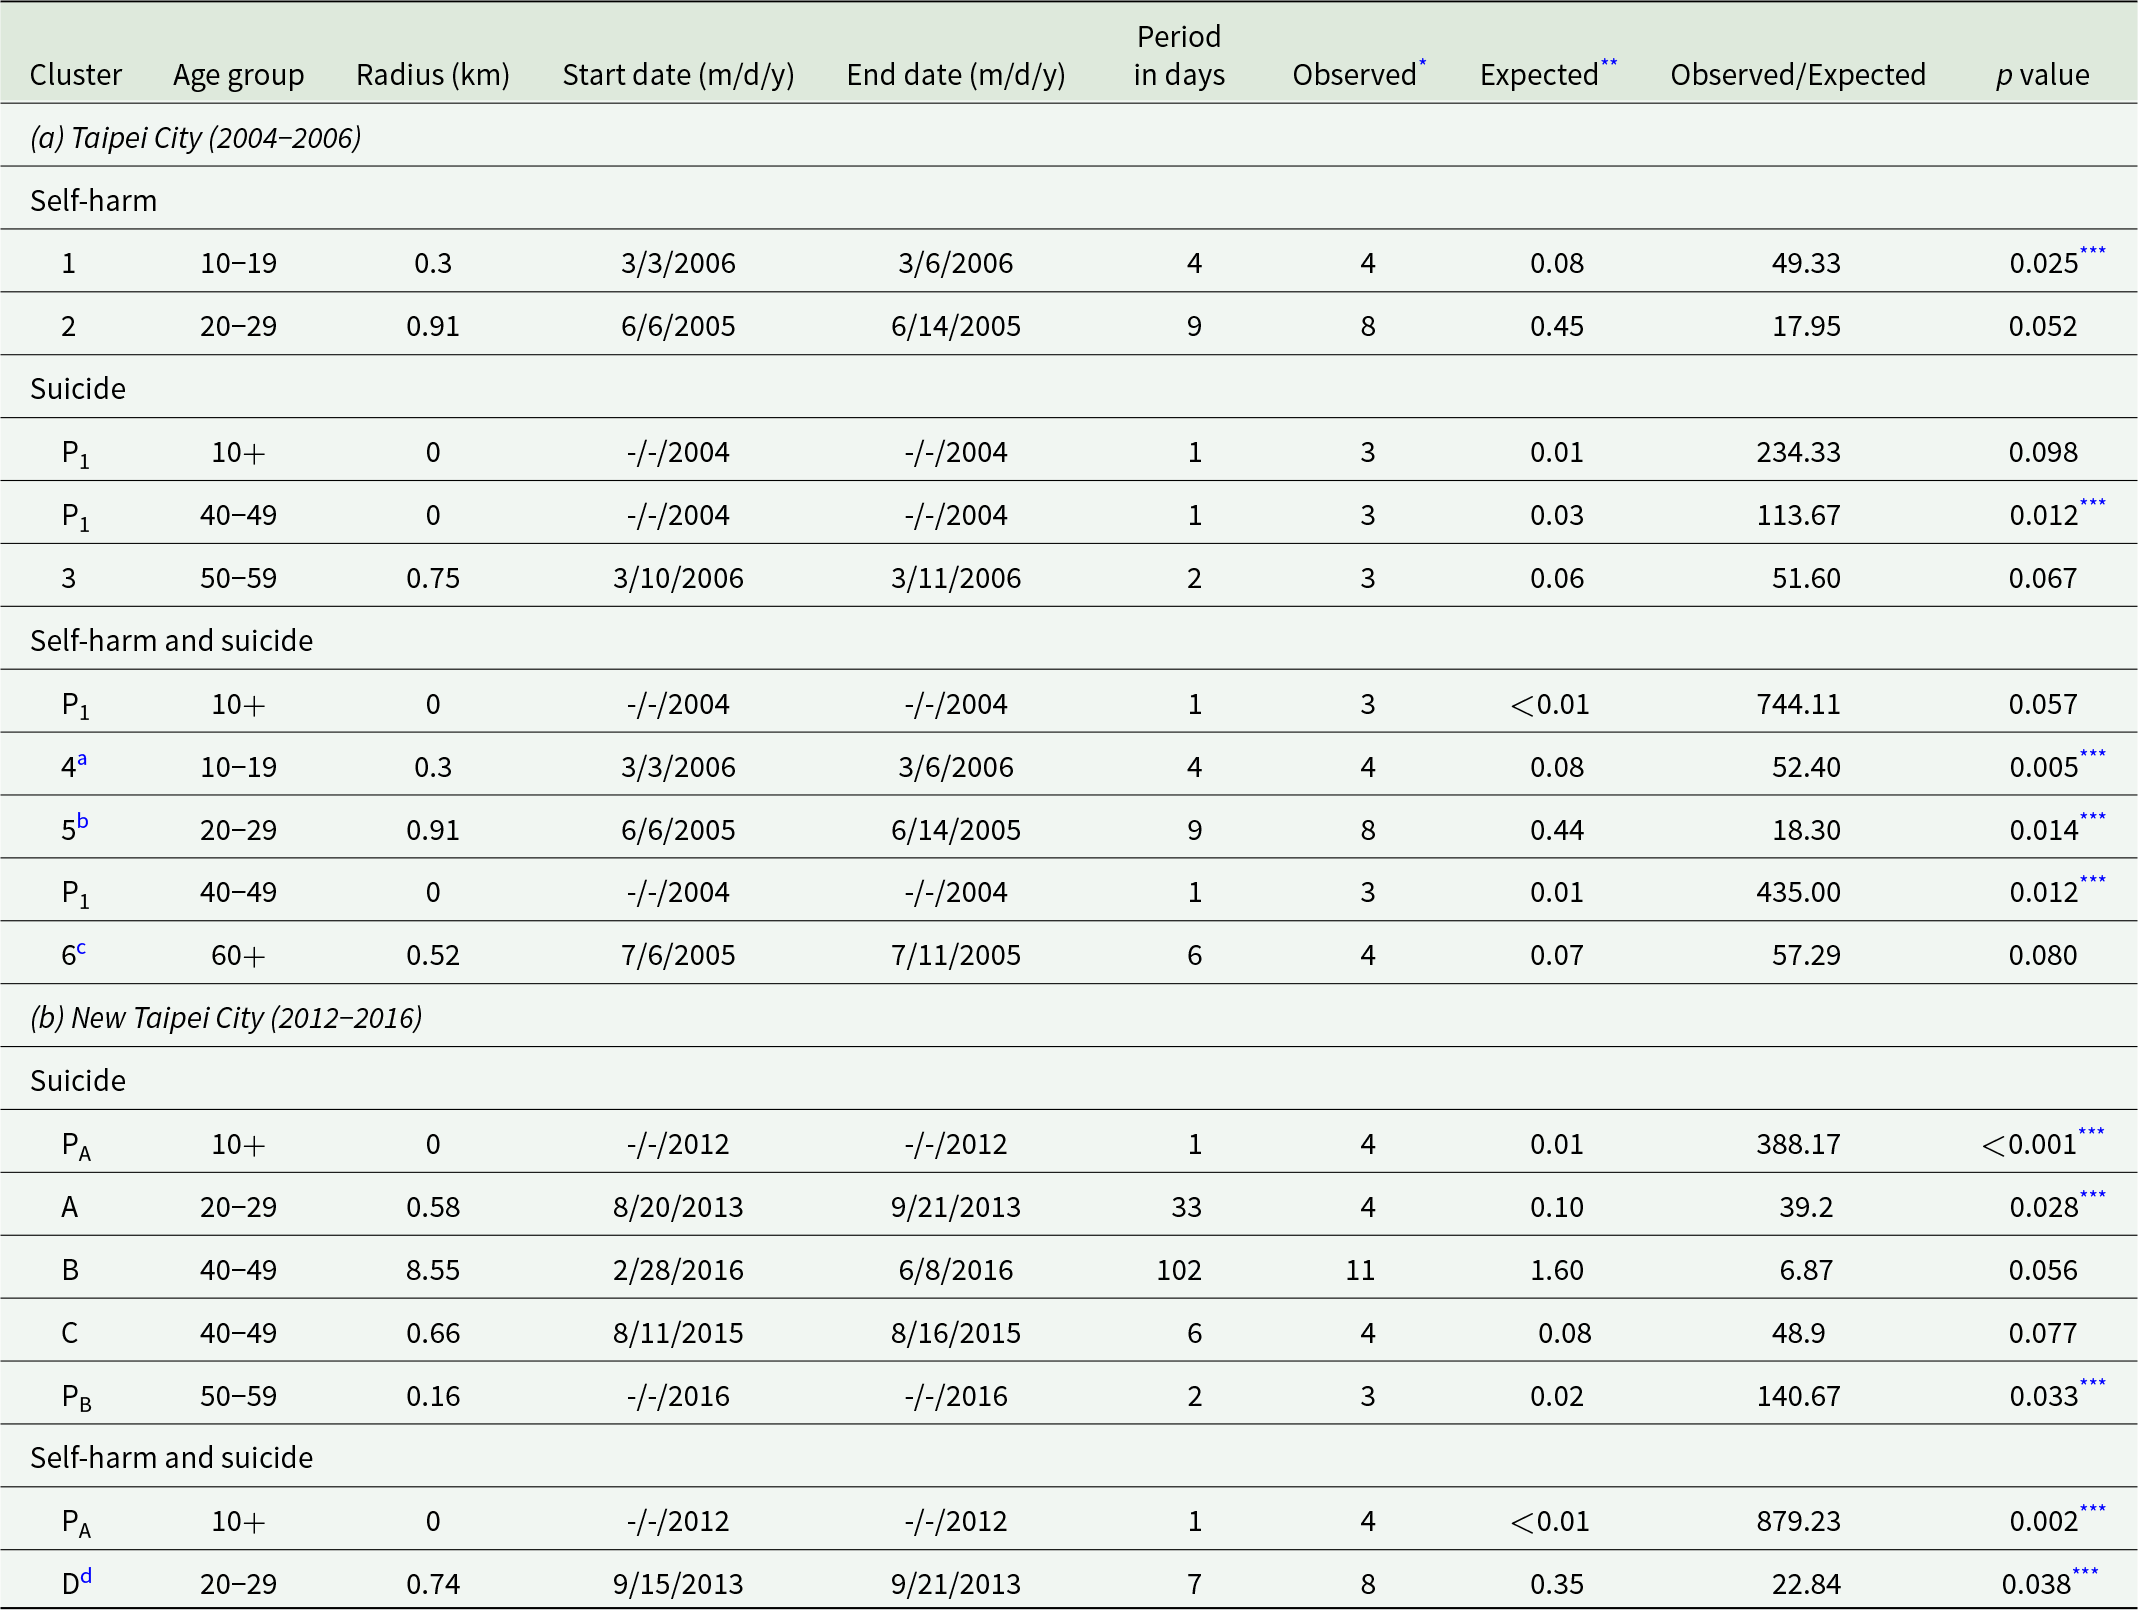
* The number of self-harm episodes or suicides in the cluster detected.
** The number of self-harm episodes or suicides that would have been expected if there was no cluster.
*** Clusters with a p value smaller than 0.05
a This cluster was the same as cluster 1 with four self-harm episodes.
b This cluster was the same as cluster 2 with eight self-harm episodes.
c This cluster was a combined cluster with two self-harm episodes and two suicides.
d This cluster included five self-harm episodes and three suicide deaths; the three suicide deaths were also included in cluster A, which contained four suicide deaths.
P1 was a suicide pact of three family members, with two by hanging and one by self-poisoning. The exact start and end dates of the suicide pact were removed to prevent individuals from being identified. The suicide pact was identified in the all-age (aged 10+ years) and age-specific (aged 40-49 years) analyses of suicides as well as suicides and self-harm episodes combined.
PA was a suicide pact consisting of four family members who died by charcoal burning in a car. The exact start and end dates of the suicide pact were removed to prevent individuals from being identified. The suicide pact was identified in the all-age (aged 10+ years) analyses of suicides as well as suicides and self-harm episodes combined.
PB included three suicides; of them, two individuals died by charcoal burning in a car (i.e., a suicide pact). The exact start and end dates of the suicide pact were removed to prevent individuals from being identified.
In Taipei City (Table 2a), the two self-harm clusters were identified in the age groups 10–19 (cluster 1, four events, p = 0.025; 1.08% of all self-harm events in this age group) and 20–29 years (cluster 2, eight events, p = 0.052; 0.46% of all self-harm events in this age group). The suicide cluster was identified in the age group 50–59 years (cluster 3, three events, p = 0.067; 1.16% of all suicides in this age group). Three clusters were identified when the self-harm and suicide data were combined; of them, two (clusters 4 and 5) were the same as clusters 1 and 2, respectively. The additional cluster was identified in the age group 60+ years (cluster 6, two self-harm episodes and two suicides, p = 0.080; 0.50% of all self-harm and suicide events in this age group).
In New Taipei City (Table 2b), no self-harm clusters were identified. Three suicide clusters were identified in the age groups 20–29 (cluster A, four events, p = 0.028; 1.6% of all suicides in this age group), 40–49 (cluster B, 11 events, p = 0.056; 2.2% of all suicides in this age group) and 40–49 years (cluster C, four events, p = 0.077; 0.8% of all suicides in this age group). One cluster containing five self-harm events and three suicides was identified in the age group 20–29 (cluster D, p = 0.038; 0.2% of all self-harm and suicide events in this age group); this cluster contained three of the suicides in suicide cluster A.
The clusters in both cities mostly occurred over a short time period (2–33 days) with a radius of less than 1 km, with only one exception spanning 102 days with a radius of 8.55 km in New Taipei City (Table 2). The number of events included in each cluster accounted for only a small percentage of all suicidal acts. Overall, self-harm events, suicides, and self-harm and suicides combined in the identified clusters (excluding suicide pacts) accounted for only 0.05% (12/25,822), 0.59% (22/3,735), and 0.08% (24/29,557) of the total number of events in the three groups, respectively.
Figure 2 shows the geographical distribution of the identified clusters. In Taipei City, the identified clusters were located in the west and southwest areas. In New Taipei City, clusters A (suicide only) and D (self-harm and suicide combined) were close to each other geographically.

Suicide pacts
A total of three suicide pacts were identified in the cluster detection analysis. One suicide pact (suicide pact P1, with three suicides) was identified in Taipei City (Table 2a). A search of news reports revealed that the suicide pact included three family members (two brothers and one sister aged between 43 and 49 years) who died by hanging (n = 2) and self-poisoning (n = 1), respectively, in the same address. The pact was consistently identified in the all-age (i.e., aged 10+ years) and age-specific (i.e., aged 40-49 years) analyses of suicides as well as suicides and self-harm episodes combined. Two suicide pacts (suicide pact PA, with four suicides, and suicide pact PB, with three suicides) were identified in New Taipei City (Table 2b). A search of news reports revealed that suicide pact PA consisted of four family members (three adults and one adolescent) who died from carbon monoxide poisoning by burning barbecue charcoal in a car. The three suicides in suicide pact PB included one couple (n = 2) who died together by burning charcoal in a car, i.e., a suicide pact, while the third suicide was unrelated to the couple and occurred on the next day. A sensitivity analysis that counted the couple as one single suicide event showed no more statistical evidence of this suicide cluster.
Characteristics of cluster-related vs unrelated self-harms episodes and suicides
Based on combined data from Taipei City and New Taipei City, people who self-harmed or died by suicide as part of a cluster (n = 19 in Taipei City and n = 24 in New Taipei City, excluding suicide pacts) were more likely to be male (vs female) and younger (aged 10–29 vs 30+years) than their cluster-unrelated counterparts (Table 3). Sex/age-adjusted ORs were 2.22 (95% CI 1.26, 3.89) for males (reference group: females) and 2.72 (95% CI 1.43, 5.21) for 10- to 29-year-olds (reference group: individuals aged 30+ years). No association was found between cluster-related self-harm episodes and suicides and neighbourhood median household income or population density.
Table 3. Comparison of individual- and area-level characteristics between cluster-related and unrelated self-harm episodes and suicides in Taipei City and New Taipei City, Taiwan
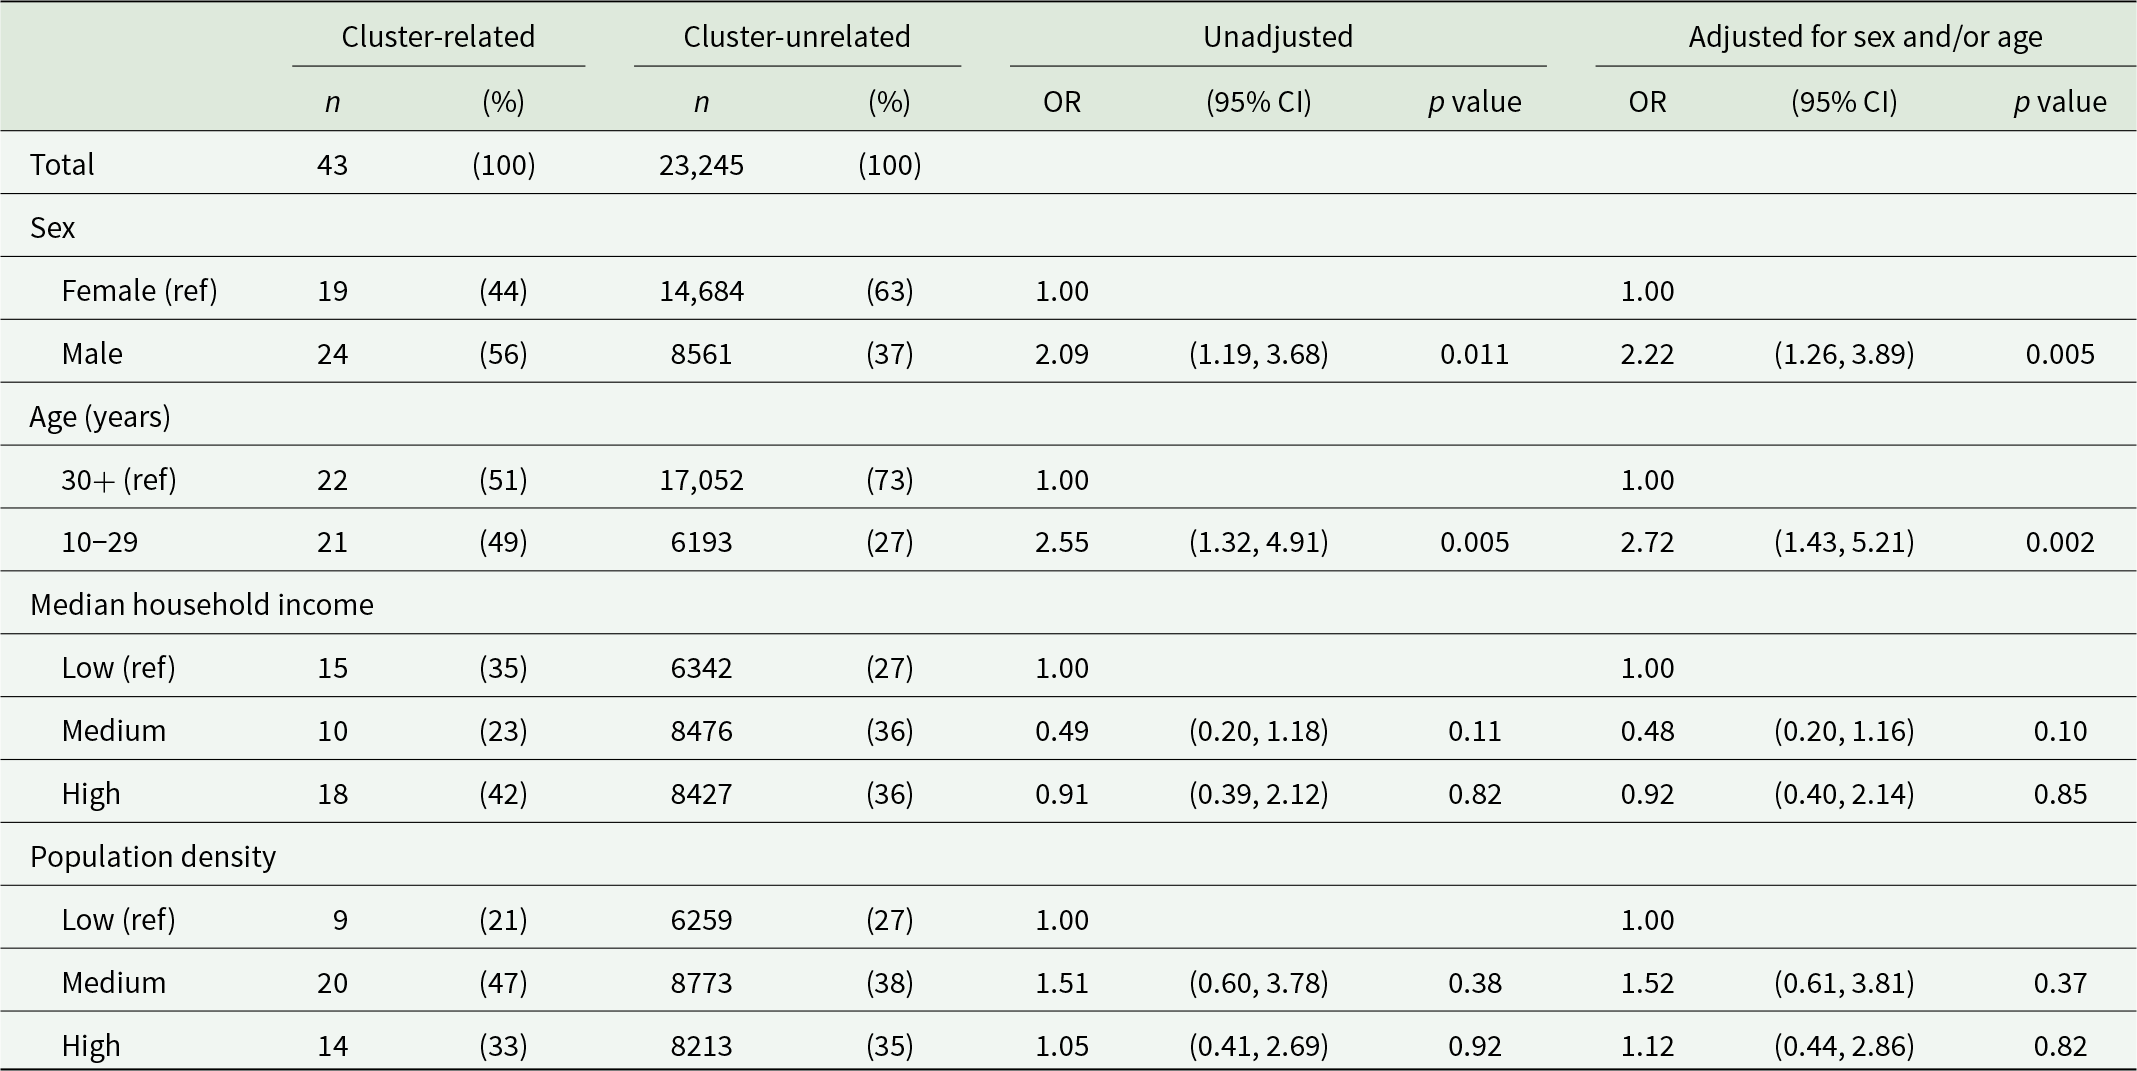
OR = odds ratio; CI = confidence interval.
Discussion
Space–time clusters of suicidal acts were relatively rare; self-harm, suicide, and self-harm and suicide combined accounted for 0.05%, 0.59%, and 0.08% of the respective groups of suicidal acts. The analyses using combined data for non-fatal events (self-harm episodes) and fatal events (suicides) identified additional clusters compared with analyses based on self-harm or suicide data alone. People who self-harmed or died by suicide as part of a cluster were more likely to be male and younger than cluster-unrelated cases.
Strengths and limitations
This is the first study to identify space–time clusters of self-harm, suicide, and self-harm and suicide combined using fine-grained event date and residential address information. The availability of point data could achieve high geographical accuracy by allowing cluster identification using the space–time permutation model, which is more specific than the discrete Poisson model based on aggregate area data used in previous studies. The data used in our analysis were comprehensive; around 90% or more of the eligible episodes had complete residential address information and were included in the analysis.
There are limitations to this study. First, we only considered the proximity of space (based on residence) and time (based on the date of self-harm or suicide) between individuals and could not analyse social network connections (Hawton et al., Reference Hawton, Hill, Gould, John, Lascelles and Robinson2020). Recent studies used data from the police and coroner reports to investigate the social links between cluster-related suicides (Hill et al., Reference Hill, Spittal, Pirkis, Torok and Robinson2020a, Reference Hill, Too, Spittal and Robinson2020b) or interviews with people who self-harmed to investigate the link between self-harm in these individuals and previous cluster-related suicides (John et al., Reference John, Marchant, Hawton, Gunnell, Cleobury, Thomson, Spencer, Dennis, Lloyd and Scourfield2022). Second, our analysis comparing cluster-related and unrelated cases did not include information on other risk factors of suicidal behaviour such as drug or alcohol abuse and history of self-harm, which may contribute to the clustering of suicidal behaviour (Haw et al., Reference Haw, Hawton, Niedzwiedz and Platt2013). Third, the analysis of cluster characteristics had limited statistical power due to the small number of cluster-related self-harm episodes and suicides being identified. Fourth, the data covered two distinct periods in Taipei City and New Taipei City because of data availability. Furthermore, Taipei City had a lower ratio of self-harm episodes to suicides than New Taipei City; this may indicate that self-harm episodes could be under-detected in Taipei City, and this could impact cluster detection. Lastly, the space–time permutation model did not adjust for population number. If there was a large change in the population number within a short period of time in an area, in contrast to constant population in other areas, this might lead to false negative or positive results of cluster detection (Kulldorff, Reference Kulldorff2018). However, in our analysis, we set the maximum temporal size of the cluster at 1 year, and this would limit the impact of change in the population number over time, if any. Furthermore, our data showed relatively stable neighbourhood population numbers during the study period. There was no evidence of a large change in population number in neighbourhoods where the suicidal behaviour clusters were identified (see Supplementary materials for more details).
Comparison with previous studies
Our results showed that the spatio-temporal clusters of self-harm and suicide were fairly uncommon. Previous studies from Australia and the UK applying the scan statistics method also indicated the rarity of the phenomena – spatio-temporally cluster-related suicidal acts accounted for only 0–3% of total self-harm events and/or suicides (Cheung et al., Reference Cheung, Spittal, Williamson, Tung and Pirkis2013; Hill et al., Reference Hill, Too, Spittal and Robinson2020b; Jones et al., Reference Jones, Gunnell, Platt, Scourfield, Lloyd, Huxley, John, Kamran, Wells and Dennis2013; Milner et al., Reference Milner, Too and Spittal2018; Too et al., Reference Too, Pirkis, Milner, Robinson and Spittal2019, Reference Too, Pirkis, Milner and Spittal2017; Too and Spittal, Reference Too and Spittal2020). A few studies showed a higher proportion of suicides occurring in clusters. For example, Sy et al. (Reference Sy, Shaman, Kandula, Pei, Gould and Keyes2019) found that 13.5% of suicides in 10 US states with the highest suicide rates were in clusters. However, the finding may be associated with the study’s relatively large time scale of aggregation (6 months) when the scan statistics method was applied. In other words, the study identified clusters of suicides that were already grouped (i.e., aggregated) every 6 months, and this may lead to an inflated number of suicides being identified in clusters. By contrast, the time scale of aggregation was 1 day for our study and the UK study (Jones et al., Reference Jones, Gunnell, Platt, Scourfield, Lloyd, Huxley, John, Kamran, Wells and Dennis2013) and 1 month for Australian studies (Cheung et al., Reference Cheung, Spittal, Williamson, Tung and Pirkis2013; Hill et al., Reference Hill, Too, Spittal and Robinson2020b; Milner et al., Reference Milner, Too and Spittal2018; Too et al., Reference Too, Pirkis, Milner, Robinson and Spittal2019, Reference Too, Pirkis, Milner and Spittal2017; Too and Spittal, Reference Too and Spittal2020). Another study from Spain indicated that 17.7% of suicides occurred in clusters (Perez-Costillas et al., Reference Perez-Costillas, Blasco-Fontecilla, Benitez, Comino, Anton, Ramos-Medina, Lopez, Palomo, Madrigal, Alcalde, Perea-Milla, Artieda-Urrutia, de Leon-Martinez and de Diego Otero2015); however, the study was based on a small sample (n = 96) from a defined rural area, making it difficult to compare its result to those of other much larger studies. In a recent study from Hong Kong, 19.2% of self-harm occurred in clusters (Leung et al., Reference Leung, Chow, Ip and Yip2018); however, this study used data from a highly densely populated area with many high-rise public housing buildings, which may contribute to the space–time concentration of self-harm episodes that occurred in residents who lived in different floors and had no contacts with one another.
In keeping with previous studies, our findings indicated that cluster-related suicidal acts were most likely to occur in males and younger people (Haw et al., Reference Haw, Hawton, Niedzwiedz and Platt2013; Hawton et al., Reference Hawton, Hill, Gould, John, Lascelles and Robinson2020). In a study from Wales, UK, suicide clusters were only identified in the subgroup of individuals aged 15–34 years but not in the all-age analysis (Jones et al., Reference Jones, Gunnell, Platt, Scourfield, Lloyd, Huxley, John, Kamran, Wells and Dennis2013). The predominance of clustering of suicide in young people may reflect their greater susceptibility to identification with a model, which could be suicide by other young people or suicide by celebrities (Hawton et al., Reference Hawton, Hill, Gould, John, Lascelles and Robinson2020). Furthermore, we identified suicidal behaviour clusters in only age-specific analyses but not all-age analyses. The clustering of suicidal behaviour may be more likely to occur among people of a similar age rather than across age groups, as vulnerable individuals were more likely to identify with and be influenced by suicidal behaviour by people of the same age (Haw et al., Reference Haw, Hawton, Niedzwiedz and Platt2013). In a recent study of suicide clusters in young people in Australia, Hill et al. (Reference Hill, Spittal, Pirkis, Torok and Robinson2020a) found that 86% of suicides exposed to suicides of young people (aged 10–18 years; the index cases) belonged to the same age group as the index case. However, past research on sex and age patterns mainly focused on suicide clusters. Too et al. (Reference Too, Pirkis, Milner and Spittal2017) recently examined the characteristics of self-harm only clusters and did not find increased risk in any specific sex or age groups. Future research is needed to determine whether the sex and age patterns differ in self-harm and suicide clusters.
Implications
Considering self-harm episodes and suicides together may identify more possible clusters of suicidal behaviour. Adopting advanced methodology such as the space–time permutation model and using data with fine-grained geographic information may allow identifying spatially exact clusters. Further research on the age and sex patterns of suicidal behaviour clusters and the transmission of suicidal behaviour within clusters can inform prevention and intervention plans.
Supplementary material
The supplementary material for this article can be found at https://doi.org/10.1017/S2045796023000513.
Availability of data and materials
The data were provided by the governments of Taipei City and New Taipei City, Taiwan. The authors were not permitted to share the data.
Acknowledgements
The authors thank the Department of Public Health, New Taipei City Government, and Department of Health, Taipei City Government for their support in providing the data used in the analysis. The views expressed in the paper are those of the authors and not necessarily those of the National Science and Technology Council, New Taipei City Government, or Taipei City Government.
Author contributions
F.-W.L. and E.C. contributed equally to this work as first authors. Literature review was performed by F.-W.L., E.C., and S.-S.C. Study design was by F.-W.L., E.C. and S.-S.C. Data preparation was by F.-W.L., E.C., Y.-L.L., and S.-S.C. Data analysis was done by F.-W.L., E.C., and Y.-L.L. Data interpretation was by F.-W.L., E.C., Y.-L.L., Y.-Y.C., D.G. and S.-S.C. F.-W.L., E.C., and S.-S.C. wrote the first draft of the manuscript. F.-W.L., E.C., Y.-L.L., Y.-Y.C., D.G., and S.-S.C approved the final article.
Financial support
The study was funded by Taiwan National Science and Technology Council (grant number MOST 105-2628-B-002-039-MY4); National Taiwan University (grant number NTU-CDP-105R7726, NTUCDP-106R7726, NTU-CDP-107L7721, NTU-CDP-108 L7708 and NTU-CDP-109L7702); and Department of Public Health, New Taipei City (grant number 107M316). D.G. is supported by the NIHR Biomedical Research Centre at University Hospitals Bristol and Weston NHS Foundation Trust and the University of Bristol, England.
Competing interests
We declare no competing interests.
Ethical standards
This study was approved by the National Taiwan University Hospital Research Ethics Review Committee (201512030RINC and 201805127RINB). The authors assert that all procedures contributing to this work comply with the ethical standards of the relevant national and institutional committees on human experimentation and with the Helsinki Declaration of 1975, as revised in 2008.


 Open access