With 16·1 million undernourished people in Tanzania(1), the reduction of food insecurity is a major goal for intervention programmes. Food security is defined as a state in which ‘all people at all times have both physical and economic access to sufficient food to meet their dietary needs for a productive and healthy life’(2). The measurement of food insecurity at the national level refers to a nation’s ability to meet the nutritional needs of its population and is often measured by agricultural production data divided by per capita food consumption or dietary energy requirements. However, national food availability is unevenly distributed and although food stocks may be sufficient to meet the population’s energy requirements, access to food is often not equal for all people(Reference Coates, Frongillo, Rogers, Webb, Wilde and Houser3, Reference Habicht, Pelto, Frongillo and Rose4).
Access to food means that ‘individuals have adequate incomes or other resources to purchase or obtain levels of appropriate foods needed to maintain consumption of an adequate diet/nutrition level and are able to obtain these foods in socially acceptable ways’(2). The measurement of food insecurity at the household level aims to measure this access component and is based on the idea that the experience of food insecurity causes predictable reactions and responses that can be captured and quantified through a survey and summarized on a scale.
In developing a tool to measure household food insecurity across countries and cultures, researchers have most often either adapted a version of the Cornell/Radimer measuring tool, which was initially developed for use in the USA, or developed a tool based on research on how households experience food insecurity in various countries and geographical areas(Reference Frongillo and Nanama5). Both methods have produced valid or accurate measurements(Reference Frongillo, Chowdhury, Ekstrom and Naved6–Reference Lorenzana and Sanjur8). Food insecurity measurements have sometimes relied in part on an index of coping strategies(Reference Wolfe and Frongillo9), such as borrowing money or foraging for food, to deal with a lack of access to food. However, Coates et al.(Reference Coates, Swindale and Bilinsky10) recommend that strategies to supplement household income and resources be excluded from measurement tools because ‘(1) these strategies have been found to represent a different aspect of food insecurity and do not always fit statistically with other questions in the scale in measuring the same concept; (2) some strategies to supplement household income and resources are not always accessible to all households; and (3) these strategies vary widely across cultures and countries, making it difficult to identify a universally relevant set of resource supplementation questions’.
The US Agency for International Development (USAID)-funded Food and Nutrition Technical Assistance (FANTA) Project has developed the Household Food Insecurity Access Scale (HFIAS), a household food insecurity measurement instrument designed to be used cross-culturally(Reference Coates, Swindale and Bilinsky10). The scale is based on a household’s experience of problems regarding access to food and represents three aspects or domains of food insecurity found to be universal across cultures(Reference Coates, Frongillo, Rogers, Webb, Wilde and Houser3, Reference Frongillo, Chowdhury, Ekstrom and Naved6, Reference Coates, Swindale and Bilinsky10–Reference Radimer, Olson and Campbell14). The domains represented in this scale are: (i) feelings of uncertainty or anxiety about the household food supplies; (ii) perceptions that household food is of insufficient quality (including variety and food type preference); and (iii) insufficient food intake and its physical consequences. The purpose of the present study was twofold: first, to test the validity and reliability of this instrument to measure household food insecurity in rural Tanzania; and, second, to determine the socio-economic characteristics associated with household food insecurity in the sample households. By investigating the household socio-economic characteristics associated with food insecurity status, it becomes possible to target intervention programmes to the households most vulnerable to food insecurity.
Methods
Study area
The study took place in six villages near Ruaha National Park in the Iringa Rural District, located in the Iringa Region in central Tanzania. The villages are Nyamahana (356 households), Malinzanga (715 households) and Mafuluto (320 households) of the Mlowa Ward, and Luganga (318 households), Magozi (179 households) and Ilolo Mpya (171 households) of the Ilolompya Ward. One main dirt road connects the villages with Iringa town, the administrative capital and marketing centre of Iringa Region, approximately 50 km away. Numerous agricultural and agro-pastoral ethnic tribes live in the area. The numerically dominant tribes are the Wahehe, Wabena, Masaai and Wagogo. Approximately 90 % of the people in the Iringa Rural District are employed in small-scale agriculture(15, Reference Mkai, Mbogoro, Rajab and Mohammed16), with the majority of these being subsistence farmers. Pastoralist tribes have settled on the outskirts of villages to lead an agro-pastoral lifestyle by concurrently farming and raising herds of livestock. Herein, agro-pastoral tribes are referred to as pastoral tribes or pastoralists.
Food stores are high following maize harvests in June but often become depleted from December to March, before maize begins to ripen. The months before harvest, called the ‘hungry’ or ‘lean’ season, are often the time period when people experience hunger and/or food insecurity. The hungry season is often associated with reductions in food availability(Reference Wandel and Holmboe-Ottesen17) and energy intake(Reference Brown, Black and Becker18), decreased nutritional status(Reference Sellen19), increased energy expenditure(Reference Kinabo, Kamukama and Bukuku20), increased infectious diseases(Reference Tomkins21) and child mortality(Reference Pelletier22).
The villages included in the study were selected by their participation in a larger chicken vaccination project impact assessment. Three villages – Nyamahana, Malinzanga and Mafuluto – were chosen by the Wildlife Conservation Society, Iringa (WCS), a non-government organization, to receive chicken vaccinations on the basis of village government support and cooperation. The remaining three villages – Luganga, Magozi and Ilolo Mpya – were chosen by the primary author based on similarities (socio-economic, location and infrastructure) to the first three villages.
Participants and data collection
All study procedures were approved by the Human Subjects Institutional Review Board of the University of California at Davis and Sokoine University of Agriculture in Morogoro, Tanzania. The subjects gave verbal consent and received a small gift for their participation in the approximately hour-long interview. The study used two complementary data collection approaches: key informant interviews and a cross-sectional survey. Participants of the key informant interviews were purposively recruited. Selection was aimed at locating male and female informants with varied backgrounds (socio-economic and education) who were knowledgeable about the community and child and mother food consumption practices and beliefs. Data were collected by the principal author and a staff member from the WCS in February and March 2008, through open-ended interviews, conducted in Swahili, with twenty-one key informants. All interviews were recorded through written notes and tape recording (with the participants’ permission). The tape recordings of the interviews were transcribed and translated into English. Information obtained from key informants was used to make adaptations to the household data collection instrument, so that it was appropriate for the target population.
For the household interviews, a sample of 237 households with mothers and at least one child between 1 and 5 years of age were included in the study. Households were eligible for inclusion if they met the following criteria: (i) the household was located in the selected villages and owned chickens at the time of the study or the month prior to the study; (ii) the female caregiver was present and willing to be interviewed; and (iii) a child between 1 and 5 years of age was present in the household. If the family had more than one child within the required age group, the youngest child within our age range was selected. Over forty households from each village were randomly selected from a register of village households using a table of random numbers. Of the 274 households asked to participate, four declined to participate, and of the 270 households interviewed, thirty-three households were excluded from the study due to not meeting eligibility criteria. Eight trained local research assistants collected the data in March 2008 through personal interviews with the mother, or primary caregiver, of a household at her home. The interview consisted of a structured questionnaire containing questions on household socio-economic characteristics, frequency of animal-source food (ASF) consumption for the mother and child, and food insecurity.
Wealth measures
To measure household wealth, we recorded the type and number of assets that a household owned. Measures of wealth included livestock and material assets, such as the number of goats, cows, sheep and pigs; acres of land; ownership of kiosks, radios, beds, bicycles, sewing machines and cell phones; and whether or not the household lived in a brick house or had a metal roof. For each asset, a household was given a score of 1 (low wealth), 2 (medium wealth) or 3 (high wealth), based on information from key informants. For example (see Table 1), key informants stated that a household of low wealth would own no cows, a household of medium wealth would own one to ten cows and a household of high wealth would own more than ten cows. A household wealth score was produced by summing the scores for both livestock and material assets. A livestock wealth score was produced by summing only the livestock asset scores.
Table 1 Key informants’ categorization of households into low, medium and high wealth based on the number of assets: rural Iringa, Tanzania, February/March 2008

Animal-source food consumption
To measure ASF consumption, a ten-item FFQ was used. The food items included were beef, fish, chicken, milk, pork, eggs, goat/lamb, wild game, other poultry and sardines. Mothers were asked how often they consumed each item of food (0 = don’t eat; 1 = less than once per month; 2 = once per month; 3 = once per week; 4 = a few times per week; 5 = almost every day). Then, mothers were asked the same questions regarding their youngest child between 1 and 5 years old. Mothers and children were each given an ASF frequency score by summing the data.
Food insecurity measures
A nine-item food insecurity scale, the HFIAS, developed by USAID’s FANTA Project(Reference Coates, Swindale and Bilinsky10), was used to measure household food insecurity. The measurement instrument follows a progression that begins with anxiety about food supply, followed by a decrease in the quality of food, a decrease in the quantity of food, and finally going to sleep hungry and going all day and night without eating.
The nine items of the scale were reviewed with three sets of key informants in order to adapt the phrases and definitions to the local context and to assure that questions were understood appropriately. First, the principal author used the Key Informant Interview Guide(Reference Coates, Swindale and Bilinsky10) to informally consult with four staff members of the WCS, who gave suggestions on using context-specific words, defined terms, and gave examples for some of the questions. Second, the defined terms were reviewed with the twenty-one key informants in the villages. Third, the interviewers, who were from the local area, were questioned about the scale using probes from the Key Informant Interview Guide. The wording of the translated scale was found to be relevant to the local context; only slight changes were made and definitions of key terms were provided. According to key informants, definition of ‘household’ includes those who eat together and sleep in the same house. ‘Lack of resources’ meant not having the means to get food, either through purchasing it or growing it. Examples of ‘preferred foods’ were meat, particularly from goats, chicken and fish; examples of ‘a limited variety of foods’ were ugali (stiff maize flour porridge) and beans; and examples of ‘a food you did not want to eat’ were porridge without sugar and baobab tree fruit. Three meals per day were considered the norm. During the household interviews, mothers were asked whether or not they or other members in their household experienced any of the nine items in the past month. If they experienced the item, they were asked whether they experienced it rarely (once or twice in the past month), sometimes (three to ten times in the past month) or often (more than ten times in the past month). Responses were scored so that ‘never’ received a score of 0, ‘rarely’ scored 1, ‘sometimes’ scored 2 and ‘often’ scored 3, so that when summed, the lowest possible score was 0 and the highest 27. A higher score represented greater food insecurity. The continuous scores were also divided into four categories, representing food-secure and mildly, moderately and severely food-insecure households according to the categorization scheme recommended by the HFIAS Indicator Guide(Reference Coates, Swindale and Bilinsky10).
Statistical analysis
Data were entered and sorted using Microsoft® Excel 2003 (Microsoft Corp., Redmond, WA, USA) and all data were rechecked for accuracy to minimize entry errors. Frequency distribution of all HFIAS food insecurity items was done for descriptive purposes. Construct validity was assessed using rotated principal component factor analysis with a varimax rotation. Factors with an eigenvalue of approximately one or more were retained. Subscales were developed using items that consistently grouped together and had factor loading with an absolute value of 0·5 or more. These items were considered to reflect the same construct. Internal consistency of the scale was assessed using Cronbach’s α. A scale with a coefficient of 0·7 or higher was considered reliable. Convergent validity was assessed using the t test and Pearson’s correlation to compare socio-economic characteristics, including household wealth, and ASF frequency scores across the HFIAS food insecurity scores. Multivariate regression analysis was used to examine the independent effect of individual socio-economic characteristics while holding all other characteristics constant. Multivariate analyses included a village variable, which referred to the unmeasured variation among the villages. Statistical analyses were carried out using the SAS for Windows statistical software package version 9·1 (SAS Institute, Cary, NC, USA), and results were considered statistically significant at the 0·05 level.
Results
Sample characteristics
Selected characteristics of the 237 households included in the study are shown in Table 2.
Table 2 Characteristics of the sample households (n 237): rural Iringa, Tanzania, March 2008

ASF, animal-source food.
†Values presented are % and n.
‡Household wealth score (range 0–37) is based on material and livestock assets; a high score represents high wealth.
§Household livestock wealth score (range 0–12) is based on livestock assets; a high score represents ownership of many livestock.
||ASF frequency score (range 0–50) is based of the consumption of ASF; a high score represents more frequent consumption of ASF.
Responses to items on the Household Food Insecurity Access Scale
Responses to the HFIAS items were generally consistent with expectations. More respondents reported affirmatively to the items indicating less severe food insecurity, such as not being able to eat the kinds of food they preferred, than to items indicating more severe food insecurity, such as going a whole day and night without eating. Affirmative responses (i.e. ‘rarely’, ‘sometimes’ and ‘often’) to the nine items ranged from 26·2 % to 67·9 % (Table 3). The item most frequently receiving an affirmative response was question 3, ‘Did you or any household member have to eat a limited variety of foods?’ As expected, the item receiving the least amount of affirmative responses was question 9, ‘Did you or any household member go a whole day and night without eating anything?’
Table 3 Distribution of affirmative responses to items on the Household Food Insecurity Access Scale (HFIAS) and rotated factor loadings of the items: households (n 237) in rural Iringa, Tanzania, March 2008
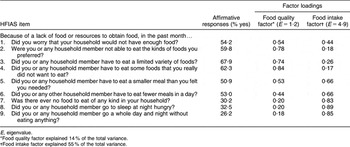
E, eigenvalue.
*Food quality factor explained 14 % of the total variance.
†Food intake factor explained 55 % of the total variance.
Construct validity
Two main constructs (factors) emerged from the rotated principal component factor analysis of the nine HFIAS items: (i) insufficient food quality; and (ii) insufficient food intake (Table 3). Items 1 to 4 loaded onto the food quality factor, with loadings ranging from 0·54 to 0·84. Items 5 to 9 loaded onto the food intake factor, with loadings ranging from 0·66 to 0·89. Although item 1 did not load onto the food quality factor as strongly as items 2 to 4, it was above the cut-off of 0·5 and included in the food quality factor. Item 5 was above the 0·5 cut-off for both factors, but was included in the food intake factor because it was more strongly related to that factor. The food quality factor explained 14 % of the total variance, while the food intake factor explained 55 %.
Internal consistency
The full food insecurity scale and the two subscales (food quality and food quantity) had good internal consistency, i.e. Cronbach’s α > 0·70. The value for Cronbach’s α for the full scale was 0·90. Cronbach’s α for the food quality subscale was 0·83 (four items) and for the food quantity subscale was 0·89 (five items).
Convergent validity and factors associated with household food insecurity
Household food insecurity scores ranged from 0 to 27 and the mean food insecurity score was 9·2 (sd 7·8), where a higher score represents greater food insecurity. Using the categorical measure of food insecurity, 20·7 % of the households were categorized as food-secure, 8·4 % as mildly food-insecure, 22·8 % as moderately food-secure and 48·1 % as severely food-insecure.
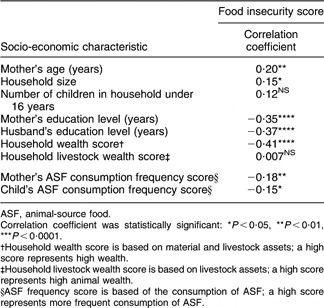
Table 4 shows the Pearson’s correlation coefficients between socio-economic characteristics and food insecurity scores, depicting the relationship between the socio-economic characteristics and the food insecurity measure. Food insecurity status was consistently and significantly associated with most socio-economic measures. Most significantly, higher levels of maternal education, paternal education and household wealth were associated with less food insecurity. Households with older mothers and more members also were relatively more food-insecure. Pastoralist households (mean food insecurity score 11·7 (sd 8·6)) were more likely to experience higher levels of food insecurity than agriculturalist households (mean food insecurity score 8·8 (sd 7·6); P = 0·034). There was no significant difference in food insecurity scores between Muslim households and households that were Christian or traditional religions. Both mothers and children consumed more ASF as food insecurity status improved. While mothers’ ASF consumption was marginally associated with household wealth (P = 0·07), children’s ASF consumption was significantly associated with household wealth (P = 0·01).
Table 4 Bivariate correlations between socio-economic characteristics and food insecurity: households (n 237) on rural Iringa, Tanzania, March 2008

ASF, animal-source food.
Correlation coefficient was statistically significant: *P < 0·05, **P < 0·01, ***P < 0·0001.
†Household wealth score is based on material and livestock assets; a high score represents high wealth.
‡Household livestock wealth score is based on livestock assets; a high score represents high animal wealth.
§ASF frequency score is based of the consumption of ASF; a high score represents more frequent consumption of ASF.
In a multivariate analysis adjusting for potential confounding factors, the socio-economic characteristics predicting household food insecurity scores included the household wealth score (P ≤ 0·0001), household size (P ≤ 0·0001), husband’s education level (P ≤ 0·0001) and the village effect (i.e. unmeasured variation among villages; P = 0·0005). A model including these variables accounted for 43 % of the variation in household food insecurity scores (n 220, R 2 = 0·43, F = 19·93, P < 0·0001).
Discussion
The purpose of the present study was to test the validity and reliability of the HFIAS measurement instrument and to determine the socio-economic characteristics associated with household food insecurity in the Iringa Rural District of Tanzania. To our knowledge, this is the first published study of the application of this scale in Tanzania.
The two main factors that emerged from the rotated principal component factor analysis – insufficient food quality and insufficient food intake – are generally consistent with the groupings of the nine items by domain as outlined by Coates et al.(Reference Coates, Swindale and Bilinsky10) and demonstrate construct validity(Reference Frongillo23). However, instead of identifying the three domains represented in the scale, our analysis produced two factors with the anxiety/worry factor not being represented. Item 1 of the scale, ‘Did you worry that your household would not have enough food?’, was found to have weak loadings on both factors, demonstrating that this item does not represent a separate concept, namely anxiety and uncertainty about the household food supply. Inability to detect anxiety/worry as a separate domain may be related to the overall high level of food insecurity in this population. Leyna et al.(Reference Leyna, Mmbaga, Mnyika and Klepp24) also found that worry/anxiety did not emerge as a separate domain in a validation study using the Radimer/Cornell scale, also conducted in Tanzania.
Response patterns to the HFIAS items were generally consistent with expectations, indicating that the scale follows the progression of the experience of food insecurity in the study area. However, it is notable that item 1, ‘Did you worry that your household would not have enough food?’, is the least severe indicator of food insecurity on the scale and yet did not receive the highest percentage of affirmative responses as expected. Possible reasons are that: (i) the question may not have been understood by all respondents; (ii) there are cultural differences in what ‘worry’ means and in the role it has in people’s lives; and/or (iii) anxiety and uncertainty about the household food supply, particularly during the hungry season, has become commonplace and is no longer perceived as anxiety. Alternatively, there may be a perceived lack of control over a household’s food situation. In certain countries where food insecurity is a daily reality, reductions in the quality and quantity of food have been shown to occur more often than expressed worry or anxiety about food. For example, in a sample of 600 households in Bangladesh, more households affirmed consuming lower-quality food more often (55·3 %) than worrying about their food supply (36·3 %)(Reference Coates, Frongillo, Rogers, Webb, Wilde and Houser3). We observed a similar pattern in our Tanzanian sample, suggesting that the overall severity of food insecurity may influence the patterns of response to the anxiety/worry item. More cognitive testing is needed to understand how uncertainty and anxiety over food supply are experienced in Tanzania. Furthermore, additional testing of the progression of the items of the scale within the local context is needed to explain slight inconsistencies in the results. For example, because there are more affirmative responses for item 6 than for item 5 (see Table 3) food-insecure households may resort to eating fewer meals before eating smaller meals, indicating a need for restructuring of the items.
Findings revealed a high percentage of sample households experiencing severe food insecurity. Since the study took place during the hungry season before the annual harvest of maize, a time marked by low household food stores, it is likely that this high percentage is accurate.
The internal reliability of the HFIAS is very similar to that of the Radimer/Cornell scale used by Leyna et al.(Reference Leyna, Mmbaga, Mnyika and Klepp24) (Cronbach’s α = 0·83–0·89 in our study compared with α = 0·78–0·85). Likewise, both instruments yielded two domains in the factor analysis, demonstrating similar construct validity. The socio-economic characteristics found to be correlated with food insecurity status in our study compare well with correlations to food insecurity status found in other studies using different instruments in rural Tanzania. Those studies have reported similar correlations between food insecurity status and ethnicity, wealth status, caregiver’s age and education(Reference Leyna, Mmbaga, Mnyika and Klepp24–Reference Hadley and Patil26). In addition, other studies also reported greater ASF consumption among households that were more food-secure(Reference Hadley, Mulder and Fitzherbert25).
Strengths of the current study were the use of a random sample, a food insecurity instrument designed to be used in a cross-cultural setting, and key informants to guide instrument development and wealth status categorization. Additional strengths are the systematic assessment of multiple measures of the scale’s validity and the variety of socio-economic characteristics assessed for correlations with food insecurity.
With a cross-sectional study, however, it is difficult to make causal inference and follow-up studies are required to examine how associations may differ over time and to evaluate the stability of the HFIAS over time. Furthermore, although the tool was developed for universal use and cognitive testing of the questionnaire was done, it is possible that it lacks cultural expressions of some aspects of food insecurity from the local perspective that were never explored. Finally, by restricting the sample to households that had chickens and young children during the time of the study, the ability to generalize the findings to the general population is limited. However, according to averages of approximations given by key informants, typically 85 % of households in the villages own chickens, 72 % of households have children between the ages of 1 and 5 years, and 70 % of households have both young children and chickens.
Although the HFIAS instrument demonstrates validity and reliability among poor households in rural Tanzania, we did not have a true gold standard to judge criterion validity. Instead, we examined the convergent validity, by correlating food insecurity and household wealth. Two previous studies have used other tools to measure food insecurity in Tanzania but there were limitations to these tools. The HFIAS addresses the shortcomings of the Radimer/Cornell food insecurity measure reported by Leyna et al.(Reference Leyna, Mmbaga, Mnyika and Klepp24) by more clearly capturing problems of both food quality and quantity in the local context. HFIAS avoids the drawbacks (stated in the introduction of the present paper) of relying heavily on coping strategies that supplement a household’s resource base in assessing food insecurity(Reference Coates, Swindale and Bilinsky10, Reference Hadley, Mulder and Fitzherbert25). Importantly, this simple instrument can be used by non-specialists and is relatively easy to analyse and interpret, minimizing the time and cost for organizations to identify and target groups that might benefit from programmes to reduce food insecurity.
Use of the HFIAS in the present study contributes to a larger global effort to compare its performance in different cultural settings, so that access to food can be rapidly and easily monitored across populations and geographic regions.
Acknowledgments
This research was made possible by a Jim Ellis Award from the Global Livestock Collaborative Research Support Program, which is funded by the Office of Agriculture, Bureau for Economic Growth, Agriculture and Trade, USAID, under terms of Grant No. PCE-G-00-98-00036-00. The opinions expressed herein are those of the authors and do not necessarily reflect the views of USAID. The authors declare that they have no competing interests. The authors accept the conditions specified in the Directions to Contributors. This submission represents original work that has not been published previously, that it is not being considered by another journal, and that, being accepted for Public Health Nutrition, will not be published elsewhere in the same form, in English or in any other language, without the written consent of the Nutrition Society. Each author has seen and approved the contents of the submitted manuscript. D.K. and L.K. were responsible for conception and design of the study, analysis and interpretation. D.K. was primarily responsible for data collection and writing, with substantial inputs from L.K. M.D. was responsible for conception and interpretation. We are grateful to the households and communities that participated in this study. Special thanks also to contributors and supporters from Sokoine University, the Wildlife Conservation Society in Iringa, the Wildlife Health Center of the University of California, Davis, and the Global Livestock Collaborative Research Support Program at the University of California, Davis.