


Introduction
Many large marine species, including sharks, marine turtles and cetaceans, are considered threatened throughout their range and require targeted management strategies to support their conservation (Lewison et al., Reference Lewison, Crowder, Read and Freeman2004; Hoffmann et al., Reference Hoffmann, Hilton-Taylor, Angulo, Böhm, Brooks and Butchart2010). The advent of so-called biologging, along with recent improvements in tag size, battery duration and location accuracy (Hays et al., Reference Hays, Ferreira, Sequeira, Meekan, Duarte and Bailey2016), means that we now know more about the complex life history characteristics and migratory life cycles of many marine vertebrates, information that can be used to inform conservation strategies, particularly for marine turtles (Hazen et al., Reference Hazen, Maxwell, Bailey, Bograd, Hamann and Gaspar2012). Large adult female marine turtles come ashore during short nesting periods, and juveniles and adults can be captured in-water, after which it is relatively easy to attach satellite and/or GPS platform transmitter terminals (PTTs) to their carapace (Jeffers & Godley, Reference Jeffers and Godley2016). Such application has revealed insights into the breeding, migratory, foraging and spatial ecology of hatchling, juvenile and adult marine turtles (Luschi et al., Reference Luschi, Hays and Papi2003; Mansfield et al., Reference Mansfield, Wyneken, Porter and Luo2014).
There remain, however, data gaps in some regions that host globally important populations of marine turtles, hindering conservation efforts (Hamann et al., Reference Hamann, Godfrey, Seminoff, Arthur, Barata and Bjorndal2010; Mazaris et al., Reference Mazaris, Almpanidou, Wallace, Pantis and Schofield2014). This is most notable for juveniles globally (Wildermann et al., Reference Wildermann, Gredzens, Avens, Barrios-Garrido, Bell and Blumenthal2018) and for all life stages along the Atlantic coast of Africa (Formia et al., Reference Formia, Tiwari, Fretey and Billes2003), where the status of several species and populations is considered Data Deficient (IUCN, 2017). Although research has increased in this region, it has primarily focused on monitoring nesting populations, leading to the identification of globally important nesting aggregations of leatherback Dermochelys coriacea, olive ridley Lepidochelys olivacea and green Chelonia mydas marine turtles (Witt et al., Reference Witt, Baert, Broderick, Formia, Fretey and Gibudi2009; Metcalfe et al., Reference Metcalfe, Agamboué, Augowet, Boussamba, Cardiec and Fay2015; Patrício et al., Reference Patrício, Formia, Barbosa, Broderick, Bruford and Carreras2017, and references therein). Foraging grounds have, however, remained largely understudied despite records of their occurrence from Banc d'Arguin in Mauritania, West Africa, to Mussulo Bay in Angola, Southern Africa (Carr & Carr, Reference Carr and Carr1991; Fretey, Reference Fretey2001; Cardona et al., Reference Cardona, Aguilar and Pazos2009). As a result, conservation strategies have largely been directed at identifying threats, and establishing new or expanding existing protected areas to protect key nesting beaches and inter-nesting habitats (Witt et al., Reference Witt, Broderick, Coyne, Formia, Ngouessono and Parnell2008; Maxwell et al., Reference Maxwell, Breed, Nickel, Makanga-Bahouna, Pemo-Makaya and Parnell2011; Pikesley et al., Reference Pikesley, Agamboue, Bayet, Bibang, Bonguno and Boussamba2018). Foraging grounds thus remain largely unprotected throughout the region, undermining ongoing conservation efforts for species such as the green turtle, which moves ontogenetically, with juveniles actively recruiting to neritic development habitats following several years of passive pelagic migration and then migrating to an adult foraging habitat that may also be shared with juveniles (Bjorndal, Reference Bjorndal, Lutz and Musick2017).
Given their proximity to the coast, neritic developmental and foraging habitats are often exposed to a diverse range of pressures, including from fisheries, direct take, and habitat degradation linked to coastal development and marine pollution, with impacts on green turtles exacerbated by their slow growth, late onset of sexual maturity and low survivorship (Hirth, Reference Hirth1997). Therefore, understanding how green turtles use foraging habitats is essential to support more coherent marine spatial planning and conservation efforts, particularly as ontogenetic strategies may vary between genetic stocks or regional management units (Hamann et al., Reference Hamann, Godfrey, Seminoff, Arthur, Barata and Bjorndal2010). This is where satellite tracking can play a role, revealing the location and extent of important foraging habitats such as seagrass beds and macroalgal dominated reefs (Scott et al., Reference Scott, Hodgson, Witt, Coyne, Adnyana and Blumenthal2012; Hays et al., Reference Hays, Alcoverro, Christianen, Duarte, Hamann and Macreadie2018). Tracking animal movements can also highlight variability in life history patterns among disparate populations (Bolten, Reference Bolten2003; Godley et al., Reference Godley, Blumenthal, Broderick, Coyne, Godfrey, Hawkes and Witt2008) such as the links between discrete foraging grounds and the degree of fidelity shown to these areas (Stokes et al., Reference Stokes, Broderick, Canbolat, Candan, Fuller and Glen2015).
To address the absence of knowledge on foraging grounds and inform conservation strategies along the Atlantic coast of Africa, we analyse historical satellite tracking data to provide the first description of the spatial ecology and movement of green turtles tagged with PTTs at a neritic foraging ground in Loango Bay, Republic of the Congo. Access to these data are timely given the Republic of the Congo recently announced its intention to create a marine conservation zone in Loango Bay to protect marine turtles and sharks (Our Ocean, 2016).
Study area
The Republic of the Congo is situated on the Atlantic coast of Central Africa, with Loango Bay, the focus of this study, 20 km north of the port city and economic capital, Pointe Noire (Fig. 1). Loango Bay covers an area of c. 100 km2, bounded by Pointe Indienne to the south, and the Kouilou river mouth to the north, and is characterized by shallow sheltered waters (< 10 m deep) that comprise a mosaic of habitats, including macroalgal dominated rocky reefs, and silt laden and sandy bottom habitats (Giresse et al., Reference Giresse, Kouyoumontzakis and Moguedet1980; Malounguila-Nganga et al., Reference Malounguila-Nganga, Giresse, Boussafir and Miyouna2017), which support a wide range of marine species (Girard et al., Reference Girard, LouvinGuila, Breheret, Monisinjon, Charra and Protat2014).
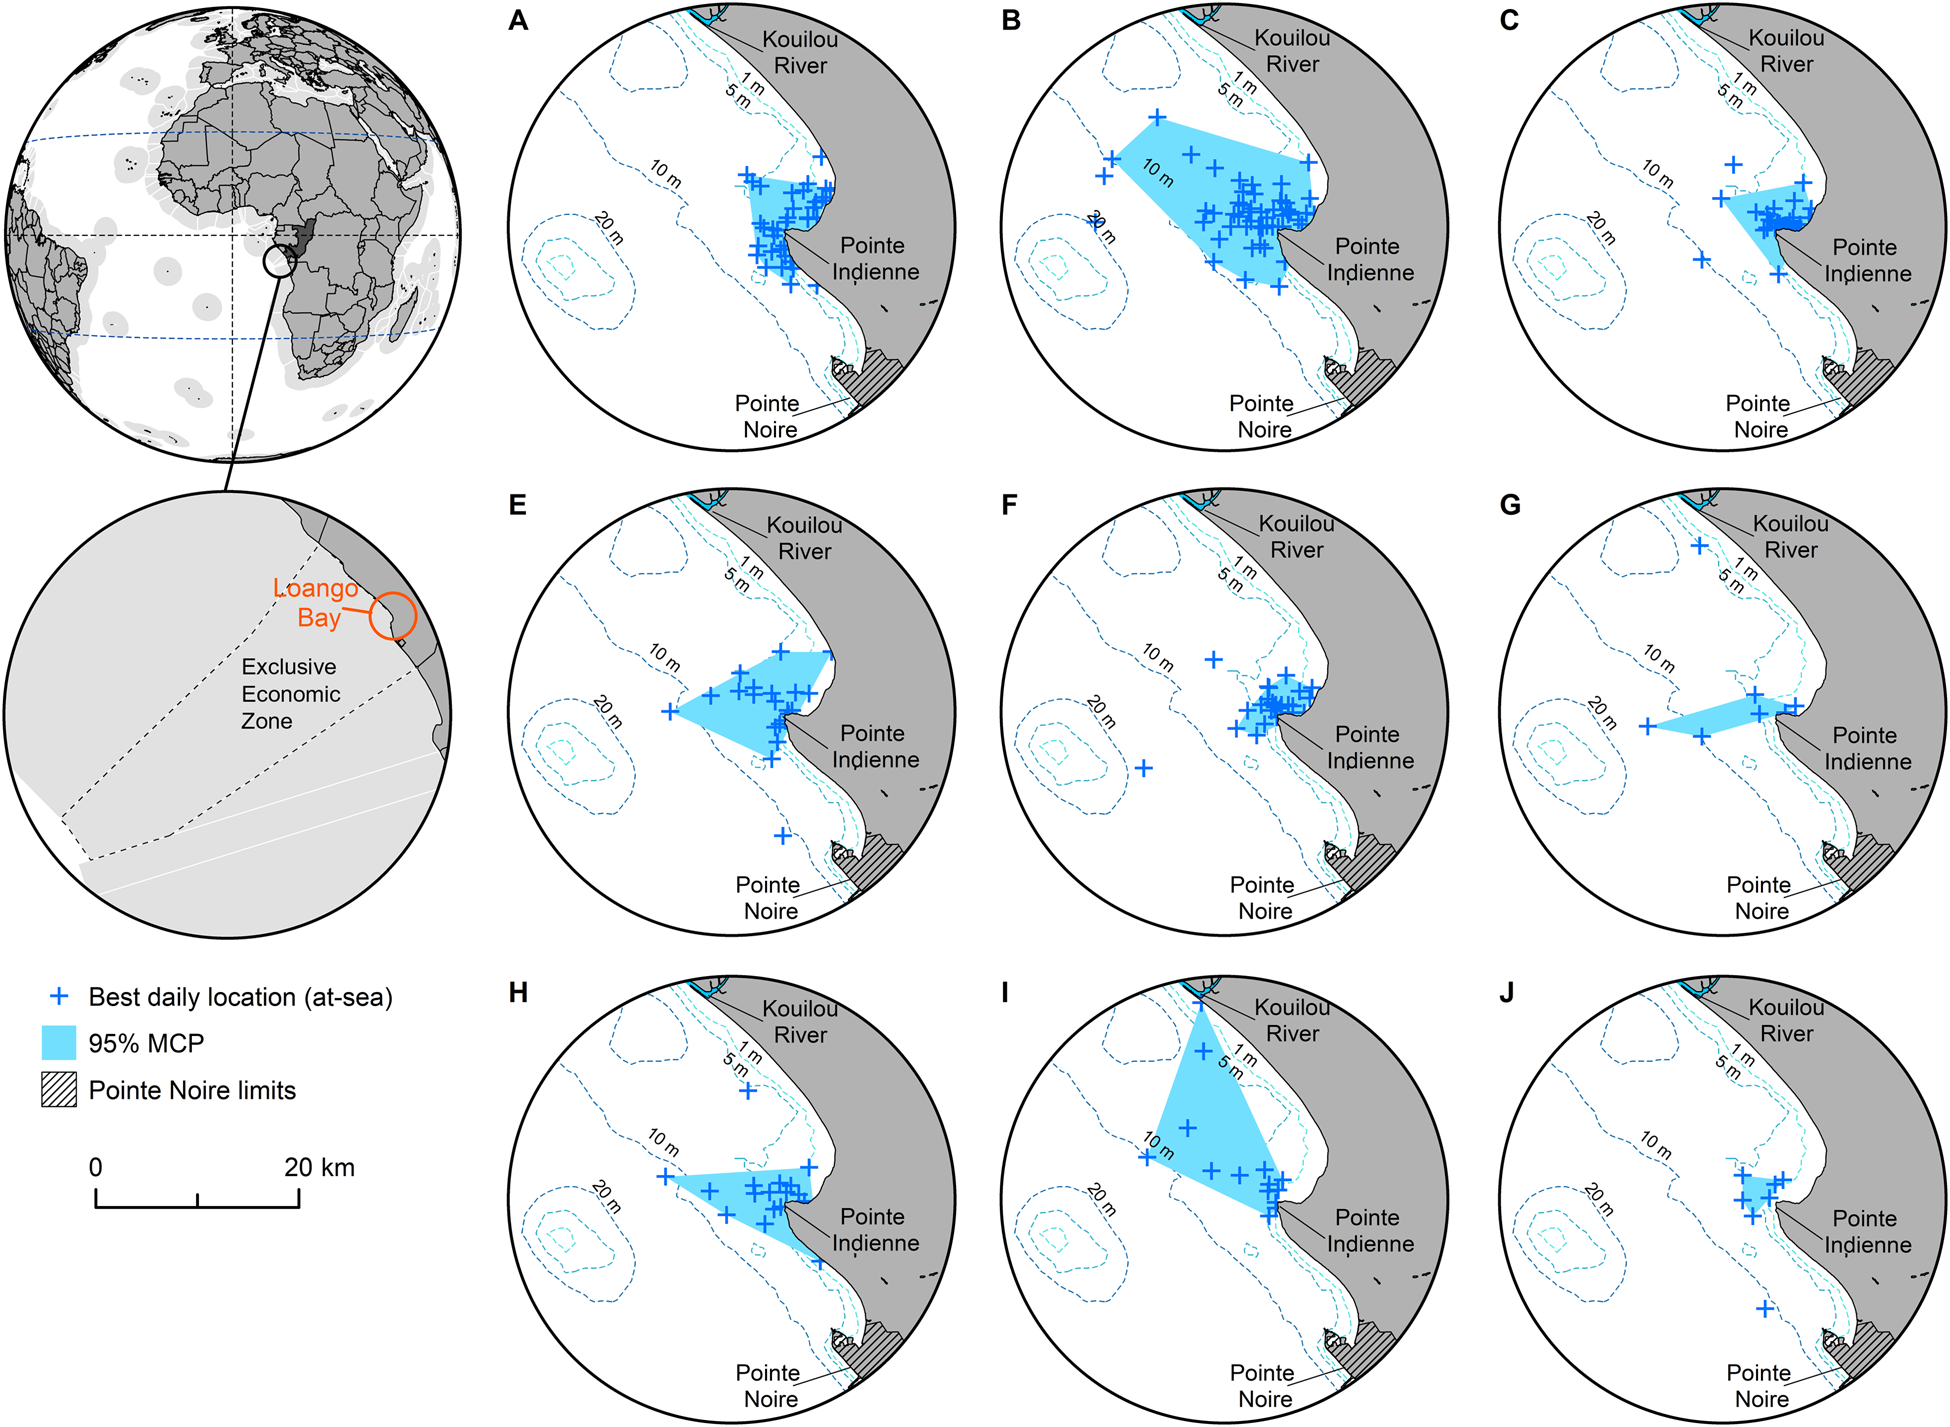
Fig. 1 Ninety-five percent minimum convex polygon (MCP) home ranges for each of nine individual green turtles Chelonia mydas tagged in Loango Bay, Republic of the Congo (Table 1, excluding individual D), derived from best daily locations at-sea. The 95% MCP for individual I is based on movements within foraging ground, clipped to 26 March 2013, the date this individual departed Loango Bay and started its migration south to Mussulo Bay, south of Luanda, Angola (Supplementary Figs 3 & 4).
Table 1 Metadata for each of the 10 green turtles Chelonia mydas tagged with satellite platform transmitter terminals (PTTs) in Loango Bay, Republic of the Congo. All individuals were released at Pointe Indienne.
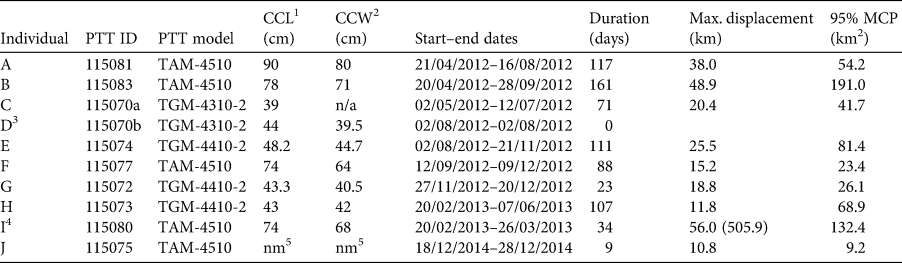
1 Curved carapace length (cm).
2 Curved carapace width (cm).
3 Tag failed < 24 h after deployment.
4 Max. displacement and MCP are based on movements within foraging ground, clipped to 26 March 2013, this being the date this individual departed Loango Bay and started migration south to Mussulo Bay, south of Luanda, Angola (total displacement post release in parentheses).
5 Not measured.
Methods
Satellite tracking data collection and processing
Telonics Inc. (Mesa, Arizona, USA) satellite PTT models TGM-4310-2 (153 g in air; n = 2), TGM-4410-2 (262 g in air; n = 3), and TAM-4510 (435 g in air; n = 5) were attached to 10 green turtles (individuals A–J) incidentally captured by artisanal fishers operating in Loango Bay and subsequently released at Pointe Indienne (Table 1, Fig. 1). PTTs were deployed during 2012–2014, with two deployments each in February, April and August, one deployment each in May, September, November and December, attached in accordance with established protocols (Godley et al., Reference Godley, Richardson, Broderick, Coyne, Glen and Hays2002).
Data transmitted by PTTs were collected using the Argos satellite system and downloaded with the Satellite Tracking and Analysis Tool (Coyne & Godley, Reference Coyne and Godley2005). For each PTT we used extremely parsimonious filters, per Varo-Cruz et al. (Reference Varo-Cruz, Bermejo, Calabuig, Cejudo, Godley and López-Jurado2016), removing all positions with location class Z and 0, and retaining positions with classes A, B, 1, 2 and 3, and applied a user-defined speed threshold (> 5 km/h) and azimuth filter (< 20°), to remove implausible Argos locations (Freitas et al., Reference Freitas, Lydersen, Fedak and Kovacs2008; Witt et al., Reference Witt, Akesson, Broderick, Coyne, Ellick and Formia2010) using the argosfilter package in R 3.5.0 (R Core Team, 2018). For each PTT, data were then resolved to single daily best quality locations (per Witt et al., Reference Witt, Akesson, Broderick, Coyne, Ellick and Formia2010). If more than one location was determined with equal quality within a 24-h period, the first location was retained. This data reduction technique was adopted to minimize the spatial and temporal autocorrelation that inherently exists within animal movement tracking data sets (De Solla et al., Reference De Solla, Bonduriansky and Brooks1999).
Spatial analyses
For each PTT we calculated daily and maximum displacement distance (km) from release location, and applied three established techniques typically used to describe core areas of occupancy and habitat use for a wide range of marine vertebrates (manta rays: Graham et al., Reference Graham, Witt, Castellanos, Remolina, Maxwell, Godley and Hawkes2012; basking sharks: Doherty et al., Reference Doherty, Baxter, Godley, Graham, Hall and Hall2017; marine turtles: Winton et al., Reference Winton, Fay, Haas, Arendt, Barco and James2018): (1) 95% minimum convex polygons (MCPs), (2) a polygon sampling grid, and (3) kernel density estimation. Ninety-five percent MCPs were calculated using all filtered locations (excluding 5% of the most extreme locations from the centroid of these data) for each individual turtle, and for combined individuals each month. For the polygon sampling, a 3.5 km2 hexagonal grid was constructed and spatially intersected with locations to derive a count of the total number of unique turtles recorded per grid cell. The mean proportion of locations was also calculated based on the proportion of locations recorded within each grid cell for each individual. Kernel density estimation was used to describe habitat use, and calculated using methods that account for physical barriers that can prevent movement for marine species (i.e. land; Sprogis et al., Reference Sprogis, Raudino, Rankin, MacLeod and Bejder2016). The output cell size was 50 × 50 m (0.0025 km2) and the bandwidth (search radius that determines the surrounding locations, which contribute to the estimation) was set to 1,500 m. The choice of a bandwidth selection method may vary depending on the study goals, sample size and patterns of space use by the study species (Gitzen et al., Reference Gitzen, Millspaugh and Kernohan2006), and therefore the bandwidth value was chosen by iterative visual inspection of outputs (per Sprogis et al., Reference Sprogis, Raudino, Rankin, MacLeod and Bejder2016). The output from kernel density estimation thus represents the estimated density of locations per km that are likely to occur within each grid cell, from which we extracted 95, 75, 50 and 25% utilization distributions. Finally, to describe habitat use within Loango Bay we calculated the proportion of locations within 10 seabed depth classes at 10 m intervals, and 10 offshore distance classes at 1 km intervals, for each tagged individual. Seabed depth (m) and offshore distance (km) values were assigned to each daily location using General Bathymetric Chart of the Oceans gridded data (resolution 30 arc-seconds; Weatherall et al., Reference Weatherall, Marks, Jakobsson, Schmitt, Tani and Arndt2015), and fine-scale coastline data extracted from Landsat data (Xu, Reference Xu2006), respectively.
Results
Deployment summary, size distribution, tracking duration and displacement distance
Of the 10 turtles tagged with satellite PTTs, one tag was excluded from subsequent analyses as it failed < 24 h post deployment (individual D; Table 1). For eight of the remaining nine tagged the turtles' body size data were available (curved carapace length, CCL: 39.0–90.0 cm, mean 61.2 ± SD 19.8 cm, median 61.1 cm, IQ range 43.2–75.0 cm; Table 1). These nine individuals were tracked for 9–161 days (mean 80 ± SD 50 days, median 88 days, IQ range 34–111 days; Table 1), with maximum displacement distance from release locations within the foraging ground of 10.8–56.0 km (mean 27.3 ± SD 16.5 km, median 20.4 km, IQ range 15.2–38.0 km; Table 1, Supplementary Fig. 1). There was no significant relationship between the size of individuals and tracking duration (days) or maximum displacement distance (km) from release locations (all P > 0.05; Supplementary Fig. 2).
General movements, core areas and habitat use
Of the nine tagged individuals that transmitted location data post deployment, eight remained within the vicinity of Pointe Indienne in Loango Bay (Supplementary Fig. 3) for 9–161 days (Table 1). One individual (I; Supplementary Fig. 3), however, migrated south after 34 days (Table 1). This took the turtle a minimum distance of 505.9 km along the continental shelf (< 200 m depth) over a period of c. 16.5 weeks (mean minimum speed 0.5 ± SD 0.5 km/h, median 0.3 km/h, IQ range 0.1–0.8 km/h, n = 18 locations) to foraging grounds in Mussulo Bay, Angola (Supplementary Fig. 4) where it remained for 30 days till cessation of tracking.
Prior to analyses of core areas, telemetry data for individual I (Table 1) was clipped at 26 March 2013, this being the date this turtle left the Loango Bay foraging ground (Supplementary Fig. 4). Within Loango Bay individual core areas of occupancy (based on 95% MCPs) of the nine individuals were 9.2–191.0 km2 (mean 69.8 ± SD 58.6 km2, median 54.2 km2, IQ range 26.1–81.4 km2; Table 1, Fig. 1). There was, however, no significant relationship between the CCL of individuals and the size of core areas (P > 0.05; Supplementary Fig. 2). Analyses of monthly variation revealed that core areas of occupancy (based on MCPs) did not vary systematically and were probably driven more by data volume and ARGOS location quality. MCPs ranged between 6 km2 in November to 168.8 km2 in June (mean 69.0 ± SD 53.6 km2, median 56.9 km2, IQ range 27.7–100.2 km2, n = 11 months; Supplementary Fig. 5).
In terms of habitat use, there was no evidence of size-related niche partitioning, with individuals of all sizes using similar depth zones and distances offshore (Supplementary Fig. 6). Analysis of location data by depth and offshore distance revealed that all size classes had a preference for waters < 10 m deep (mean proportion of locations < 10 m 0.64 ± SD 0.14, median 0.60, IQ range 0.56–0.72; Fig. 2) within 3 km of the coast (mean proportion of locations < 3 km offshore 0.69 ± SD 0.15, median 0.67, IQ range 0.57–0.81; Fig. 2). Location of high use areas (i.e. areas with high occupancy; > 10% of locations, and 50% utilization distribution) were restricted to shallow waters adjacent to and surrounding Pointe Indienne in Loango Bay (Fig 2).
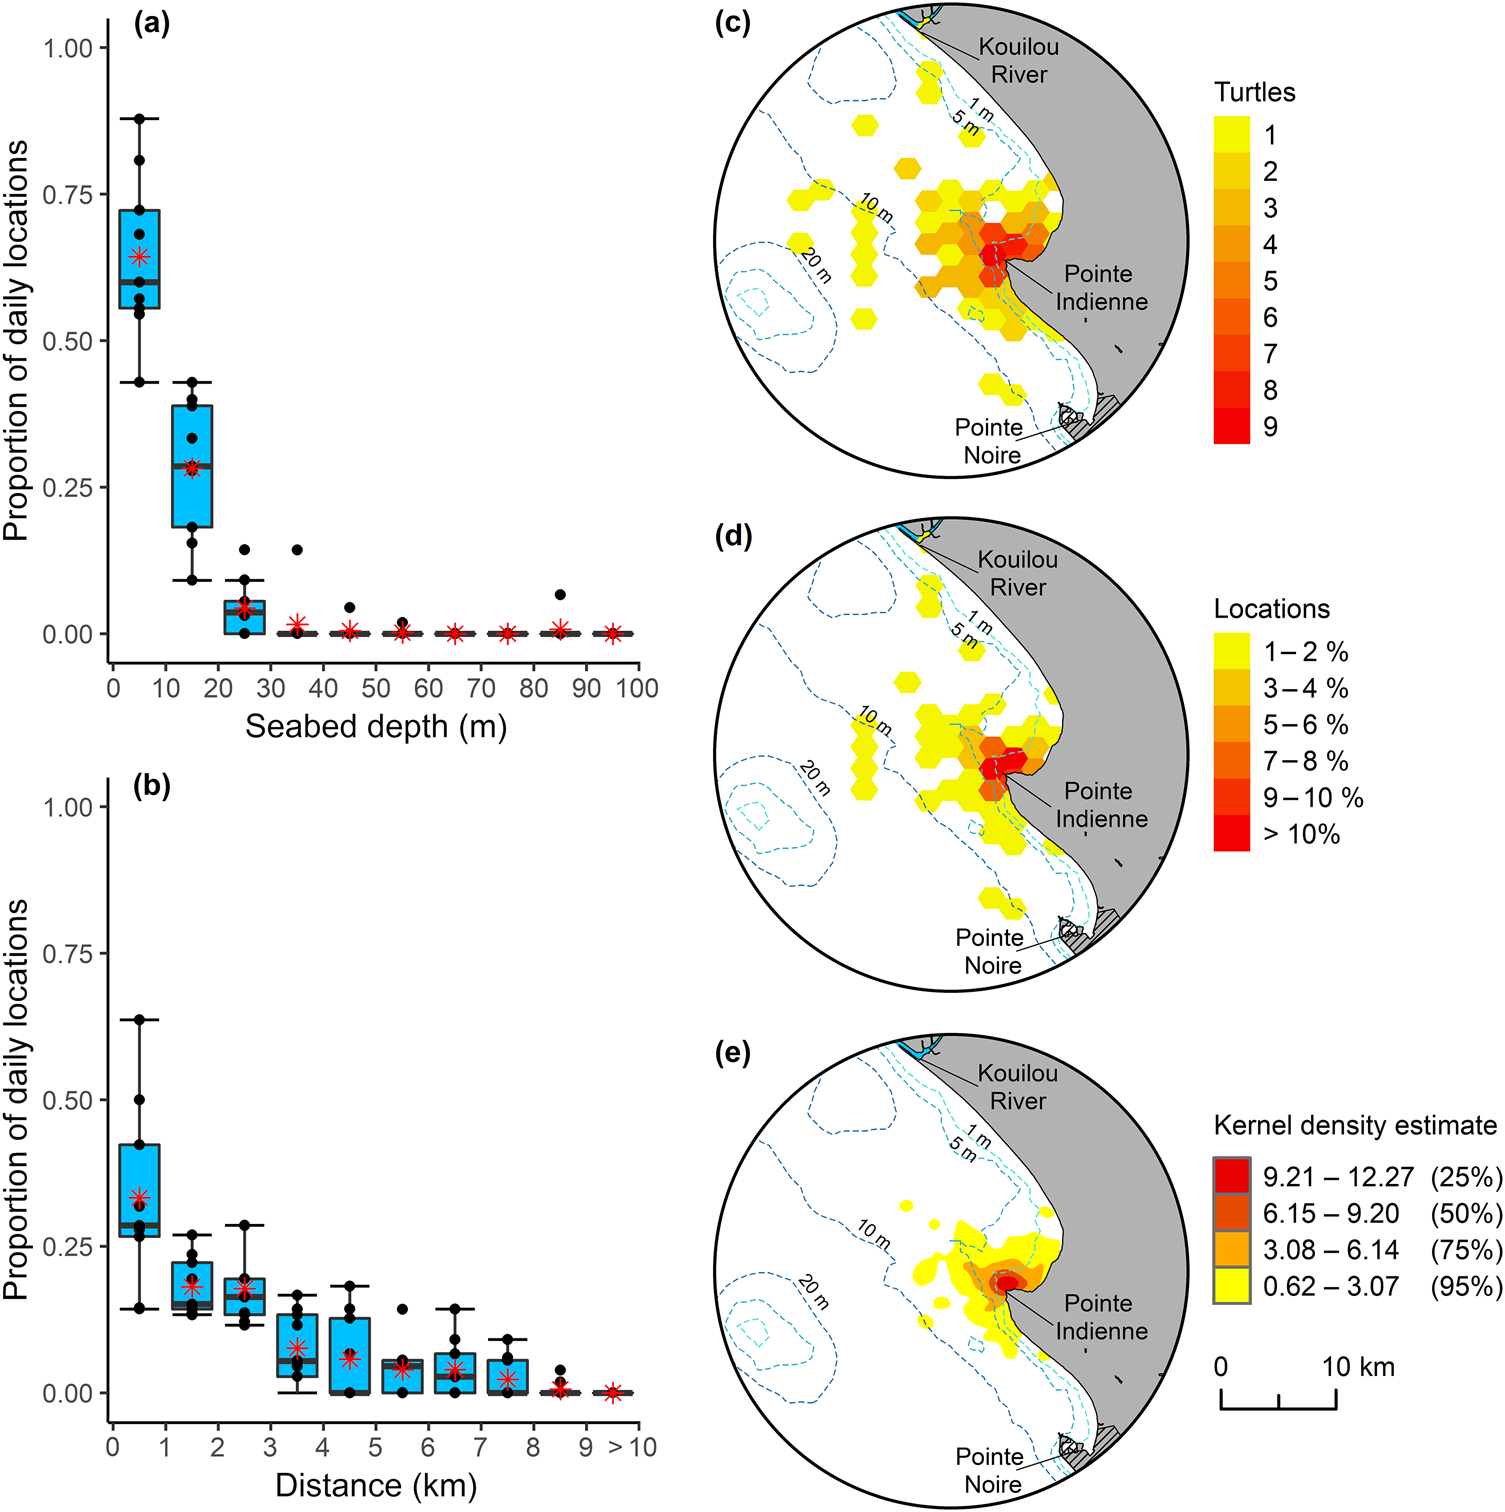
Fig. 2 Green turtle habitat use in Loango Bay. Proportion of daily locations by: (a) seabed depth, and (b) offshore distance for the nine tagged individuals (Table 1). Boxplots depict the 25th, 50th (median) and 75th percentiles, with mean value for each depth and offshore distance class represented by an asterisk. Core areas of occupancy for green turtles in Loango Bay: (c) grid count of unique number of turtles per hexagon, (d) mean proportion of daily locations derived from each tagged individual, and (e) kernel density estimate with 25, 50, 75 and 95% utilization distributions, derived from best daily locations at-sea.
Discussion
Marine turtles are migratory, often travelling great distances between natal beaches and foraging areas, and/or between foraging areas and reproductive sites (Godley et al., Reference Godley, Blumenthal, Broderick, Coyne, Godfrey, Hawkes and Witt2008). Yet for many of the world's marine turtle populations empirical data on the distribution and condition of important foraging areas, or the behaviour and ecology of individuals in these habitats, are lacking (Rees et al., Reference Rees, Alfaro-Shigueto, Barata, Bjorndal, Bolten and Bourjea2016; Williams et al., Reference Williams, Pierce, Rohner, Fuentes and Hamann2017). Describing marine turtle foraging grounds, including information on species, abundance, size/age classes present, area of occupancy, habitat preferences, and temporal patterns of their use, is key for effective conservation planning and targeted management (Casale et al., Reference Casale, Broderick, Freggi, Mencacci, Fuller, Godley and Luschi2012; Chevis et al., Reference Chevis, Godley, Lewis, Lewis, Scales and Graham2017; Williams et al., Reference Williams, Pierce, Rohner, Fuentes and Hamann2017). Our findings show how satellite tracking can facilitate insights into the spatial ecology and behaviour of green turtles at one of only a few documented mainland foraging grounds in Central Africa, Loango Bay in the Republic of the Congo, a country that despite hosting five species of marine turtle (Godgenger et al., Reference Godgenger, Breheret, Bal, N'Damité, Girard and Girondot2009) is poorly documented in the scientific literature.
The deployment of satellite tags on marine turtles incidentally captured by artisanal fishers operating in Loango Bay and subsequently released at Pointe Indienne revealed that green turtles generally exhibited high site fidelity to the foraging grounds within Loango Bay. Our data also show that Loango Bay foraging grounds comprise mixed size/age classes, with little variation in area of occupancy across individuals and no clear evidence of size-related niche partitioning commonly seen at other foraging grounds (Arthur et al., Reference Arthur, Boyle and Limpus2008; Ballorain et al., Reference Ballorain, Ciccione, Bourjea, Grizel, Enstipp and Georges2010). Core areas of occupancy for all size/age classes (defined as the 50% utilization distribution) covered an area of 5.6 km2 and were located in the shallow waters around Pointe Indienne in Loango Bay, with the majority of tagged individuals utilizing this same restricted area for 1–23 weeks prior to the tags ceasing transmission. Recent studies have shown that Loango Bay is subject to intensive small-scale fishing pressure (Metcalfe et al., Reference Metcalfe, Collins, Abernethy, Boumba, Dengui and Miyalou2017), and maritime vessel activity linked to shipping and the offshore petrochemical sector (Metcalfe et al., Reference Metcalfe, Bréheret, Chauvet, Collins, Curran and Parnell2018). The findings of this study thus validate calls to increase protection of nearshore habitats surrounding Pointe Indienne as excessive bycatch in fisheries, seismic surveys, oil pollution and coastal development can lead to behavioural changes, exclusion from or damage to critical habitats, and physical damage or mortality (Casale & Heppell, Reference Casale and Heppell2016; Nelms et al., Reference Nelms, Piniak, Weir and Godley2016; Duncan et al., Reference Duncan, Botterell, Broderick, Galloway, Lindeque, Nuno and Godley2017; Wallace et al., Reference Wallace, Brosnan, McLamb, Rowles, Ruder and Schroeder2017; Ylitalo et al., Reference Ylitalo, Collier, Anulacion, Juaire, Boyer and da Silva2017). The site fidelity shown by most tagged individuals also reinforces the potential utility of implementing a marine protected area in Loango Bay; even a moderate sized area of 5.6–76.4 km2 (50 and 95% utilization distributions) would offer significant protection to green turtles in high density foraging areas (Broderick et al., Reference Broderick, Coyne, Fuller, Glen and Godley2007; Scott et al., Reference Scott, Hodgson, Witt, Coyne, Adnyana and Blumenthal2012). In this case the density and fidelity is probably largely driven by the extensive use of macroalgal dominated rocky reefs, a geological extension of Point Indienne into Loango Bay (Giresse et al., Reference Giresse, Kouyoumontzakis and Moguedet1980; Malounguila-Nganga et al., Reference Malounguila-Nganga, Giresse, Boussafir and Miyouna2017), and so should form a key component of any proposed marine protected area.
Although most of the tagged individuals remained within the waters of the Republic of the Congo, satellite telemetry data provided the first documented evidence of linkages between discrete foraging grounds in Central and Southern Africa, with one individual migrating south 505.9 km from Loango Bay, Republic of the Congo, to Mussulo Bay, Angola, a 152 km2 area that during 1983–1985 was documented to contain extensive coral, algal and seagrass flats (Carr & Carr, Reference Carr and Carr1991). Given that green turtles are important indicators of habitat presence and condition (Scott et al., Reference Scott, Hodgson, Witt, Coyne, Adnyana and Blumenthal2012; Hays et al., Reference Hays, Alcoverro, Christianen, Duarte, Hamann and Macreadie2018) these findings suggest that this area, c. 30 years after its only documented survey, still contains resources to host green turtles. Few data are available on the abundance of green turtles in Mussulo Bay, but boat-based surveys and interviews conducted by Carr & Carr (Reference Carr and Carr1991) revealed that although juvenile, subadult and adult green turtles were present year-round (although there was seasonal variation in numbers), nesting was rare. Given these insights and the small sample size of our study it is important to interpret these findings cautiously. There are, however, three possible explanations for this movement. Firstly, given the small size of the individual tracked (individual I: CCL 74 cm; Table 1) relative to nesting adult females in the Gulf of Guinea (CCL: 98.3 ± SD 6.1 cm; Tomás et al., Reference Tomás, Godley, Castroviejo and Raga2010) and the fact that Loango Bay predominantly comprises macroalgae, this behaviour could represent an ontogenetic shift from juvenile to adult foraging grounds as Mussulo Bay is dominated by seagrass and so may be more suited to the dietary or energy requirements of larger animals. Secondly, given the departure date coincides with the end of the nesting season (September–April; Godgenger et al., Reference Godgenger, Breheret, Bal, N'Damité, Girard and Girondot2009) this behaviour could be evidence of post-nesting migration to adult foraging habitat in Angola, a behaviour typically observed in green turtles, with individuals often having high fidelity to specific foraging locations between breeding seasons (Broderick et al., Reference Broderick, Coyne, Fuller, Glen and Godley2007; Garnier et al., Reference Garnier, Hill, Guissamulo, Silva, Witt and Godley2012). Thirdly, this individual may have been tagged following migration from neritic developmental habitats elsewhere in the Gulf of Guinea, such as Corisco Bay, Gabon (given its proximity, c. 750 km), whilst on route to adult foraging habitat in Angola. Genetic analyses could help by providing detailed information of stock and natal origin (Bowen & Karl, Reference Bowen and Karl2007) that could disentangle the connections that exist among this and other green turtle rookeries and foraging grounds along the Atlantic coast of Africa (Rees et al., Reference Rees, Alfaro-Shigueto, Barata, Bjorndal, Bolten and Bourjea2016; Patrício et al., Reference Patrício, Formia, Barbosa, Broderick, Bruford and Carreras2017, and references therein).
Despite marine turtles having been legally protected in the Republic of the Congo since 2011 (Order No. 6075 establishing the animal species fully and partially protected by Law No. 48/83 21/04/1983), the complex nature of the marine environment, and overlapping claims for space as well as political and economic provisions (Metcalfe et al., Reference Metcalfe, Bréheret, Chauvet, Collins, Curran and Parnell2018), mean that it is extremely unlikely that the Congolese government will be able to fully protect the entire range over which marine turtles in our study were located. Nonetheless, significant efforts are being made by the Congolese government to implement a protected area in Loango Bay (Our Ocean, 2016), with a stakeholder led planning process underway (Congo Marine, 2018). If successful this would complement existing efforts to increase protection of marine turtle nesting beaches, inter-nesting areas and foraging grounds in other range states along the Central African coast (e.g. Gabon; Dawson et al., Reference Dawson, Formia, Agamboué, Asseko, Boussamba and Cardiec2017; Pikesley et al., Reference Pikesley, Agamboue, Bayet, Bibang, Bonguno and Boussamba2018). Our findings will thus ensure there is increased awareness regarding the location of core areas and critical foraging habitats that should be protected from deleterious activities such as fisheries and coastal development. This is of particular concern given the high incidence of marine turtle bycatch in artisanal fisheries in Loango Bay (Girard et al., Reference Girard, LouvinGuila, Breheret, Monisinjon, Charra and Protat2014). Finally, despite the small sample size of this study, our findings have also provided the first documented evidence of linkages between Loango Bay and other poorly studied foraging grounds in the region, exemplifying the need for further tracking, tagging and genetic studies, and comprehensive strategies that span national and international jurisdictions, if conservation efforts targeted at marine turtles in this region are to be effective.
Acknowledgements
Rénatura Congo are supported by funding from the Marine Turtle Conservation Fund (U.S. Fish & Wildlife Service, U.S. Department of the Interior). This study and data acquisition were supported by funding from the European Union, Total E&P Congo and MPD/Xstrata. KM and BJG were supported by funding from The Waterloo Foundation and the Darwin Initiative (Projects 20-009/23-011/26-014), the latter through funding from the Department for Environment, Food and Rural Affairs in the UK. PDD was supported by a NERC Science Innovation Placement (NE/R007039/1). We thank two anonymous reviewers for constructive comments.
Author contributions
Coordination, facilitation of fieldwork, deployment of satellite transmitters: NB, GB, AG, J-GM; data analysis: SKP, PDD, KM, BJG; data interpretation, writing: all authors.
Conflicts of interest
None.
Ethical standards
This research abided by the Oryx guidelines on ethical standards, and had approval from the University of Exeter Ethics committee, with appropriate permissions to conduct scientific research and disseminate findings provided by the Ministry of Scientific Research and Technological Innovation in the Republic of the Congo (Permits: No. 023/MRSIT/DGRST/DMAST and No. 167/MRSIT/IRF/DS).


