


Colorectal cancer (CRC) is the second most common incidence cancer and the fourth leading cause of cancer-related mortality worldwide( 1 ). Despite effective interventions to reduce mortality from CRC, some studies have suggested the protective effect of endoscopic screening may be less certain for proximal (right-sided) lesions( Reference Baxter, Goldwasser and Paszat 2 ). Subsequently, identifying risk modifying dietary and lifestyle factors and promoting behavioural changes is an important public health measure. A dietary exposure that has been the subject of intense research in both animal and humans are PUFA( Reference Cockbain, Toogood and Hull 3 ).
In animal studies, n-6 PUFA, specifically arachidonic acid (ARA), have been linked to the promotion of CRC whereas n-3 PUFA may protect against cancer( Reference Reddy 4 ). Both 20-carbon chain n-6 and n-3 PUFA are substrates for cyclo-oxygenase (COX) enzymes but lead to different end-products. The former leads to highly inflammatory series-2 PG and the latter leads to the less inflammatory series-3 eicosanoids( Reference Larsson, Kumlin and Ingelman-Sundberg 5 ). Elevated concentrations of PGE2, a series-2 eicosanoid, is associated with colorectal adenomas and cancers and the cancer-inhibitory effects of non-steroidal anti-inflammatory drugs (NSAID) are thought to be mediated through the reduction of PGE2 ( Reference Giardiello, Yang and Hylind 6 – Reference Shrubsole, Cai and Wen 11 ). n-3 PUFA are believed to act similarly to NSAID and block COX-mediated production of inflammatory eicosanoids through competitive inhibition of n-6 PUFA. n-3 PUFA also may act through anti-inflammatory eicosanoids which reduce cell proliferation, enhance cell apoptosis and promote cell differentiation( Reference Larsson, Kumlin and Ingelman-Sundberg 5 , Reference Rose and Connolly 12 , Reference Cheng, Ogawa and Kuriki 13 ). In vitro studies have demonstrated that the incorporation of EPA, a marine-derived n-3 PUFA from cell-culture medium resulted in reduced synthesis PGE2 ( Reference Hawcroft, Loadman and Belluzzi 14 ). In addition, increasing dietary intake of n-3 PUFA in vivo also reduces PGE2 production( Reference Blair, Prakash and Phillips 15 – Reference Garg, Sebokova and Thomson 17 ).
Several observational studies suggested that n-3 PUFA might be associated with a decreased risk of colorectal neoplasms; however results have been inconsistent( Reference Murff, Shrubsole and Cai 10 , Reference Murff, Shu and Li 18 – Reference Geelen, Schouten and Kamphuis 24 ). The majority of these studies employ FFQ to estimate PUFA intake exposure. Food conversion estimations are imprecise as PUFA amounts vary by food source, season of capture/harvest and cooking methods. In addition, the biosynthesis of long-chain PUFA is inefficient and varies from person to person( Reference Cottet, Collin and Gross 25 ). Blood-based biomarkers of PUFA intake are more objective and more accurate estimates of biological exposure. Only a small number of studies have incorporated biomarkers of fatty acids into their study design, with many of these studies limited by sample size( Reference Cottet, Collin and Gross 25 – Reference Kojima, Wakai and Tokudome 30 ). In addition, many prior studies have utilised serum fatty acid measurements, which are more susceptible to fasting status compared with erythrocyte membranes fatty acid content. We evaluated the association between erythrocyte PUFA content and non-advanced and advanced adenomas using the Tennessee Colorectal Polyp Study (TCPS), one of the largest, colonoscopy-based case–control studies of incident adenomas within the USA. We hypothesised that higher proportion of erythrocyte n-3 PUFA would be associated with a reduced risk of colorectal adenoma.
Methods
Participants
Study methods for TCPS have been published elsewhere( Reference Shrubsole, Wu and Ness 31 , Reference Murff, Shrubsole and Smalley 32 ). In brief, eligible participants, aged 40 and 75 years, were identified from patients scheduled for a colonoscopy at the Vanderbilt Gastroenterology Clinic between 1 February 2003 and 31 April 2010 and the Veterans’ Affairs Tennessee Valley Healthcare System (VA) between 21 August 2003 and 30 May 2007. Patients with genetic CRC syndromes (such as hereditary non-polyposis CRC or familial adenomatous polyposis) or a previous history of inflammatory bowel disease, adenomatous polyps, or any cancer other than non-melanoma skin cancers were excluded from the study. Most of the participants were recruited at the time of the colonoscopy (n 11 863). For potential participants who were missed at the time of the colonoscopy, recruitment occurred after the procedure (n 722), which occurred in 6 % of subjects and resulted when study staff members were not available to meet the participant at recruitment. Participants missed at the time of colonoscopy were not asked to provide a blood sample and were not included in these analyses.
Of the 12 585 eligible individuals, 7838 subjects provided a written informed consent and had a blood sample (62 %). For the current study, we utilised case–control sets that had been previously identified as part of a prior study augmented with additional 1:1 matching( Reference Shrubsole, Cai and Wen 11 ). Cases were classified into three case groups: single small adenomas, multiple small adenomas and advanced adenomas. Controls were matched to case groups by age (within 5 years), sex, race (white/non-white). Additional matching criteria included at least one of the following criteria: sample collection date (within 90 d or season), study site (Vanderbilt University Medical Center/Veterans Affairs hospital) and regular use of NSAID (current, former or never). We matched 788 single or multiple tubular adenoma cases and 254 advanced adenoma cases to 975 polyp-free controls.
Outcome assessment
Patient colonoscopy results were recorded using standardised data-entry forms. Information on the number, location and size of polyps were collected. Polyps were classified as an adenoma (which included villous, tubulovillous, tubular, sessile serrated and traditional serrated on the basis of a histologic review), hyperplastic, mixed or other. A polyp was considered an advanced adenoma if it met one of the following three criteria: (1) size ≥1·0 cm, (2)>25 % villous component or (3) contained high-grade dysplasia.
Covariate assessment
A standardized telephone interview was conducted by trained interviewers after the colonoscopy to obtain information on medication use, demographics, medical history, family history, reproductive history, anthropometric measures and lifestyle. Interviewers were blinded to the results of the colonoscopy. Participants completed a semi-quantitative 108-item FFQ which was developed to capture diet in the southeastern USA( Reference Buchowski, Schlundt and Hargreaves 33 ).
Laboratory assays
Participants recruited before colonoscopy were asked to donate a 15-ml fasting blood sample. Whole blood was separated into plasma, buffy coats (white cells) and erythrocytes, whereas viable lymphocytes were retained (heparin tube). Samples were processed within 6 h of collection and stored for future analyses in −80°C freezer. Erythrocyte membrane phospholipid fatty acid percentages were determined by GC. In brief, the method was as follows. Total lipids were extracted from 200 μl of double-washed packed erythrocytes using the method described by Folch et al. ( Reference Folch, Lees and Sloane Stanley 34 ). Phospholipids were isolated using TLC on Silica Gel 60A plates and fatty acids methylated using BF3/methanol( Reference Morrison and Smith 35 ). The methylated fatty acids were analysed by GC using an HP 7890A gas chromatograph equipped with flame ionisation detectors and a capillary column (SP2380, 0·25 mm×30 m, 0·20 µm film, Supelco). He was used as a carrier gas. Fatty acid methyl esters were identified by comparing the retention times to those of known standards. Inclusion of the internal standard, dipentadecanoyl phosphatidylcholine (C15 : 0), permitted quantitation of the amount of phospholipid in the sample. Fatty acid values are presented as percentage of total erythrocyte membrane phospholipid fatty acid content. The lowest level of detection for individuals’ fatty acids is <0·4–0·5 % of the total profile. The inter-assay CV <10 % for all measured fatty acids with the exception of DPA (12 %), and DHA (12 %). The intra-assay CV was <10 % for all measured fatty acids. Laboratory staff was blinded to case–control status and any other information on study subjects.
For this study n-6 PUFA included: linoleic acid (LA: 18 : 2n-6), di-homo-γ-linolenic acid (DGLA: 20 : 3n-6) and ARA (20 : 4n-6). n-3 PUFA included EPA (20 : 5n-3), DPA (22 : 5n-3) and DHA (22 : 6n-3). We were unable to detect any α-linolenic acid (18 : 3n-3) within the erythrocyte membrane which is similar to prior studies and likely reflects that α-linolenic acid predominately undergoes β-oxidation after consumption( Reference Hodson, Skeaff and Fielding 36 , Reference Barcelo-Coblijn and Murphy 37 ).
Ethical standards
The study was approved by the Vanderbilt University Institutional Review Board, the Veterans’ Affairs Institutional Review Board and the Veterans’ Affairs Research and Development Committee.
Statistics
From the 2017 matched participants, we excluded fifty-eight participants (2·9 %) that did not have sufficient samples to measure erythrocyte fatty acids. After measuring erythrocyte fatty acids, we excluded 110 participants (5·4 %) whose total fat content was <1000 µg/ml as this lower content would result in an artificially increased proportion of more common erythrocyte membrane fatty acids. Finally, we excluded seven participants who withdrew consent for participation (0·3 %). Our analytic set thus included 714 tubular adenomas, 230 advanced adenomas and 898 polyp-free controls. The loss of these samples resulted in uninformative strata for the conditional regression, so our final analytic cohort included 681 tubular adenomas, 223 advanced adenomas and 835 polyp-free controls matched in pairs (n 775), triplets (n 51) or quadruplets (n 9).
We compared differences between case and control participants by using Wilcoxon’s rank-sum test for continuous variables or the Cochran–Mantel–Haenszel χ 2 test for categorical variables. We used partial Spearman’s correlation coefficients to determine the correlation between self-reported PUFA dietary variables and erythrocyte membrane percentages adjusted by age, sex, BMI, energy intake, tobacco use, alcohol use, and educational level. We compared differences in erythrocyte PUFA membrane percentages categorised by smoking status, alcohol use and NSAID use using the Wilcoxon rank-sum test. Conditional logistic regression models were used to estimate risk of colorectal polyps associated with PUFA intake. erythrocyte membrane PUFA were categorised into quantiles based on the distribution of control participants for each individual PUFA when that PUFA was the independent variable. More than one-third of participants had concentrations of EPA below the detectable limits and these were treated as a level of zero before categorisation by median percentage. Thus for EPA the lowest tertile was derived based on controls with erythrocyte membrane EPA percentages below the level of detection, whereas the second and third tertile was derived based on the median value in participants with detectable EPA percentages.
We constructed separate logistic regression models with a dependent variable of all adenomas and advanced adenoma for each PUFA. All models were adjusted for age (continuous), BMI (kg/m2; continuous), total energy intake (kJ/d (kcal/d); in quartiles), regular alcohol use (never used, former use, current use), cigarette use (never used, former use, current use), regular physical activity in the past 10 years (yes, no), menopausal status (postmenopausal, peri/pre-menopausal), educational status (graduate or professional school, college graduate or less), family history of CRC or adenomas (yes, no) and indication for colonoscopy (screening, diagnostic). n-3 PUFA and n-6 PUFA complete along similar biochemical pathways and increased intake of one of these PUFA will reduce tissue concentrations of the other( Reference Lands 38 – Reference Calder 40 ). As such, models where the dependent variable was an n-6 PUFA were adjusted by erythrocyte membrane n-3 PUFA percentages, whereas models where the dependent variable was an n-3 PUFA were adjusted by erythrocyte membrane n-6 PUFA percentages. Tests of trend were estimated by using the median concentration within each tertile as a continuous variable within the models. To formally test for possible interactions between dietary variables (total fat, total SFA, total MUFA, total PUFA, total carbohydrates, total protein) and erythrocyte membrane PUFA percentages, we included the cross product of self-reported dietary intake with individual erythrocyte membrane PUFA within our models and used the likelihood ratio test to evaluate potential multiplicative interactions of the two variables by comparing the models with and without the cross-product term of these variables. These models were adjusted for the same covariates as above. All statistical calculations were performed with SAS software (version 9.2; SAS Institute).
Results
Demographic and lifestyle factors of cases and controls are presented in Table 1. Cases were older, more likely to drink alcohol and currently smoke. Cases were more likely to be postmenopausal and had obtained a lower educational level.
Table 1 Demographic characteristics by case status (Numbers and percentages; medians and interquartile ranges (IQR))
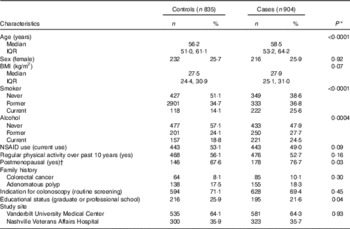
NSAID, non-steroidal anti-inflammatory drugs.
* P values estimated using Wilcoxon’s rank order sum test for continuous variables and χ 2 for categorical variables.
† Women only (n 448).
We found no statistically significant difference between cases and controls regarding self-reported dietary intake of protein, carbohydrate, fats or individuals fatty acids (Table 2). Cases did report higher dietary intake of ARA however this did not reach statistical significant (P=0·09). The Spearman partial correlation coefficients for self-reported dietary variables and erythrocyte membrane percentages were 0·13 (95 % CI 0·08, 0·18; n 1585) for LA, 0·01 (95 % CI −0·04, 0·06; n 1585) for ARA, 0·20 (95 % CI 0·15, 0·24; n 1577) for EPA and 0·28 (95 % CI 0·24, 0·33; n=1532) for DHA.
Table 2 Self-reported nutrient intake by case status (Medians and interquartile ranges (IQR)
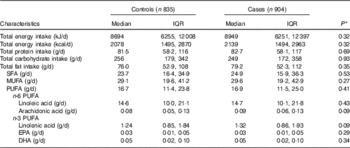
* P values estimated using Wilcoxon’s rank order sum test for continuous variables.
We found no evidence of an association with LA or DGLA and adenoma risk (Table 3). We found an increased risk of adenomas with increasing erythrocyte membrane ARA percentages (adjusted OR (aOR)T2–T1 1·64; 95 % CI 1·10, 2·43; aORT3–T1 1·66; 95 % CI 1·05, 2·62, P for trend=0·02). The effect size appeared greater for advanced adenomas (aORT2–T1 2·34; 95 % CI 0·96, 4·71; aORT3–T1 2·59; 95 % CI 1·00, 6·69, P for trend=0·04).
Table 3 Association between erythrocyte membrane PUFA and adenoma risk (Adjusted odds ratios and 95 % confidence intervals)

LC PUFA, long-chain PUFA.
* Models adjusted for age, BMI, energy intake, alcohol use, smoking status, physical activity, postmenopausal status, educational level, family history of colorectal adenoma/cancer, indication for colonoscopy and remaining erythrocyte PUFA concentration.
We found that participants with erythrocyte membrane DPA at the highest tertiles had an OR associated with all adenomas of 0·64 (95 % CI 0·41, 1·00) compared with individuals at the lowest tertile (P for trend=0·05). We found no evidence of an association between erythrocyte fatty acids and all adenomas or advanced for any other individual n-3 long-chain PUFA (LC PUFA). We found a statistically significant trend between erythrocyte membrane EPA percentage and advanced adenoma risk (aORT2–T1 0·90; 95 % CI 0·37, 2·21; aORT3–T1 0·41; 95 % CI 0·16, 1·05, P for trend=0·04).
We found no evidence of a statistically significant interaction between self-reported total protein, total carbohydrate, total fat, total SFA, total MUFA and total PUFA and individual erythrocyte membrane phospholipid PUFA percentages (data not shown).
Discussion
In this large, case–control study using biomarkers of dietary PUFA intake, we found that lower erythrocyte membrane percentages of ARA was associated with reduced odds of any adenomas with a stronger effects for advanced adenomas. We found higher erythrocyte membrane percentages of DPA were associated with a reduced risk of any adenoma, whereas higher erythrocyte membrane percentages of EPA were associated with a trend towards a reduce risk of advanced adenomas.
Several prior studies have utilised biomarkers of fatty acid exposure to investigate the association of PUFA and colorectal neoplasm risk. These studies can be difficult to compare given the differing methodologies to measure fatty acids (serum phospholipids, cholesterol esters, erythrocyte membranes) and differing outcomes (adenomas v. cancers). We only identified a single prior study evaluating the association between erythrocyte membrane phospholipids fatty acid and colorectal adenomas. In this nested case–control study within the French E3N-EPIC (European Prospective Investigation into Cancer and Nutrition) cohort, an inverse association between erythrocyte membrane percentages of EPA (ORT3–T1 0·50; 95 % CI 0·27, 0·93) and DHA (ORT3–T1 0·50; 95 % CI 0·26, 0·96) and advanced adenoma risk was reported( Reference Cottet, Collin and Gross 25 ). Pot et al. ( Reference Pot, Geelen and van Heijningen 28 ) conducted a case–control study of colorectal adenomas determining PUFA exposure through serum cholesterol esters. In this study, total serum n-3 PUFA were inversely associated with colorectal adenoma risk with an adjusted OR of 0·67 (95 % CI 0·46, 0·96) when comparing the highest to the lowest tertile. Ghadimi et al.( Reference Ghadimi, Kuriki and Tsuge 29 ) also reported a statistically significant inverse association between serum DHA and colorectal adenoma risk.
For CRC, Kuriki et al.( Reference Kuriki, Wakai and Hirose 27 ) conducted a case–control study of CRC, measuring erythrocyte membrane fatty acids and reported an inverse association with DHA and CRC risk (OR T3–T1 0·36; 95 % CI 0·14, 0·93). Coviello et al. ( Reference Coviello, Tutino and Notarnicola 41 ) also reported than CRC patients have lower erythrocyte membrane percentages of n-3 PUFA. Hall et al. ( Reference Hall, Campos and Li 42 ) conducted a nested case–control study within the Physicians’ Health Study and reported a non-significant inverse correlation between whole blood total n-3 PUFA and CRC risk (relative riskQ4–Q1 0·60; 95 % CI 0·32, 1·11). In a nested case–control study of the Japan Collaborative Cohort Study, whole blood total n-3 PUFA was associated with a reduced risk for CRC (OR 0·24; 95 % CI 0·08, 0·76)( Reference Kojima, Wakai and Tokudome 30 ). Finally Hodge et al. measured plasma phospholipid fatty acids in a case-cohort design including 395 CRC cases. In this study, they reported a statistically significant inverse HR in the fourth (HR=0·65; 95 % CI 0·46, 0·91) and fifth quintiles (HR=0·71; 95 % CI 0·51, 0·99) of serum DHA but a non-statistically significant trend in total n-3 PUFA (P trend=0·08). Yang et al. ( Reference Yang, Wang and Ren 43 ) conducted a meta-analysis of biospecimen measured n-3 PUFA and CRC cases including 60 627 participants. In this study, having higher n-3 LC PUFA was associated with a lower risk of CRC which was seen in both case–control studies (pooled OR 0·76; 95 % CI 0·59, 0·97) and cohort studies (pooled OR 0·70; 0·55, 0·88). These findings were driven by EPA and DHA levels with DPA levels being null although only a single prospective study reported DPA levels.
Our findings with regards to ARA however are not consistent with prior studies. None of the prior studies we identified have reported a statistically significant increased association between circulating ARA and colorectal neoplasm. Indeed, two studies have even reported an inverse association between ARA and colorectal adenoma or cancer( Reference Kuriki, Wakai and Hirose 27 , Reference Ghadimi, Kuriki and Tsuge 29 ). These findings are difficult to explain given the generally consistent finding of tissue ARA and colon cancer risk reported in rodent studies( Reference Fan, Callaway and M Monk 44 , Reference Whelan and McEntee 45 ). The only prior study which investigated erythrocyte fatty acids and colorectal neoplasm risk reported an association between erythrocyte membrane ARA percentage and adenomas that did not reach statistical significance (ORT3–T1 1·29; 95 % CI 0·89, 1·87)( Reference Cottet, Collin and Gross 25 ). This study differed from ours in being conducted exclusively in women who had a lower BMI and reported much lower smoking rates. In addition our population appeared to have higher erythrocyte ARA and lower erythrocyte n-3 LC PUFA percentages. Nevertheless, the lack of consistency regarding the association of ARA to colorectal neoplasms as opposed to the findings with n-3 LC PUFA suggest that additional work is needed to determine how the absolute and relative concentrations of these PUFA impact tumorigenesis.
Erythrocyte membrane phospholipid ARA percentages measure both exogenous and endogenous ARA exposure. Thus our strong association between erythrocyte membrane ARA and advance adenoma risk could reflect exposure status to a diet high in red meat, which has already been described as a risk factor for CRC( Reference Bouvard, Loomis and Guyton 46 ). We did not see an increase in self-reported ARA intake in our cases; however, the correlation between self-reported ARA intake and erythrocyte membrane percentages in our study was very low. As such, our dietary questionnaires may not be accurately capturing diet- derived ARA exposure. In addition to exogenous sources, ARA membrane content is also determined by the endogenous conversion of LA through a series of desaturase and elongase reactions( Reference Rzehak, Heinrich and Klopp 47 – Reference Hong, Karlsson and Magnusson 57 ). We found no association between erythrocyte membrane LA and adenoma risk. It has not been demonstrated in humans that increased dietary LA results in increased ARA levels given the already relatively large contribution dietary LA contribution to total PUFA intake( Reference Rett and Whelan 58 , Reference Kris-Etherton, Taylor and Yu-Poth 59 ). As such, absolute intake of LA would be less likely to impact ARA membrane percentages while desaturase and elongase activity would be more important. We found no association between indirectly estimated desaturase activity (estimated as the product to pre-cursor ratio of DGLA:LA and ARA:DGLA) and adenoma risk suggesting that changes in PUFA metabolism might not explain our findings (data not shown). Nevertheless, a GWAS in East Asians found variants in fatty acid desaturase to be associated with CRC risk( Reference Zhang, Jia and Matsuda 60 ). Additional work is warranted to better define the role of endogenous ARA biosynthetic capacity in colorectal carcinogenesis.
Although blood-based biomarkers may be less susceptible to confounding compared with self-reported questionnaires, confounding could still have contributed towards our findings. We have published previously in the TCPS study, that tobacco use is associated with reduced n-3 PUFA erythrocyte membrane percentages and tobacco is a known risk factor for colorectal adenomas( Reference Murff, Tindle and Shrubsole 61 , Reference Botteri, Iodice and Raimondi 62 ). We adjusted for tobacco use in our models however residual confounding could exists. We did not find any differences in erythrocyte membrane ARA levels between smokers and non-smokers. With respects to alcohol consumption, self-reported alcohol use did not influence erythrocyte membrane ARA percentages but were related to higher DPA (median percentage=2·25; interquartile range (IQR) 1·83, 2·62 v. 2·16; IQR 1·73, 2·49, P=0·01) and EPA (median percentage=0·46; IQR 0, 0·69 v. 0·35; IQR 0, 0·56, P=0·003) erythrocyte percentages in current alcohol users compared with never users. Given the direct association between alcohol use and colorectal adenoma, it seems unlikely that alcohol use may have confounded the associations( Reference Fedirko, Tramacere and Bagnardi 63 ). In addition, we found no differences in erythrocyte membrane PUFA in NSAID users compared with non-users.
Our study has many important strengths. We utilised blood-based biomarkers to estimate the exposure to PUFA, which may decreases misclassification and ultimately provides us with the ability to obtain stronger associations. As this is the largest colonoscopy-based case–control study to incorporate erythrocyte membrane PUFA percentages, we had ample power to assess associations between PUFA and risk of colorectal adenoma. There are also some limitations to this study. The blood samples were collected on the same day that the colonoscopy was performed immediately before procedure. Erythrocyte membrane fatty acids are insensitive to fasting status and reflect dietary fatty acid intake over the preceding 120 d( Reference Innis, Kuhnlein and Kinloch 64 – Reference Harris, Varvel and Pottala 68 ). Nevertheless it is possible that conditions related to the bowel preparation procedure could have influenced erythrocyte membrane fatty acid percentages. Using erythrocyte membrane percentages allowed us to assess the milieu several months leading up to the diagnosis, but the exposure over several years leading up to the adenoma diagnosis likely affected initial development and progression of the precancerous lesion. Another limitation is that our study focused on colorectal polyps. Less than 5 % of adenomatous polyps will progress to cancer regardless these findings should be relevant towards CRC( Reference Strum 69 ).
In conclusion, we found a strong direct association between erythrocyte membrane ARA and an inverse association between erythrocyte membrane DPA percentages and adenoma risk. Our findings lend additional evidence supporting the increased consumption of n-3 LC PUFA and perhaps decreased consumption of ARA for CRC prevention.
Acknowledgements
This work was supported by the National Institute of Health (grant nos CA95103), (W. Z., grant no. CA97386), (H. J. M., grant nos CA143288, CA160938). Surveys and sample collection, processing and preparation for this study were conducted by the Survey and Biospecimen Shared Resource, which is supported in part by the National Institute of Health (grant no. CA068485). Fatty acid analyses were performed by the Vanderbilt Diabetes Research and Training Core Lipid Core lab supported by the National Institute of Health (grant no. DK20593). A portion of the participants were studied as the result of resources and the use of facilities at the VA Tennessee Valley Healthcare System.
S. B. R., M. J. S., Q. C., W. Z. and H. J. M. designed research; Q. C., W. E. S., R. M. N. and L. L. S. conducted research; Q. C. and L. L. S. provided essential reagents or provided essential materials; Q. C., L. L. S., S. B. R., M. J. S. and H. J. M. analysed data or performed statistical analysis; S. B. R., M. J. S. and H. J. M. wrote the paper; and M. J. S., W. Z. and H. J. M. had primary responsibility for final content.
The authors declare that there are no conflicts of interest.


