


The various manifestations of child malnutrition have been consistently demonstrated to exhibit stark social patterning in diverse settings(Reference Fotso and Kuate-Defo1–Reference Van de Poel, Hosseinpoor and Speybroeck4). Typically, in low- and middle-income countries, undernutrition is more common in low-income groups and the phenomenon of child overweight is more prevalent to wealthier households(Reference Martorell, Kettel and Hughes5). Although differential access to food may explain such wealth-based patterning, other factors may be relevant such as parenting skill, family composition or contextual factors, such as access to sanitation and rurality(Reference Ruel and Menon6–Reference Wagstaff, Bustreo and Bryce9). Identifying these drivers is important to inform effective health policy. The issue is particularly pressing since relatively little is known about the drivers of socio-economic inequalities in child malnutrition, in contrast to the situation in adults where determinants of social inequalities in nutritional status are better described(Reference Monteiro, Bustreo and Bryce10).
Adding to the urgency of the task is the phenomenon of the nutrition transition. This refers to the shifting burden of obesity from socio-economically privileged groups to the poor, which has been observed over recent decades in several low- and middle-income countries(Reference McLaren11, Reference Monteiro, Conde and Lu12). In some settings, under- and overnourished individuals exist even in the same household(Reference Popkin13, Reference Uauy, Kain and Mericq14). If the poorest groups in society are to avoid a simultaneous burden of under- and overnutrition, it is essential to advance our understanding of the biological, psychological and socio-economic drivers of childhood malnutrition and the reasons why they increasingly affect poorer households.
The present paper seeks to add to the field by quantifying the contribution of individual-, household- and community-level characteristics to the socio-economic inequalities of malnutrition observed in Colombian children aged 0–17 years. We focus on children and adolescents because nutritional morbidities manifest at this life stage have lifelong physical and socio-economic consequences(Reference Alderman, Hoddinott and Kinsey15–Reference Winicki and Jeminson20). Furthermore, limited evidence is available about the determinants of socio-economic inequalities in nutritional status among this age group. Colombia is a unique setting in which to explore the issue for several reasons. First, both under- and overnutrition are prevalent (national survey data in 2010 reported that 15·9 % of Colombian children <5 years of age had a height-for-age Z-score <−2 and 4·8 % a weight-for-height Z-score >2, using 2006 WHO curves(21)). Second, detailed national household survey data are available and income inequality is stark: the Gini coefficient, a measure of income inequality in which 0 indicates perfect equality and 1 maximal inequality, was 0·587 in 2009, the highest in South America(22). Finally, the nutrition transition appears very much in evidence in Colombia. Comparison of national survey data from 2005 and 2010 suggests that the obesity gradient has already tipped against women in the poorest households(21, 23, Reference Sarmiento, Ramirez and Samper24): among women aged 15–49 years in the lowest national wealth quintile, prevalence increased from 10·8 % to 15·0 % between 2005 and 2010, compared with a marginal increase from 12·0 % to 12·6 % among women in the highest quintile(21, 23).
Methods
Conceptual framework
To the best of our knowledge, a conceptual framework which attempts to map the drivers of simultaneous under- and overnutrition at the community level does not exist. Accordingly, we draw upon separate frameworks to guide our analysis. For undernutrition, we use that proposed by Mosley and Chen(Reference Mosley and Chen25) and for obesity, that proposed by Davison and Birch(Reference Davison and Birch26). Both frameworks understand malnutrition to result from the interplay between proximate, household and community-level factors. Proximate factors include the biological status of mother and child such as parity and specific child-care behaviours such as feeding practices. Household factors include income, household composition and educational attainment, which may be relevant to achieving food security. Community-level factors include access to clean water, sanitation and medical services(Reference Fotso and Kuate-Defo1). Altered nutrient absorption secondary to chronic intestinal infection in poorly sanitized environments is an increasingly recognized cause of poor growth in children(Reference Humphrey27). Similarly, the link between urban settings and childhood obesity is well established, mediated through the adoption of Western diets and decreased opportunities for recreational play(Reference Wang and Lobstein28).
We set out the conceptual framework used in Fig. 1, recognizing the multiple drivers of childhood nutritional status and the complex interplay between them. Our framework embodies the intuitive ordering of determinants proposed by Davison and Birch, sorting them into three natural categories at individual, household and community levels. Our framework also allows determinants to influence each other in a reciprocal manner, as might household wealth and number, age and sex of children, for example. We seek to quantify the extent to which drivers at individual, household and community levels, particularly those which are modifiable, account for socio-economic inequalities in abnormal nutritional status of Colombian children. In so doing, we aim to identify the areas where policy may be most effectively directed to reduce inequality.

Fig. 1 Conceptual framework of potential determinants for child nutritional status
Sampling design and study population
Our analysis used cross-sectional data from the 2005 Colombian Demographic and Health Survey (Encuesta Nacional de Demografía y Salud, ENDS), part of the Colombian Demographic and Health Survey (DHS). The survey applied a multistage, stratified, population-based cluster sampling design. The sample for the current analysis comprised 30 779 children <18 years of age living with their mothers. Additionally, we obtained 2005 census sector identifiers for every household in the sample. Census sectors are areas containing between 120 and 200 households, comparable to census tracts in the USA. Individual data were merged with census sector data to model socio-economic indicators at the community level.
The questionnaire contained both household and individual components and was administered in the home by female interviewers equipped with computer-assisted personal interview technology. Local ethical approval was granted by the Profamilia Institutional Review Board on Research Involving Human Subjects.
Measures
Outcome measurement: stunting and overweight
We measured malnutrition using two dependent variables: (i) stunting (or chronic undernutrition), defined as height-for-age Z-score at least two standard deviations below the median according to the 2006 WHO child growth standards for children aged <5 years(29) and the 2007 WHO reference for children aged 5–17 years(Reference De Onis, Onyango and Borghi30); and (ii) overweight, defined as age- and sex-specific BMI Z-score greater than two standard deviations above the median according to the 2006 WHO child growth standards for children aged <5 years(29) and the 2007 WHO reference for children aged 5–17 years(Reference De Onis, Onyango and Borghi30).
Children's weight and height were measured in households by trained personnel using calibrated equipment. Specifically, weight was measured with digital scales (SECA model 770) adjusted for Colombia's latitude, while height was measured with a portable stadiometer (Shorr Productions).
Independent variables
Household socio-economic status. We used the World Bank's wealth index (WI)(Reference Rutstein and Johnson31) to stratify households by wealth quintiles. WI is a measure of economic status constructed to allow analysis of health equity using DHS data(Reference Barros, Victora and Scherpbier32, Reference O'Donnell, Doorslaer and Wagstaff33). Since DHS does not collect data on income or expenditures, WI uses principal components analysis to take into account a set of assets such as radio, television, refrigerator, car or motorcycle; and household dwelling characteristics such as source of drinking water, quality of flooring or installation of a toilet. WI is a proxy for long-term economic circumstances and allows division of the population into socio-economic groups and identification of the poorest (bottom quintile) and the wealthiest (top quintile) households. While other definitions of socio-economic status exist, such as those based upon occupation or education, the WI is our preferred indicator in the present paper because it captures a rich array of household-level socio-economic and quality-of-life markers and is well validated, widely used and highly correlated with other uni-dimensional indicators such as occupation(Reference Howe, Hargreaves and Gabrysch34–Reference Houweling, Kunst and Mackenbach36).
Individual and household characteristics. Children's individual characteristics included age, sex and birth order. For children <5 years of age, we also included birth weight. Household characteristics included mother's age, mother's BMI, mother's educational attainment (no education, elementary school, secondary school or higher education), number of children in the household, household size, family structure (complete nuclear family, incomplete nuclear family, complete extended family or incomplete extended family), female head of household, whether or not the household head is employed and whether or not the child has health insurance. For children <5 years of age we also included care practices such as breast-feeding for at least 1 month and immunization (whether or not the child has had the required doses of diphtheria–pertussis–tetanus vaccine for his/her age).
Contextual factors. Contextual factors included access to potable water and sanitation and community-level characteristics related to area of residence (urban v. rural), educational attainment (proportion of women and men who had completed high school), community participation (proportion of households that were participating in a community organization), poverty (proportion of households that were poor based on the Index of Unsatisfied Basic Needs, which classifies household as poor if at least one of the following applies: inadequate housing, overcrowding, few adults employed relative to the number of people in the household, children not attending school), employment (proportion of women and men 15–64 years old who were employed) and proportion of female heads of household at the census-sector level.
Statistical analysis
We conducted the analysis separately for pre-school children (<5 years of age) and children and adolescents aged 5–17 years because there were specific variables related to health and health-care practices that were measured only among pre-schoolers. Furthermore, pre-school children in Colombia receive targeted national nutrition and welfare programmes.
Initially, we estimated weighted prevalences of stunting and overweight by wealth quintile stratified by age group and estimated differences between wealth quintiles. Next, given the clustering of children within households and households within census sectors, and to allow the estimation of prevalence ratios, we conducted multilevel Poisson models using the statistical software package STATA version 11 (program ‘gllamm’). For each dichotomous outcome (stunting v. non-stunting or overweight v. non-overweight), we estimated three-level models. Level 1 models account for individual children; level 2 for children nested into households; and level 3 for households nested into census sectors. All models assumed a random intercept. In the first (unadjusted) model, we included a dummy variable for each of the wealth quintiles, with the richest group being the referent category.
Then, to explore the contribution of individual-, household- and community-level characteristics to inequalities in child malnutrition, we aggregated the following vectors of variables into the model sequentially (models 2, 3 and 4): child's health and demographic characteristics; mother's and household's characteristics (and care practices for children <5 years of age); and contextual characteristics which include access to services and community-level characteristics. To determine each vector's contribution in explaining malnutrition inequalities, we compared the relative change in prevalence ratios on the poorest WI quintile indicator (relative to the richest quintile) between models (as we added each vector or characteristic), according to the following expression:
 $$ \frac{{{{W}_i}{\rm{ - }}{{W}_{i{\rm{ - }}1}}}}{{{{W}_i}}}\:\times \:100\eqno\rm $$
where Wi is the estimated prevalence ratio (PR) on the poorest WI quintile indicator (relative to the richest quintile) from model i and Wi −1 is the PR estimate from the model i−1.
Results
Descriptive statistics by age group for the full sample (see Table 1) indicated that children <5 years of age had younger and better educated mothers than children and adolescents aged 5–17 years, had fewer siblings and were more likely to live in a complete extended family. The double burden of malnutrition was observable for both age groups. Thirteen per cent of children and adolescents were stunted (in both age groups); while 25 % of those <5 years of age and 14 % of those aged 5–17 years were overweight.
Table 1 Descriptive statistics on individual, household and contextual characteristics of Colombian children and adolescents, 2005 Colombian Demographic and Health Survey

DPT, diphtheria–pertussis–tetanus; IUBN, Index of Unsatisfied Basic Needs.
*Unweighted sample size.
†Comparison between children <5 years of age and children and adolescents aged 5–17 years (Pearson's χ 2 test for categorical variables; t test of difference between means for continuous variables).
‡At the census-sector level.
§Height-for-age Z-score <−2 (according to 2006 WHO child growth standards for children aged <5 years(29) and 2007 WHO reference for children aged 5–17 years(Reference De Onis, Onyango and Borghi30)).
∥Age- and sex-specific BMI Z-score >2 (according to 2006 WHO child growth standards for children aged <5 years(29) and 2007 WHO reference for children aged 5–17 years(Reference De Onis, Onyango and Borghi30)).
Socio-economic inequalities in childhood malnutrition
Socio-economic inequalities in malnutrition were observable for both age groups, although they operated differently depending on outcome. In the poorest quintile, the prevalence of stunting was 21·8 % among children <5 years of age and 25·9 % among children and adolescents aged 5–17 years. In contrast, in the richest quintile, 4·5 % of children <5 years of age and 5·6 % of children and adolescents aged 5–17 years were stunted (Fig. 2a). The prevalence of overweight for children <5 years of age was 23·7 % and 29·0 % in the poorest and richest quintiles, respectively. Among children and adolescents aged 5–17 years, differences in overweight were more marked: 7·5 % in the poorest quintile and 21·5 % in the richest quintile (Fig. 2b).
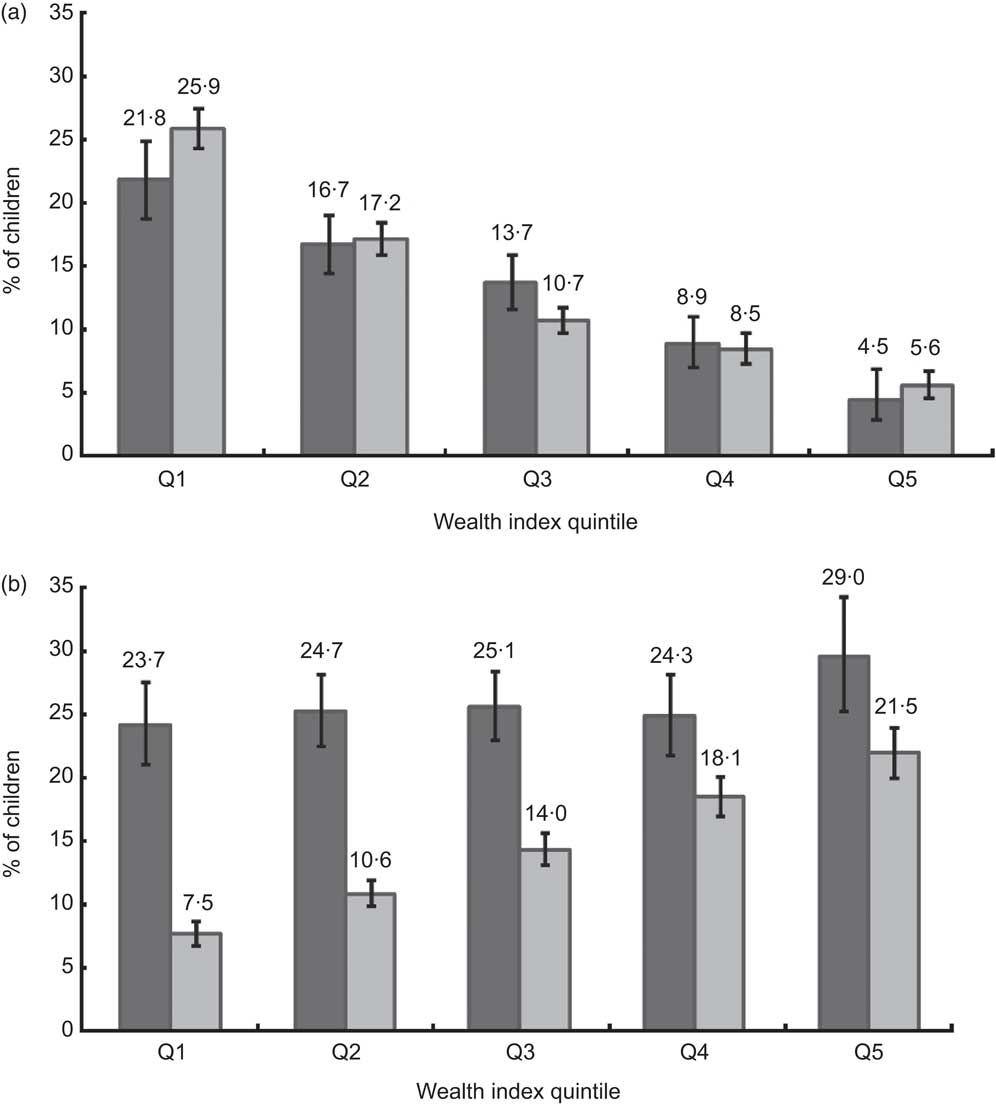
Fig. 2 Percentage of (a) stunting and (b) overweight by quintile of wealth index (Q1, poorest; Q5; richest) and age group ( $$$$, children <5 years of age;
  $$$$, children and adolescents aged 5–17 years), 2005 Colombian Demographic and Health Survey. Stunting = height-for-age Z-score <–2 and overweight = age- and sex-specific BMI Z-score >2 (according to 2006 WHO child growth standards for children aged <5 years(29) and 2007 WHO reference for children aged 5–17 years(Reference De Onis, Onyango and Borghi30))
Children in the poorest quintile were about five times more likely than children in the richest quintile to be stunted (unadjusted PR = 5·11, 95 % CI 3·45, 7·58 for children <5 years of age; unadjusted PR = 4·72, 95 % CI 3·94, 5·65 for children and adolescents aged 5–17 years; Tables 2 and 3). Among children <5 years old, estimated inequalities in stunting were larger for girls than for boys, although the difference was not statistically significant (PR = 4·20, 95 % CI 2·63, 6·71 for boys and PR = 7·58, 95 % CI 3·70, 15·54 for girls).
Table 2 Hierarchical three-level Poisson regression models predicting stunting of children <5 years of age, 2005 Colombian Demographic and Health Survey
PR, prevalence ratio; Ref., referent category.
All estimates are conditional on random effects.
*At the census-sector level.
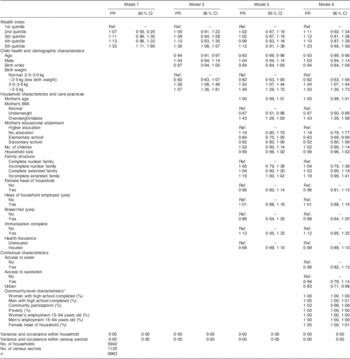
Table 3 Hierarchical three-level Poisson regression models predicting stunting of children and adolescents aged 5–17 years, 2005 Colombian Demographic and Health Survey
PR, prevalence ratio, Ref., referent category.
All estimates are conditional on random effects.
*At the census-sector level.
Socio-economic differences for overweight were also significant, but against children in the richest quintile. The largest difference was observable for children and adolescents aged 5–17 years, with those belonging to the richest quintile being close to three times more likely to be overweight than those in the poorest quintile (unadjusted PR = 2·77, 95 % CI 2·43, 3·16; Tables 4 and 5). Among children and adolescents aged 5–17 years, inequalities were larger for boys than for girls (PR = 3·72, 95 % CI 3·08, 4·50 for boys and PR = 2·07, 95 % CI 1·75, 2·46 for girls).
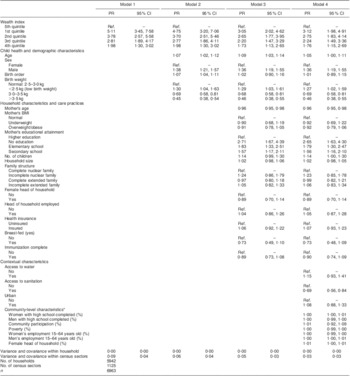
Table 4 Hierarchical three-level Poisson regression models predicting overweight of children <5 years of age, 2005 Colombian Demographic and Health Survey
PR, prevalence ratio; Ref., referent category.
All estimates are conditional on random effects.
*At the census-sector level.
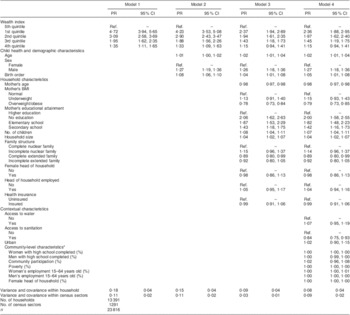
Table 5 Hierarchical three-level Poisson regression models predicting overweight of children and adolescents aged 5–17 years, 2005 Colombian Demographic and Health Survey

PR, prevalence ratio; Ref., referent category.
All estimates are conditional on random effects.
*At the census-sector level.
Determinants of socio-economic inequalities in childhood stunting
Over one-third (36 %) of the disparity in stunting between the poorest and richest quintile for children <5 years of age was explained by mother's education and care practices (Model 3, Table 2). Contextual characteristics did not further account for the socio-economic inequality in stunting (Model 4). However, when we added access to services alone (without community-level characteristics) to Model 3, access to water and sanitation explained an additional 14 % of the difference in stunting between children in the poorest and the riches quintiles.
For school-aged children and adolescents, 44 % of the inequality in stunting was explained by mother's education, mother's BMI and household characteristics. In contrast to the findings for children <5 years old, access to basic public utilities explained very little (an additional 6 %) of the WI difference observed for children and adolescents aged 5–17 years once household characteristics and mother's education were controlled for. Community-level characteristics did not further explain inequalities for stunting (Table 3).
The multivariate results revealed a strong association between stunting and mother's education for both age groups. As expected, children whose mothers had low educational attainment were more likely to be stunted. Also, access to sanitation was significantly associated with a lower prevalence of stunting (PR = 0·69, 95 % CI 0·56, 0·84 for children <5 years of age and PR = 0·84, 95 % CI 0·75, 0·93 for children and adolescents aged 5–17 years). For both age groups, a strong association between poverty and stunting remained after controlling for place of residence, suggesting that living in an urban area is not necessarily a protective factor against undernutrition.
Determinants of socio-economic inequalities in childhood overweight
Only 14 % of the socio-economic disparity in overweight for children <5 years of age (Table 4) and close to one-third (32 %) of the disparity in overweight among children and adolescents aged 5–17 years were explained by maternal and household characteristics (Table 5). Children with mothers who were overweight or obese were significantly more likely to be overweight (PR = 1·43, 95 % CI 1·29, 1·58 for children <5 years old and PR = 2·17, 95 % CI 2·00, 2·34 for children and adolescents aged 5–17 years). Although community-level characteristics did not provide further explanation of socio-economic differences in overweight, it is important to note that the percentage of female heads of household at census-sector level was positively associated with overweight for children <5 years of age. Also, once individual and household characteristics were controlled for, there was a negative marginal association between community participation and overweight in children and adolescents aged 5–17 years (PR = 0·92, 95 % CI 0·85, 1·01), suggesting that this contextual variable could be a protective factor for overweight or among this age group (Table 5).
Discussion
Main result
Analysis of 2005 national survey data in Colombian children and adolescents aged 0–17 years shows that marked social inequalities coexist in the prevalence of undernutrition (against poorer children) and overnutrition (against more privileged children). Children in the poorest households experience significant rates of under- and overnutrition. Household factors and access to services account for a greater proportion of the differences observed than community-level characteristics. In particular, mother's education and household sanitation in the case of stunting and mother's BMI in the case of overweight account for a substantial portion of observed inequalities.
Generalizability and comparison with other studies
Colombia occupies a mid-table position regarding Human Development Index (79th in 2010) and per capita Gross Domestic Product ($US 8959, 2010 estimate). Hence, despite the socio-political context of each country being unique, our findings are likely to be pertinent to several countries at a similar stage of development and with a double burden of stunting and overweight at the community level.
The positive association between economic status and overweight is consistent with other studies from pre-schoolers in developing countries(Reference Martorell, Kettel and Hughes5) and from adult populations in middle-income countries(Reference Monteiro, Bustreo and Bryce10, Reference McLaren11). The negative association between economic status and stunting is also consistent with previous findings for children <5 years of age in Asia, Latin America and Africa(Reference Fotso and Kuate-Defo1, Reference Menon, Ruel and Morris2, Reference Kennedy, Nantel and Brouwer37) and among pregnant women in Colombia(Reference Sarmiento, Ramirez and Samper24). In agreement with Menon et al.(Reference Menon, Ruel and Morris2) we found that inequalities in malnutrition were significant both in urban and rural areas. Likewise, McDonald et al. reported similar rates of stunting and overweight in children aged 5–12 years in Bogotá, as well as a positive association with socio-economic status and maternal BMI in the case of overweight(Reference McDonald, Baylin and Arsenault38). Although their study benefits from data on dietary patterns, community-level characteristics were not included and household characteristics were limited to maternal education, household asset ownership and socio-economic stratum.
The association between household characteristics and care practices and malnutrition inequalities is consistent with previous research. In the case of stunting, Ruel et al.(Reference Ruel, Levin and Armar-Klemesu39) found that most of the difference in chronic stunting between low- and high-income pre-schoolers was associated with differences in caring practices. Likewise, Smith et al.(Reference Smith, Ruel and Ndiaye7) demonstrated that access to sanitation was strongly associated with nutritional status both in urban and rural settings.
The association between maternal education and stunting should be interpreted with caution. Children of low educated mothers may be stunted more often because poorly educated mothers have worse health behaviours, worse care practices or worse living conditions than more educated mothers. Each reason is potentially modifiable by appropriate policy. Alternatively, such children's stunting may reflect limited intra-uterine growth, and thus be determined by their mother's environment during her pregnancy, her childhood or even her own intra-uterine phase(Reference Cole40). Such intergenerational transmission of height is not amenable to policy intervention – at least not in the short term.
Strengths and weaknesses
To our knowledge, the present study is the first one to examine the extent to which factors at the individual, household and community levels account for malnutrition inequalities in both children and adolescents. The study benefits from robustly collected data in a large sample covering a wide range of socio-economic data, in addition to the core anthropometrics. The survey methodology has been replicated elsewhere, allowing comparison with other countries or other survey dates in Colombia in subsequent studies. Also, a rich set of variables was used at the individual, household and contextual levels in order to explain malnutrition inequalities.
Although we have been able to assess some of the factors underlying wealth-related nutritional inequalities, it is not possible to make causal inferences from cross-sectional data. In addition, our study lacked data on other likely determinants of childhood nutritional status such as dietary patterns and community recreational space. Nevertheless, our findings suggest several novel hypotheses which could be explored in subsequent cohort or interventional studies, such as whether promoting community participation or better support for female heads of household could reduce the prevalence of childhood overweight.
Meaning of the study
Our findings suggest several opportunities both for identification of children at risk of malnutrition and for intervention. Specifically, children from poorer households or with poorly educated mothers are at higher risk of stunting, and children from wealthier households or with overweight mothers are at higher risk of overweight. For both outcomes, it would appear that focusing attention on household factors may be the most promising route initially to reduce the burden of stunting or overweight and associated inequalities, since it is here that the greatest explanatory power lies.
Regarding childhood stunting, boosting household incomes, increasing access to potable water and sanitation and supporting community participation may offer effective means to protect against this outcome and reduce inequalities. These actions are needed both in urban and rural areas as we have shown that poor children are not necessarily protected from stunting if living in an urban area.
Regarding childhood overweight, Davison and Birch(Reference Davison and Birch26) describe a ‘cyclical relationship’ between parental weight status, parenting/feeding practices and children's nutritional status. In early stages of the nutrition transition, high-income individuals are more likely to have diets rich in meat, fat and sugars(Reference Monteiro, Conde and Lu12). Thus, one possible explanation for the association between mother's BMI and inequalities in overweight is that children living in richer households have parents with caring practices and eating behaviours that promote more energy intake and more sedentary behaviours than those living in poor households. However, being poor or living in rural areas is not necessarily a protective factor for overweight(Reference Forde, Chandola and Garcia41). This finding poses a particular challenge for policy makers, who must eradicate hunger and undernutrition among the poor while preventing the emergence of overweight with all its health consequences in terms of chronic diseases.
Close attention to these social determinants may allow Colombia and other countries at a similar stage of development to tackle the problem of childhood undernutrition effectively without increasing rates of overnutrition, particularly among disadvantaged children where the risk of a double burden of malnutrition and exacerbation of health inequalities is high.
Acknowledgements
Source of funding: The Demographic and Health Survey of Colombia 2005 was funded by the US Agency for International Development (USAID), the United Nations Population Fund (UNFPA), the Colombian Institute of Family Welfare (ICBF) and Colombia's Ministry of Health and Social Protection. The present study was supported by a research grant from Universidad de los Andes. Conflicts of interest: There no conflicts of interest, financial or of any other kind, for the authors of this paper. Authors’ contributions: S.G. and O.L.S. planned the paper and wrote the first draft. I.F. reviewed the paper and contributed to the final version, particularly the interpretation and discussion of results. T.V. contributed to data analysis as well as to the final version of the paper.


