


1. Introduction
We collected primary data on mental health, COVID-19-related health and economic concerns, time allocation to market and household production, protective behaviors and donations via an online survey of 1,500 Prolific respondents in the UK to study gender differences in COVID-19 times. Conditional on participating in our survey, respondents were chosen to be representative of the UK population by age, sex, and ethnicity. The data were collected on 19 June 2020, during the first minor easing of the first lockdown in the UK. The main findings of our study can be grouped into six blocks.
First, women's mental health in mid-June was worse than men along several dimensions: generalized anxiety disorder 7-item scale (GAD-7), depression, panic attacks, and loneliness. The relative gender gaps (% higher than men) in mental health problems were sizeable, going from 81% in having experienced an anxiety attack to 22% in feeling depressed. Although not directly comparable, Banks and Xu (Reference Banks and Xu2020) show that women's mental health status in the UK in April 2020, as measured by changes in the General Health Questionnaire 12-item scale (GHQ-12) in the UK Household Longitudinal Study (UKHLS), deteriorated relative to that of men comparing pre-COVID-19 pandemic and during-COVID-19 pandemic data, and the magnitude was pretty large.Footnote 1 Using the same dataset and measure, Davillas and Jones (Reference Davillas and Jones2020) document that age and gender account for the largest share in explaining GHQ-12 differences in the COVID-19 period.
Second, women exhibited more concerns about getting and spreading the virus (12% and 8% higher than men, respectively), consistent with Galasso et al. (Reference Galasso, Pons, Profeta, Becher, Brouard and Foucault2020) who found that women were more likely to see COVID-19 as a serious health problem. Moreover, we find that women perceived the virus as more prevalent and lethal than men did (31% and 39% higher than men, respectively). This is interesting because, on one hand, women make up more than half of the infected individuals in European countries [Lewandowski et al. (Reference Lewandowski, Lipowska and Mgda2020)], and where women participate more fully in the labor market, they might be more susceptible to COVID-19 than men [Adams (Reference Adams2020)]. On the other hand, mortality rates from COVID-19 are higher for men than women [SAGE (2020), Yanez et al. (Reference Yanez, Weiss, Romand and Treggiari2020)].
Third, women's expectations of a new lockdown or virus outbreak by the end of 2020 were 0.18–0.20 standard deviations (SD) higher than those of men. Women were more pessimistic about the contemporaneous and future state of the UK economy, consistently predicting a higher unemployment rate in June 2020, December 2020, and June 2021. In particular, women's forecasted unemployment in June 2021 was 15% (0.24 SD) higher than that for men. These disparities do not appear to be driven by misunderstandings of what the unemployment rate is or different levels of attention to the survey by gender.Footnote 2
Fourth, between earlier in 2020 before the outbreak of the Coronavirus pandemic and June 2020, women had increased their weekly time allocated to both childcare, between 3.4 and 3.9 h, and housework, between 2.3 and 2.8 h, consistent with previous research [Andrew et al. (Reference Andrew, Cattan, Costa Dias, Farquharson, Kraftman, Krutikova, Phimister and Sevilla2020), Hupkau and Petrongolo (Reference Hupkau and Petrongolo2020), Sevilla and Smith (Reference Sevilla and Smith2020)].Footnote 3 We do not find statistically significant gender gaps in the changes in hours of work and the incidence of job loss or furloughing, consistent with the findings in Hupkau and Petrongolo (Reference Hupkau and Petrongolo2020) using UKHLS data, although our estimated gaps are somewhat similar in size to those reported by Adams-Prassl et al. (Reference Adams-Prassl, Boneva, Golin and Rauh2020b, Reference Adams-Prassl, Boneva, Golin and Rauh2020c) using real-time surveys.
Fifth, the COVID-19 pandemic is likely to affect people's donations because of both (a) changes in government policy and (b) changes in uncertainty about future health/economic outcomes (Scharf, Reference Scharf2020). In this regard, we find that women donated to food banks 5 out of 50 pence (31% or 0.31 SD) more than men.
Finally, neither the gender gaps in COVID-19-related health and economic concerns nor the gender gaps in the increase in hours of childcare and housework can be accounted for by a rich set of control variables including number of children living in the house (by age category), number of “seniors” living in the house (individuals aged 60 or plus), full-time job indicator, healthcare worker indicator, and employment shocks (having being furloughed due to the coronavirus pandemic, having suffered a job loss due to coronavirus pandemic). Instead, we find that the gender gap in mental health can be partially accounted for by the gap in COVID-19-related health concerns between men and women, but not by differences in economic concerns due to the pandemic.
Our empirical analysis provides a dramatic picture within 3 months after the beginning of the COVID-19 pandemic. The gender dimension of COVID-19 should be on the radar of policy-makers, and join Adams (Reference Adams2020), Alon et al. (Reference Alon, Doepke, Olmstead-Rumsey and Tertilt2020), Hupkau and Petrongolo (Reference Hupkau and Petrongolo2020) and Lewandowski et al. (Reference Lewandowski, Lipowska and Mgda2020), amongst others, to call for more COVID-19 gender-related research and policy analysis. Women represent half of the population, they are key to family structure and early human capital accumulation, and they are more vulnerable to domestic violence, poverty, and single parenthood. The gender gaps after 3 months of the first lockdown that we document in this paper are worrisome for the UK economy and deserve further scrutiny.
The next section provides a description of how we obtained our primary data, how it compares to a nationally representative dataset, and the main characteristics of our respondents. Section 3 describes our methodology. Section 4 presents and discusses our estimated unadjusted and adjusted gender gaps. Section 5 investigates additional factors that may explain the adjusted gaps. Section 6 concludes.
2. Data description
2.1. Collected dataset: BIDCOFU survey
We collected a sample of approximately 1,500 UK respondents in Prolific, an online platform that connects researchers with participants, who get paid cash for taking part in the research.Footnote 4 Conditional on participating in our survey, the sample is representative of the UK population with regards to age, sex and ethnicity.Footnote 5
We launched our survey on 19 June 2020, at 10:40 am (GMT + 1). The survey was announced with the title “BIDCOFU Survey” and the following brief summary:
This study is conducted by researchers from the University of Exeter. Participants will be asked to answer a set of questions on demographic patterns. This includes questions that may be sensitive, including but not limited to questions related to Coronavirus.
When restricting the attention to representative samples, the maximum number of respondents that Prolific can provide in a given day is approximately 1,500, and this was our targeted sample size. In practice, we ended up collecting data on 1,503 respondents. After dropping observations whose gender did not match the one provided by Prolific (7), whose age was older or at least 2 years younger than that provided by Prolific (33), or whose answers to their geographical location of residence (asked twice in the survey) differed (4), our maximum sample size becomes 1,461 (757 women, 704 men). Due to connectivity and/or logistic reasons, 3 respondents could not complete the survey. This means that for some questions located towards the end of the survey we have responses for 1,458 respondents. We also note that some variables have a smaller number of observations because they are based on questions asked conditional on the answer to previous questions.Footnote 6 The questionnaire, data, and replication files are available online.Footnote 7 A full description of the main variables used in this article is available in Supplementary Material Appendix A.
2.2. Comparison with other datasets: BIDCOFU vs. UKHLS Covid-19 study
Table B1 in Supplementary Material Appendix B compares the average characteristics of our respondents (N = 1,461) in our June 2020 survey (BIDCOFU) against those of the respondents (N = 14,021) in the June 2020 Covid-19 study (UKHLS), which provides a large and representative sample of the UK population, and is available from the UK data service.Footnote 8
The fraction of women is essentially the same in both samples, 0.52 in our sample compared with 0.53 in the UKHLS sample. The fraction of white individuals is about 5 percentage points (pp) smaller in BIDCOFU than in the UKHLS (0.86 vs. 0.91, p-value < 0.01). The age distributions across datasets are different: the fraction of individuals 65 and plus is 10 pp smaller in our sample compared to the nationally representative sample (0.14 vs. 0.25, p-value < 0.01). In terms of geographical location, the distribution of respondents is quite similar across both datasets, the largest difference being in London, reflecting both the age and ethnicity differences across samples.
Exploring household characteristics, we find small differences in terms of household size (2.6 in BIDOCFU vs. 2.8 in UKHLS) and the fraction of individuals living with a partner (0.64 vs. 0.62), and no differences in the fraction of individuals with children in the household (0.28 vs. 0.27).
Regarding time allocation in the labor market and housework, we find that the fraction of employed individuals in our sample is 3 pp larger than that in the UKHLS dataset (0.63 vs. 0.60, p-value < 0.05), reflecting the differences in the age distributions across datasets. The average number of weekly hours of work is 22.8 in BIDCOFU and 26.5 in the UKHLS dataset, a gap of 3.7 h (p-value < 0.01). Regarding childcare and housework, we find that the average time allocated to childcare activities per week is 10.4 h in our sample vs. 13.0 h in the UKHLS sample (p-value < 0.01), and the average time allocated to housework per week is 24.9 h in our sample vs. 11.6 h in the UKHLS sample (p-value < 0.01).Footnote 9
Finally, regarding loneliness, which was asked in exactly the same way in both surveys, it appears that our BIDCOFU respondents report to feel lonely more often than the respondents in the June Covid-19 study, the former being 5.8 pp more likely to report feeling lonely some of the time or often than the latter (p-value < 0.01).
2.3. Average characteristics of BIDCOFU respondents
Table B2 in Supplementary Material Appendix B summarizes the main sociodemographic and economic characteristics of our sample by gender. Men and women are similar along several dimensions: there are no gender gaps in the fraction of non-white individuals in the sample, in the distribution of age groups, in the distribution of the geographic location of residence, in the fraction living in urban areas, or in the distribution of educational categories.Footnote 10
No differences are observed regarding household composition, in terms of living with a partner or with others (any other person in the household but the respondent), but remarkable gender gaps appear when focusing on employment status and the income distribution. Of the total, 44.6% of men are employed working from home, while this figure is 5.6 percentage points lower for women, 39% (p-value = 0.029). Also, 33% of women are not in the labor force, while this percentage is 10 pp lower for men, 23% (p-value = 0.000). These June monthly figures compared with 27.9% for women and 20.9% for men based on the quarterly employment rates from June to August 2020 [Office for National Statistics, ONS (2020a)].
Finally, the fraction of women with the lowest income category (Less than £15,000) is 32% while among men is 19% (p-value = 0.000), and the fraction of women with income between £45,000 and £49,999 is 7% while among men is 14% (p-value = 0.000). The average income in 2019 is £30,049 among men and £27,031 among women, an average income gap of £3,018 (p-value = 0.000).Footnote 11 This 10% gender gap in total income before tax in 2019 compares with the gender pay gap among all employees of 17.4% [ONS (2020b)].
3. Methodology: short vs. long regressions
We compute unadjusted (b S) and adjusted (b L) average gender gaps, obtained from estimating “short” and “long” linear regressions by means of ordinary least squares. The “short” regression is given by:

where y i is the outcome for respondent i, F i is a female indicator ( = 1 if respondent i is female, = 0 if respondent i is male), and $e_i^S$ is the regression residual of this “short” regression. The “long” regression is given by:

where X i is a vector of standard sociodemographic control variables (age, ethnicity, education, family structure, income in 2019, current employment status, place of residence and rural-urban area) and $e_i^L$ is the regression residual of this “long” regression.Footnote 12 We report estimates of the absolute gender gap b S (resp. b L) and the relative gender gap, defined as b S (resp. b L) divided by the mean of y i among men in %, and the robust to heteroskedasticity p-values for both b S and b L, which contain information against the null hypothesis of no gender gap (b S = 0 and b L = 0, respectively). We discuss both statistical significance and economic relevance.
4. Unadjusted vs. adjusted gender gaps
Before diving into the main results of our paper, we briefly report that we also investigated average gender differences in the degree of patienceFootnote 13, duration in minutes (to complete the survey), attention to the survey questionsFootnote 14, and participation in Coronavirus-related surveys so far. There is no gender gap in the average degree of patience (1.6%, p-value = 0.225), average duration (−1.2%, p-value = 0.734), and attention to the survey (−0.7%, p-value = 0.521). However, women appear to have completed on average about 1 fewer Coronavirus-related studies than men (11%, p-value = 0.007). We have also investigated whether there were gender differences about the perception of how the UK government handled the UK Coronavirus crisis and the Brexit negotiations, failing to find any (results available upon request). Thus, it does not appear that women had more negative views than men in general. All of these differences are essentially the same, in sign and magnitude, after adjusting for control variables.
4.1. Wellbeing: mental and physical health
This subsection focuses on mental and physical wellbeing. In Table 1, we investigate gender gaps in mental health measures—GAD-7,Footnote 15 depression indicator based on item two of the PHQ-9,Footnote 16 anxiety/panic attack indicatorFootnote 17—and a loneliness indicator.Footnote 18 Women reported worse levels of mental health in the last 2 weeks than men and a higher degree of loneliness in the last 4 weeks.
Table 1. Mental health and wellbeing
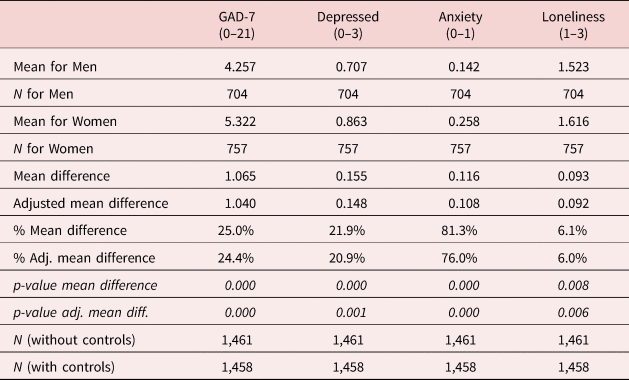
Note: p-values robust to heteroscedasticity. Difference is computed as the coefficient on a female indicator on a regression of the outcome on each column against a female indicator and a constant. Adjusted difference is computed in the same way after including the following control variables: ethnicity indicator (1 if non-white, 0 if white), age indicators, education indicators, couple indicator, living with others indicator, log of income in 2019, employment status indicators, rural/urban indicator, geographical location of residence indicators.
First, women's GAD-7 (0–21) average anxiety score was 5.32, 1.07 units above (or 25% higher than) that of men. The GAD-7 gap in SD is 0.22, which compares with a gap of approximately 0.28 SD in the GHQ-12Footnote 19 among respondents to the June wave of the Covid-19 study (UKHLS).Footnote 20 Second, the average female indicator on feeling down, depressed or hopeless (0–3)—from 0 (not at all) to 3 (nearly every day)—was 0.86, 0.16 units (0.19 SD) above (or 22% higher than) that of males. Third, 25.8% of women reported having had an anxiety attack (suddenly feeling fear or panic), while this percentage decreases to 14.2% among men. Hence, women were 11.6 pp (81%) more likely than men to have had an anxiety attack. Last but not least, women also seem to feel lonely more frequently than men, scoring 0.09 units (0.14 SD) above (or 6% higher than) that of men in the loneliness indicator (1–3). If anything, this difference is smaller than the 0.17 units gender gap based on the June wave of the Covid-19 study (UKHLS): 1.57 (among women) vs. 1.40 (among men), p-value < 0.001.
The GAD-7 appears to be highly reliable as judged by its Cronbach's alpha, which is 0.92. Its validity, as measured by its Pearson correlation coefficients with the other indicators in Table 1, is high as well. The correlation coefficient between the GAD-7 and the depression indicator (item 2 of the PHQ-9) is 0.75 (p-value = 0.000), between the GAD-7 and the anxiety indicator is 0.54 (p-value = 0.000), and between the GAD-7 and the loneliness indicator is 0.47 (p-value = 0.000).
The gender gaps are robust to adjusting for standard sociodemographic control variables: ethnicity, age, education, living with a partner, living with others, log of income in 2019, current employment status, living in a rural/urban area, and geographical location of residence.
In Table B3 in Supplementary Material Appendix B we investigate gender gaps in physical health—e.g., self-reported health status, underlying health condition—and health-related behaviors—e.g., smoking, flu vaccine. Three statistically significant and sizeable differences, which are robust to adjusting for standard sociodemographic characteristics, stand out, regarding obesity, drinking alcohol, and going out.
First, women's obesity rate was estimated at 26.3%, while the one for men at 18.8%, so that women were 7.5 pp (40%) more likely than men to be obese (body mass index ⩾30). While the figure for women is 2.7 pp below to the 29% figure from the Health Survey for England (HSE) 2018, the one for men is more than 10 pp below the 26% figure from the HSE 2018 [HSE (2020)]. Part of this discrepancy might be explained by reporting issues.Footnote 21
Second, women were 5 pp (19%) less likely than men to drink alcohol: 31.7% of women reported not drinking alcohol compared with 26.6% of men. This 5.1 pp gap compares with a 4.5 pp gap based on 2017 data from the Opinions and Lifestyle Survey [ONS (2018)], where the fraction of women reporting being teetotal was 22.6% while that of men was 18.1%.
Third, women were 10 pp (31%) more likely than men to have not gone out of their home the day before the survey: 42% of women compared with 32% of men.
We do not find statistically significant or economically important gender differences in the average self-reported health status (1 if good or very good, 0 otherwise), in the prevalence of chronic conditions, in having had the flu vaccine this season, or in having had fever or cough in the last days. Women were 4 pp (26%) less likely than men to smoke (similar to the 3.4 pp gap based on 2019 data from the ONS (2020c) using the Annual Population Survey), but the difference is not statistically significant at the 5% level after adjusting for control variables.
4.2. Expectations about COVID-19: health risks and economic concerns
In this subsection, we investigate gender gaps in perceptions, concerns, and expectations regarding health risks and economic concerns related to COVID-19. Table 2 focuses on COVID-19-related health concerns and risks (e.g., concerns on getting infected, risk of being positive) and shows that women were more concerned and had more negative perceptions about COVID-19-health-related risks than men.
Table 2. COVID-19-related health concerns and risks
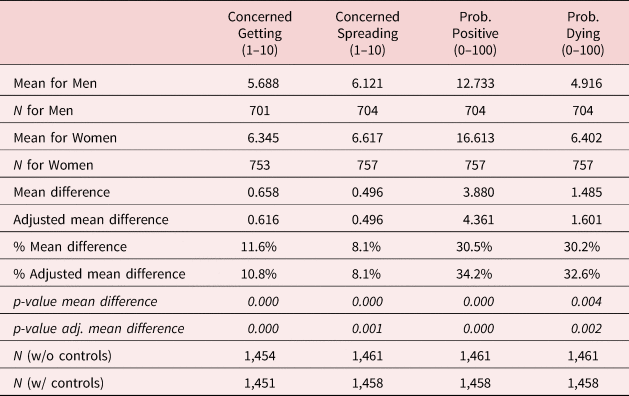
Note: p-values robust to heteroscedasticity. Difference is computed as the coefficient on a female indicator on a regression of the outcome on each column against a female indicator and a constant. Adjusted difference is computed in the same way after including the following control variables: ethnicity indicator (1 if non-white, 0 if white), age indicators, education indicators, couple indicator, living with others indicator, log of income in 2019, employment status indicators, rural/urban indicator, geographical location of residence indicators.
First, women were more concerned of getting coronavirus than men, scoring 0.6 units (0.26 SD) above (or 12% higher than) men in the indicator of being concerned about getting coronavirus (1–10). Second, women were more concerned of spreading coronavirus than men, scoring 0.5 units (0.19 SD) above (or 8% higher than) men in the indicator of being concerned about spreading coronavirus (1–10). Third, women's perceived coronavirus prevalence was about 4 pp (0.22 SD or 31%) higher than that of men. Finally, women's perceived Coronavirus lethality was about 1.5 pp (0.15 SD or 39%) higher than that of men.
In Table 3 we shift our attention to COVID-19-related economics concerns. In particular, we focus on the gender differences in expectations on a new lockdown being necessary before the end of 2020, on another Coronavirus outbreak before the end of 2020, and unemployment rate forecasts. We find that the average level of agreement that a new lockdown would be necessary before the end of 2020 was larger among women than men. Female's average agreement score was 2.95 on a scale of 1 to 4, while the male's one was 2.81. This is a difference of 0.14 units (0.18 SD) or 4.8%. Indeed, there was the second lockdown in the UK from 5 November to 2 December 2020.Footnote 22
Table 3. COVID-19-related economic concerns and risks

Note: p-values robust to heteroscedasticity. Difference is computed as the coefficient on a female indicator on a regression of the outcome on each column against a female indicator and a constant. Adjusted difference is computed in the same way after including the following control variables: ethnicity indicator (1 if non-white, 0 if white), age indicators, education indicators, couple indicator, living with others indicator, log of income in 2019, employment status indicators, rural/urban indicator, geographical location of residence indicators.
Women were also more likely to think that there would be another Coronavirus outbreak before the end of 2020. Female's average agreement score was 3.14 on a scale of 1 to 4, while the male's one was 3.0. This is a difference of 0.14 units (0.20 SD) or 4.6%. Once again, there was a peak in the number of people tested positive on 12 November [Public Health England, PHE (2020a)], while the number of deaths is still rising [PHE (2020b)].
Regarding economic prospects, women's perceptions were also more negative than those of men. Women's forecasted unemployment rates for June 2020, December 2020, and June 2021 were 0.5, 0.9, and 1.1 percentage points (0.13 SD or 0.8%, 0.20 SD or 10%, 0.24 SD or 15%) larger than those forecasted by men.Footnote 23 Note that the official estimates of the UK unemployment rate were 4.1% for April–June and 4.8% for July–September [ONS (2020d)].
Our survey questions on concerns and perceptions were inspired by Fetzer et al. (Reference Fetzer, Hensel, Hermle and Roth2020). While these authors show that the evolution of beliefs about the severity of the crisis and economic worries does not vary by gender, they do not investigate gender gaps in participants' beliefs about either Coronavirus mortality or its contagiousness.
Finally, we note that the difference in the expectation about the COVID-19 vaccine being found in a year or never was 3 percentage points and not statistically significant.
4.3. COVID-19 and time allocation: labor market and household tasks
In this subsection, we focus on time allocation in the labor market and the household. Before analyzing the allocation of time in the labor market, it is important to understand what are (if any) the gender gaps in employment and job characteristics.
4.3.1. COVID-19, employment and job characteristics
Table B4 in Supplementary Material Appendix B displays gender gaps in employment and job characteristics, focusing on individuals aged 18–64 who reported being employed in January–February 2020 following Hupkau and Petrongolo (Reference Hupkau and Petrongolo2020).Footnote 24
Several important features are worth emphasizing in Table B4, first regarding the direct impact of the COVID-19 pandemic, and second regarding the type of sector and job characteristics. In total, 9.5% of women reported having lost their job because of the Coronavirus pandemic, while the figure for men is 4.1%. Thus, women were about 5.4 percentage points (133%) more likely than men to have lost their jobs because of the Coronavirus pandemic. Using UKHLS data from April to May 2020, Hupkau and Petrongolo (Reference Hupkau and Petrongolo2020) report that 4.4% of men and 4.1% of women have ever lost their job since January–February 2020. Thus, they do not find differences between men and women. However, once we control for sociodemographic characteristics, the gap decreases to 2.1 pp, similar to Adams-Prassl et al. (Reference Adams-Prassl, Boneva, Golin and Rauh2020b), and it is not statistically significant.
Table B4 also shows that 22.3% of men compared with 27.6% of women reported having been furloughed under the Coronavirus Job Retention Scheme because of the Coronavirus pandemic.Footnote 25 Hupkau and Petrongolo (Reference Hupkau and Petrongolo2020) estimate that 30.1% of men and 27.1% of women have ever been furloughed since January–February 2020. Thus, they report a −3 pp gap, and we report a 5.5 pp. While Adams-Prassl et al. (Reference Adams-Prassl, Boneva, Golin and Rauh2020c) report an adjusted gender gap of 2.8 pp (p-value < 0.05), our estimated gap is not statistically significant at the 5% level.
In terms of the type of job and sector, we find that 9% of women reported being healthcare workers, while the figure for men is 4.6%: Women were 4.3 pp (94%) more likely than men to be healthcare workers. In all, 7.5% of women reported working for the NHS, while the percentage for men is 3.3: a gender gap of 4.2 pp (127%).
In terms of full-time vs. part-time employment, 63.2% of women reported working full-time, while the figure for men is 85.9%. Women were about 23 pp (26%) less likely than men to work full time. These figures can be compared with the percentages of full-time employment in 2019 for women and men reported by Francis-Devine and Foley (Reference Francis-Devine and Foley2020): about 60% and 90%, respectively, so that the corresponding gap is 30 pp.
Regarding job characteristics, working women had more physically close to other people jobs than men. On a scale of 1 (“don't work near people”) to 5 (“very close (near touching)”), the index average was 3.77 for women and 3.36 for men, a difference of 0.41 units (0.35 SD) or about 12%.
The fraction of key workers among men and women was also similar (25.2% among men and 27.7% among women), and not statistically different.Footnote 26 Finally, we note that women reported a higher index of being frequently exposed to disease or infection in their jobs than men do, but the difference is not statistically significant. The magnitude of this gender gap is large, 14% (or 0.19 SD/16%, when adjusted), but not statistically “detectable” (p-value > 0.05) on account of the smaller sample size (restricted to employed individuals working outside home). The 95% confidence interval (−0.03, 0.83) is compatible with women facing higher risks in their workplaces [Adams (Reference Adams2020), Lewandowski et al. (Reference Lewandowski, Lipowska and Mgda2020)].
4.3.2. COVID-19 and time allocation in the labor market
We now focus on time allocation in the labor market. Table 4 focuses on the gender differences in hours of work in June 2020, in hours of work earlier in 2020 before the outbreak of the Coronavirus, and the change in hours of work. The table also displays the fraction of men and women who suffered an income loss. As before, we focus on individuals aged 18–64 who reported being employed in January–February 2020.
Table 4. Time allocation in the labor market and income loss among individuals who were employed in January–February 2020, 18–64

Note: p-values robust to heteroscedasticity. Difference is computed as the coefficient on a female indicator on a regression of the outcome on each column against a female indicator and a constant. Adjusted difference is computed in the same way after including the following control variables: ethnicity indicator (1 if non-white, 0 if white), age indicators, education indicators, couple indicator, living with others indicator, log of income in 2019, employment status indicators, rural/urban indicator, geographical location of residence indicators.
Men and women in our sample reported currently working 36.48 (SD = 29.99) and 27.13 (SD = 28.19) weekly hours, while they reported having worked 43.52 (SD = 25.46) and 38.08 (SD = 23.65) weekly hours earlier in the year, before the outbreak of the Coronavirus pandemic.Footnote 27 Taken altogether, these figures reveal that both men and women had reduced their weekly hours of work between June 2020 and before the outbreak of the Coronavirus pandemic. When trying to assess a potential differential drop in hours of work by gender, we found this to be stronger among women: −3.9 h (56% reduction). However, adding sociodemographic controls makes the gap decrease to −2.9 h (41% reduction) and lose statistical significance (p-value > 0.05). Our −3.9 h unadjusted gap compares with the +2.8 h in Hupkau and Petrongolo (Reference Hupkau and Petrongolo2020), however, their gap drops to +1.4 (p-value > 0.05) when adding additional covariates, including controls for children and work-from-home indicators. Finally, in terms of income loss, 49% of men compared with 53% of women reported a loss in gross household income because of the Coronavirus pandemic.
4.3.3. COVID-19 and time allocation in household production
We now shift our attention to gender differences in the allocation of time to household production, including childcare (or home schooling), housework (cooking, cleaning, laundry) and caring for disabled, elderly or sick adult.
Table 5 reveals substantial changes across childcare and housework tasks, but not for caring activities. We estimate the gender gap in hours spent on childcare and home schooling in June at about 8 h a week. Focusing on individuals living in a couple and with children aged 15 and younger, Hupkau and Petrongolo (Reference Hupkau and Petrongolo2020) show that the gap oscillates between 12 and 10 h approximately, without and with control variables.Footnote 28 We report a gender gap before the pandemic of 4.5–5 h. Thus, we document a higher increase in the hours allocated to childcare among women: the gender gap increases by 3.5–3.9 h. This compares with the 2.5-h increase estimated by Hupkau and Petrongolo (Reference Hupkau and Petrongolo2020), comparing 2014–2015 (UK Time Use Survey) and April–May 2020 (Covid-19 Study).
Table 5. Time allocation in household production

Note: p-values robust to heteroscedasticity. Difference is computed as the coefficient on a female indicator on a regression of the outcome on each column against a female indicator and a constant. Adjusted difference is computed in the same way after including the following control variables: ethnicity indicator (1 if non-white, 0 if white), age indicators, education indicators, couple indicator, living with others indicator, log of income in 2019, employment status indicators, rural/urban indicator, geographical location of residence indicators.
In terms of housework in the last month, we find that women spent on activities such as cooking, cleaning, and laundry an average of 29.3 h a week (SD = 31.5), 9.2 weekly hours (46%) more than men. This compares to the 6-hour gap computed in Hupkau and Petrongolo (Reference Hupkau and Petrongolo2020) using data from April–May 2020 (Covid-19 Study).Footnote 29 Before the COVID-19 pandemic, women spent on housework an average of 22.5 h a week, 7 weekly hours (45%) more than men. Thus, women had increased their time allocated to housework between the last month and before the COVID-19 pandemic more than men: 2.2 h (48%) gap.Footnote 30
Finally, the gender gap in the weekly number of hours spent on caring for disabled, elderly or sick adult did not change between the last month and before the COVID-19 pandemic.
4.4. COVID-19, protective behaviors, NHS perceptions, and charity giving
This subsection focuses on protective behaviors: in general, when going out, and on the job. In terms of general protective behaviors, Table B5 in Supplementary Material Appendix B shows that: first, almost 90% of women reported having hand sanitizer gel at home, and they were 8.5 pp (11%) more likely than men to have it; second, almost 60% of women reported having disposable face masks at home, and they were 7.4 percentage points (11%) less likely than men to have them; third, both men and women were equally likely to have disposable gloves at home, with a prevalence of 62%; fourth, women appeared to be more likely to socialize outdoors than men: 78% of women vs. 71% of men; finally, around 3.5%, for both men and women, appeared to have met 7 people or more in violation to the lockdown rules at the time of the survey.
In Table B6 in Supplementary Material Appendix B the focus is on gender differences in behaviors when going out: 95% of women reported washing their hands as soon as they got home. This fraction is 4.4 pp (5%) higher than the one for men. However, we do not find either statistically significant or sizeable differences between men and women in the reported use of face-covering (34% vs. 36%) or disposable gloves (19% vs. 17%), or in observing social distance (95% vs. 96%)Footnote 31, in spite of anecdotal evidence in the media suggesting women's higher face covering usage rates.
In Table B7 in Supplementary Material Appendix B we investigate protective behaviors on the job. Differences in social distancing at work and the use of face-covering or disposable gloves at work are not statistically significant. While the difference in the prevalence of social distancing and the use of face-covering at work is not large in magnitude, the difference in the use of disposable gloves at work does not appear to be negligible, between 7 and 10 pp or 16% and 23% difference.
In Table B8 in Supplementary Material Appendix B, we investigate differences in the views regarding the effectiveness of masks and some statements regarding masks. We do not find differences between men on women with regards the perceived effectiveness of masks in not getting coronavirus (2.50 vs. 2.44) or not spreading coronavirus (3.37 vs. 3.36), or the perceived use of masks by people in enclosed spaces (2.74 vs. 2.75). However, the average agreement score was higher for “masks effective in not spreading” than for “masks effective in not getting”.
The average level of agreement that “if everybody wears a face mask, everyone is protected from Coronavirus” was higher among women than men. Female's average agreement score was 2.43 on a scale of 1–4, while the male's one was 2.34. This represents a difference of about 0.10 SD (p-value < 0.05) or 4%. Moreover, the average level of agreement that the UK government encourages wearing a face-covering in enclosed spaces was higher among women than men. Female's average agreement score was 3.21 on a scale of 1–4, while the male's one was 3.09. This represents a difference of about 0.15 SD (p-value<0.01) or 4%.
Finally, in Table 6 we focus on gender differences in perceptions on the National Health Service (NHS) and charity giving. Respondents were given the option to ask us to donate up to 50 pence to the NHS Charities Together Footnote 32 or The Trussell Trust Footnote 33, which supports a nationwide network of food banks providing emergency food and support to people locked in poverty, and campaigns for change to end the need for food banks in the UK. They could donate the whole 50 pence, part of it, or none to any of these two charities. Respondents were not allowed to keep the amount not donated.Footnote 34
Table 6. NHS perceptions and charity giving

Note: p-values robust to heteroscedasticity. Difference is computed as the coefficient on a female indicator on a regression of the outcome on each column against a female indicator and a constant. Adjusted difference is computed in the same way after including the following control variables: ethnicity indicator (1 if non-white, 0 if white), age indicators, education indicators, couple indicator, living with others indicator, log of income in 2019, employment status indicators, rural/urban indicator, geographical location of residence indicators.
The three key findings in Table 6 are the following: first, the average level of agreement that “the NHS is crucial to British society and we must do everything to maintain it” was slightly larger among women than men. Female's average agreement score was 3.87 on a scale of 1–4, while the male's one was 3.81, a difference of 0.06 units (0.14 SD or 1.6%); second, on average, women chose to donate 23 out of 50 pence to The Trussell Trust. Men chose to donate about 18 out of 50 pence to that charity. Hence, the gender gap was 5 pence (0.31 SD or 31%); third, on average, women's allocation to the “no donation” option was 4 pence (0.20 SD or 33%) smaller than that of men.
5. Accounting for the “adjusted” gender gaps
The previous section has documented gender gaps along multiple dimensions including mental health, COVID-19-related health and economic concerns, time allocation to market and household production, and charity giving. Many of these gaps cannot be explained by ethnicity, age, education, living with a partner, living with others in the household, income in 2019, current employment status, living in a rural (vs. urban) area, or geographical location. In this section, we go one step further and add to the previous list of controls the following:
• Children & seniors living in the house:
-
o Number of children by age category (number of children aged 0–5, number of children aged 6–15, number of children 16–18)
-
o Number of individuals aged 60 and above
• Employment characteristics:
-
o Working full-time vs. part-time
-
o Being a healthcare worker
• Employment shocks:
-
o Having being furloughed because of COVID-19
-
o Having lost their job because of COVID-19
Figures 1 and 2 compare the findings in Tables 2 and 3, with unadjusted (without controls) and adjusted (with standard sociodemographic controls) gender gaps, with those in Tables B9 and B10 in Supplementary Material Appendix B, with “super adjusted” (adding the new list of controls: children & seniors, employment characteristics, and employment shocks) and “super adjusted with risk aversion proxies” gender gaps. In order to account for differences in risk aversion between men and women in explaining the gender gap in COVID-19-related health and economic concerns, we have also included the following controls variables: a time preference measure (1–10), from Falk et al. (Reference Falk, Becker, Dohmen, Huffman and Sunde2016, Reference Falk, Becker, Dohmen, Enke, Huffman and Sunde2018) —see footnote 15— and three measures of risky behaviors—obesity indicator (0–1), number of alcoholic drinks (0–10), and smoking indicator (0–1).
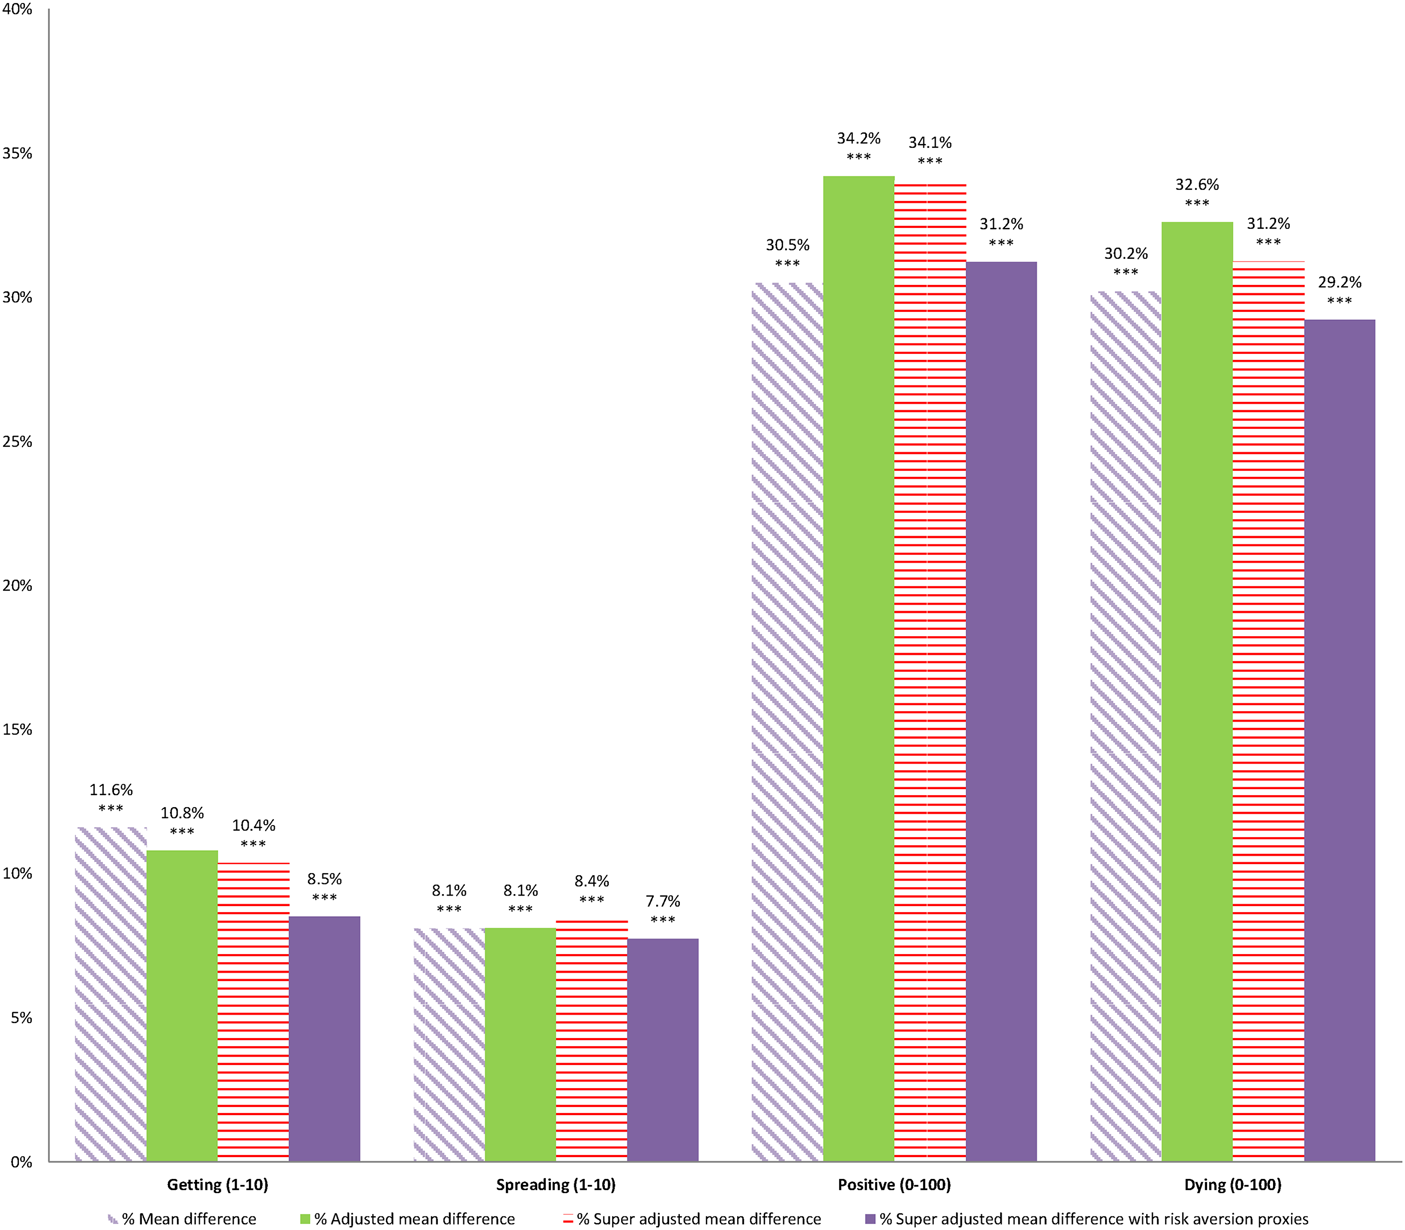
Figure 1. % Mean gender gap in COVID-19-related health concerns.
Note: **p-value < 0.05, ***p-value < 0.01. p-value of the mean difference in each column.

Figure 2. % Mean gender gap in COVID-19-related economic concerns.
Note: **p-value < 0.05, ***p-value < 0.01. p-value of the mean difference in each column.
While none of these variables is a perfect substitute for a direct measure of risk aversion, we believe they get us closer to control for risk attitudes. Thus, we think that they are useful in accounting for potential differences in risk aversion between men and women when measuring the gender gap in COVID-19-related concerns. The findings in Figures 1 and 2 (and Tables B9 and B10) show that the addition of new controls cannot account for the unexplained gender gap in COVID-19-related health and economic concerns.
Table 7 focuses on the gender gaps in hours of work in the labor market and income loss among individuals aged 18–64 and employed in January–February 2020. The first column shows that the gender gap decreases from −6.95 (SE = 1.95) to −4.42 (SE = 1.95) hours when adding the number of children, seniors, and employment type indicators. These new controls account for 36% of the adjusted (by standard controls) gender gap. The gender gap decreases even further, to −3.37 (SE = 1.85) when adding employment shocks indicators so that we can account for more than half of the gap. While not reported in the table, the new controls which are statistically significant and attract the highest coefficients in the last row (full specification) are being furloughed due to COVID-19 (−21.06, SE = 2.01), having a full-time job (16.1, SE = 1.97), and having lost the job due to COVID-19 (−9.96, SE = 2.45). The second column shows that 64% of the adjusted gender gap in hours of work early in the year before the pandemic can be accounted by being in a full-time job (18.0, SE = 1.87) and the number of children aged 16–18 living in the house (6.83, SE = 3.06). The third column shows that 34% of the gender gap in the change in hours of work can be explained by having being furloughed (−21.40, SE = 2.32) and losing the job (−12.02, SE = 3.83). Finally, the last column confirms that there is no statistically significant evidence that income loss varies by gender.
Table 7. Gender gaps in time allocation in the labor market and income loss among individuals who were employed in January–February 2020, 18–64: Standard vs. additional controls

Note: Each row displays the coefficient estimate (and robust standard error) on a female indicator of an OLS regression of the dependent variable in each column against a female indicator and the control variables indicated in each row. Standard controls: ethnicity, age, education, living with a partner, living with others in the household, income in 2019, current employment status, living in a rural (vs. urban) area, or geographical location. See Section 3. We only report asterisks if p-value < 0.05: **p-value < 0.05, ***p-value < 0.01.
In Table 8 we shift our attention to the gender gaps in hours of childcare and housework.Footnote 35 The two key findings in this table are found in the third and sixth columns. The third column shows that 12.5% of the adjusted (by standard sociodemographic characteristics) gender gap in the increase in hours of childcare (or home schooling) can be accounted by the addition of the new control variables. The three new controls attracting both the highest statistical significance and magnitude are the number of children aged 6–15 living in the house (7.48, SE = 1.26), the number of children aged 0–5 living in the house (6.81, SE = 1.87), and the number of adults aged 60 and above living in the house (−1.42, SE = 0.63). Neither the type of job indicators (full-time, healthcare worker) nor the employment shocks (being furloughed or losing the job because of COVID-19) are statistically significant.
Table 8. Gender gaps in time allocation in household production: Standard vs. additional controls

Note: Each row displays the coefficient estimate (and robust standard error) on a female indicator of an OLS regression of the dependent variable in each column against a female indicator and the control variables indicated in each row. Standard controls: ethnicity, age, education, living with a partner, living with others in the household, income in 2019, current employment status, living in a rural (vs. urban) area, or geographical location. See Section 3. We only report asterisks if p-value < 0.05: **p-value < 0.05, ***p-value < 0.01.
The sixth column shows that 16% of the gender gap in the increase in hours of housework can be accounted for by the addition of new controls. The three new controls attracting both the highest statistical significance and magnitude are: being furloughed (10.76, SE = 1.84), losing the job (9.84, SE = 3.28), and being a healthcare worker (−4.59, SE = 1.85).
In Table 9 we proceed to investigate whether we can explain the gender gap in mental health measures. In Panel I, we proceed as in Tables 7 and 8 and conclude that accounting for the number of children living in the house, the number of seniors living in the house, type of employment, and employment shocks cannot explain the previously documented gender gaps.
Table 9. Gender gaps in mental health and wellbeing: Standard vs. additional controls

Note: Each row displays the coefficient estimate (and robust standard error) on a female indicator of an OLS regression of the dependent variable in each column against a female indicator and the control variables indicated in each row. Standard controls: ethnicity, age, education, living with a partner, living with others in the household, income in 2019, current employment status, living in a rural (vs. urban) area, or geographical location. See Section 3. F-test: Health concerns irrelevant reports the robust to heteroskedasticity p-value of the F-statistic that the four health concerns indicators have a zero coefficient. F-test: Economic concerns irrelevant reports the robust to heteroskedasticity p-value of the F-statistic that the three economics concerns indicators have a zero coefficient. We only report asterisks if p-value < 0.05: **p-value < 0.05, ***p-value < 0.01.
Panel II includes both standard controls and COVID-19-related concerns: health concerns (concerned about getting coronavirus, concerned about spreading coronavirus, probability of being positive, probability of dying) and economic concerns (forecasted UR in June 2020, forecasted UR in December 2020, and forecasted UR in June 2021). Accounting for COVID-19-related health and economic concerns has a substantial impact on the average gender gap in mental health: the gap in GAD-7 drops by 47%, from 1.04 units to 0.55, the gap in the depression score drops by 41%, from 0.148 to 0.087, the gap in the likelihood of having suffered an anxiety/panic attack decreases by 2 pp, and the gap in the loneliness indicator drops by 41%, from 0.092 to 0.054. Interestingly, our proxies for economic concerns (e.g., forecasted unemployment rates) are irrelevant predictors of mental wellbeing (p-value > 0.05), while the health concerns are relevant predictors of mental wellbeing (p-value < 0.001).Footnote 36 A similar picture is obtained when adding all the controls (Panel III).
The findings in Table 9 seem to suggest that it is the discrepancy in COVID-19-related health concerns among men and women, and not their different forecasted unemployment rates, which explains a substantial part of the gender gap in mental health.
Finally, in Table 10, we conduct a similar analysis but for the perception of the NHS and charity giving. First, accounting for health concerns allows us to explain more than 40% of the gender gap in the average level of agreement that “the NHS is crucial to British society and we must do everything to maintain it”, which decreases from 0.056 (SE = 0.024) to 0.033 (SE = 0.023). Economic concerns (as measured by forecasted unemployment rates), employment type (being a healthcare worker or working full time), or employment shocks (being furloughed or losing the job) seem to be irrelevant in explaining this gender gap. Second, most of the gap in food charity donation remains unexplained: the new controls can explain at most 10% of the gap. Finally, 20% of the gap in no donations can be explained by the addition of new controls.
Table 10. Gender gaps in NHS perceptions and charity giving: Standard vs. additional controls
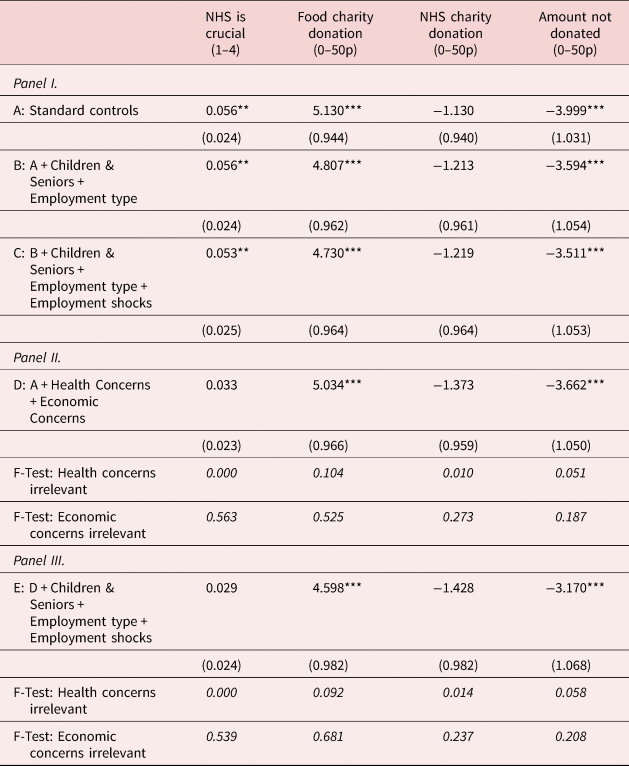
Note: Each row displays the coefficient estimate (and robust standard error) on a female indicator of an OLS regression of the dependent variable in each column against a female indicator and the control variables indicated in each row. Standard controls: ethnicity, age, education, living with a partner, living with others in the household, income in 2019, current employment status, living in a rural (vs. urban) area, or geographical location. See Section 3. F-test: Health concerns irrelevant reports the robust to heteroskedasticity p-value of the F-statistic that the four health concerns indicators have a zero coefficient. F-test: Economic concerns irrelevant reports the robust to heteroskedasticity p-value of the F-statistic that the three economics concerns indicators have a zero coefficient. We only report asterisks if p-value < 0.05: **p-value < 0.05, ***p-value < 0.01.
6. Discussion
This article draws a gender inequality picture along multiple dimensions 3 months after the first lockdown of 23 March 2020, in the UK. First, women appear to be more concerned about COVID-19 and its health risks than men. In particular, women were more concerned about both getting and spreading coronavirus than men. Moreover, women's perceived coronavirus prevalence was higher than that of men, and their perceived Coronavirus lethality was about 1.5 percentage points (39%) higher than that of men.
Second, women's perceived economic prospects in COVID-19 times were worse than men's. The average level of agreement that a new lockdown would be necessary before the end of 2020 was 4.8% larger among women than men, and indeed was the second lockdown in the UK from 5 November to 2 December 2020. Women's forecasted unemployment rates for December 2020 and June 2021 were 0.9 and 1.1 percentage points (or 10% and 15%) larger than those forecasted by men.
Third, we also document a substantial gender gap in mental health as measured by different indicators, including the General Anxiety Disorder 7-item scale (GAD-7), the most frequently used diagnostic self-report scales for screening, diagnosis, and severity assessment of anxiety disorder [Jordan et al. (Reference Jordan, Shedden-Mora and Löwe2017)]. The GAD-7 gender gap is 1.04 (SE = 0.251) units (25%) with standard sociodemographic controls and does not disappear (0.503, SE = 0.255) even after accounting for additional multiple controls. The gender gap in mental health can only be partially explained by health concerns; interestingly, economic concerns do not seem relevant in explaining this gender gap.
Our paper is also informative on the widening of gender inequality because of the COVID-19 pandemic. This can be seen in multiple margins of women's labor market attachment and other time adjustments in household production between February and June 2020. We find evidence that controlling for standard socioeconomic characteristics, women have experienced a higher decrease in hours of work than men: about −2.89 h (SE = 1.60), which decreases to −1.90 (SE = 1.55) after controlling for the number of children by age category, number of seniors (individuals aged 60 or plus), type of employment (full-time vs. part-time, healthcare worker), and employment shocks (being furloughed or losing the job because of the Coronavirus pandemic). We also estimate an increase in the gender gap in childcare (or home schooling) time of about 3.38 (SE = 0.96) or 3.87 (SE = 1.0) weekly hours, and in housework time of about 2.34 (SE = 0.95) or 2.79 (SE = 0.96), depending on the type of controls.
Our study has a few key strengths. First, we have adopted a holistic approach on gender inequality, covering multiple dimensions, from mental health to charity giving, which allows us to provide a rich picture of the situation in the UK 3 months after the first UK lockdown. A second advantage is that we explicitly asked about the number of hours allocated to market and household production thinking back to earlier in 2020 before the outbreak of the Coronavirus pandemic so that the documented changes are with respect to the situation immediately before the outbreak. Third, our collected data is publicly available for researchers to replicate and extend our study above and beyond what we have documented in this article.
There are limitations too. First, while the holistic approach allows us to report on interesting and previously undocumented COVID-19 gendered dimensions, sometimes we do not have all the required information to investigate particular topics in detail, such as furloughing, which are deeply explored in other studies [Adams-Prassl et al. (Reference Adams-Prassl, Boneva, Golin and Rauh2020c)]. Second, we must acknowledge that, by asking time allocation questions retrospectively, there is scope for potential reporting with measurement error induced by recall bias. Finally, our data comes from Prolific respondents which may be similar or different, as shown in this study, from broadly and randomly selected UK respondents.
Our findings point to substantial gender differences in vulnerability to the pandemic and to the need for pandemic-related health policies to take gender into account, and for the government to devise stimulus policies that consider women's difficulties and channels to improve their mental and economic wellbeing. Having said that, a crucial future endeavor for researchers is to assess the extent to which the gender gaps documented in this article persist over time.
Supplementary material
The supplementary material for this article can be found at https://doi.org/10.1017/dem.2021.2.
Acknowledgements
This article uses two types of data: primary and secondary. The secondary data comes from Understanding Society. Understanding Society is an initiative funded by the Economic and Social Research Council and various Government Departments, with scientific leadership by the Institute for Social and Economic Research, University of Essex, and survey delivery by NatCen Social Research and Kantar Public. Understanding Society data are available through the UK Data Service. Researchers who would like to use Understanding Society need to register with the UK Data Service before being allowed to apply for or download datasets. More information: https://www.understandingsociety.ac.uk/documentation/access-data. The primary data (collected by the authors), questionnaire and replication files are publicly available from https://sites.google.com/site/climentquintanadomeque/covid-19-data. We thank Marta Golin, Murat Iyigun (co-editor), one anonymous referee of the Journal of Demographic Economics and seminar participants at the Theoretical and Applied Microeconomics Research Cluster of the University of Leicester Business School for helpful comments and suggestions. Any errors in this article are the sole responsibility of its authors.
Ethical standards
Ethics approval was obtained from the UEBS Research Ethics Committee of the University of Exeter: eUEBS003268.


 Open access