


Although more and more efforts have been made to curb the epidemic of obesity, the global prevalence of obesity keeps growing slowly and maintains at high level in many countries(1). Age-standardised prevalence of obesity among American adults increased from 33·7 % in 2007–2008 to 39·6 % in 2015–2016(Reference Hales, Fryar and Carroll2). The estimated annual costs of obesity were approximately $US 2 trillion(Reference Lehnert, Sonntag and Konnopka3).
Individuals with excess body weight are believed to be benefited from early diet and lifestyle intervention(Reference Ryan and Kahan4). However, some of these individuals are reluctant to initiate these interventions because evidences showed that they were not always associated with increased risk of cardiometabolic complications and mortality(Reference Flegal, Kit and Orpana5,Reference Cheng, Gao and Mitchell6) . The unique population was named as metabolically healthy overweight, although the widely accepted definition was absent(Reference Stefan, Kantartzis and Machann7,Reference Liu, Wang and Guan8) . However, some knowledge gaps need to be addressed. First, it is doubtful to define participants with one type of metabolic abnormality as metabolically healthy(Reference Camhi, Must and Gona9–Reference Hamer, Bell and Sabia15). Further, fatty liver(Reference Targher, Byrne and Lonardo16) and hyperuricaemia(Reference Borghi, Verardi and Pareo17), which were closely associated with cardiovascular events and usually considered as metabolic abnormalities, were not included in the metabolically healthy obesity (MHO) criteria in most of the previous studies(Reference Camhi, Must and Gona9–Reference Hamer, Bell and Sabia15,Reference Mongraw-Chaffin, Foster and Anderson18–Reference Martinez-Gomez, Ortega and Hamer20) . Second, what contributes to the conversion from metabolically healthy to unhealthy condition remained uncertain. The prevalence of conversion from metabolically healthy to unhealthy phenotype ranges from 28 to 84 %(Reference Camhi, Must and Gona9–Reference Hamer, Bell and Sabia15,Reference Mongraw-Chaffin, Foster and Anderson18–Reference Martinez-Gomez, Ortega and Hamer20) , and mixed results are generated to determine the factors, such as BMI, contributing to the conversion among existing studies. Some(Reference Camhi, Must and Gona9,Reference Moussa, Arhi and Ziprin12,Reference Heianza, Kato and Kodama14,Reference Hamer, Bell and Sabia15) , but not all(Reference Gilardini, Zambon and Soranna10,Reference Kouvari, Panagiotakos and Yannakoulia11) , reported that BMI was associated with high risk of conversion.
Therefore, we performed the current cohort study to evaluate the association between BMI and the conversion from metabolically healthy to unhealthy phenotype in about 5000 metabolically healthy Chinese adults during 5 years of follow-up. The association between inflammatory status, assessed by high-sensitivity C-reactive protein (hs-CRP), and the conversion was also evaluated because hs-CRP contributed to metabolic abnormalities(Reference Alam, Ng and Larbi21,Reference Iglesias Molli, Penas Steinhardt and Lopez22) . Further, a meta-analysis suggested that hs-CRP might not be an independent risk factor(Reference Lee, Adler and Sandhu23) and hs-CRP and BMI could be jointly associated with insulin resistance(Reference Uemura, Katsuura-Kamano and Yamaguchi24) and metabolic diseases(Reference Horvei, Grimnes and Hindberg25).
Materials and methods
Study population
All the participants were recruited from the Health Management Center in a teaching hospital from 1 January 2013 to 31 December 2018. All adult (≥18 years old) individuals receiving routine health check-up at our Health Management Center were eligible for the study. An initial recruitment resulted in an identification of 110 859 participants. Body weight, glycated Hb A1c (HbA1c, normal range <6 %), fasting blood glucose (FBG), blood pressure (systolic blood pressure (normal range <130 mmHg) and diastolic blood pressure (normal range <80 mmHg)), lipid profile (TAG (normal range <1·7 mmol/l), total cholesterol (<5·72 mmol/l), LDL-cholesterol (normal range <3·4 mmol/l) and HDL-cholesterol (normal range ≥0·9 mmol/l in men and ≥1·0 mmol/l in women)), serum uric acid (normal range <416 μmol/l in men and <357 μmol/l in women) and liver B ultrasonography were annually assessed throughout the study (2013–2018). Hs-CRP was assessed at baseline (2013). The history of hypertension, diabetes/impaired fasting glucose, dyslipidaemia, gout/hyperuricaemia and CVD (stroke, haemorrhage, coronary artery bypass grafting, stent surgery and ischaemic infarction) was collected via a self-report questionnaire.
Metabolically healthy was defined as participants with no history of metabolic diseases, normal FBG level, HbA1c level, blood pressure, lipid profile, serum uric acid level and liver ultrasonographic findings at baseline(Reference Xu, Gao and Wan26). To recruit metabolically healthy participants, we first excluded participants with history of metabolic diseases and cancer (n 10 089) and those with baseline metabolic abnormalities (high blood pressure (n 37 563), impaired glucose regulation (n 14 610), dyslipidaemia (n 14 155), hyperuricaemia (n 2885)(Reference Targher, Byrne and Lonardo16) and fatty liver (n 134)(Reference Borghi, Verardi and Pareo17)). Then, we excluded participants with low baseline BMI (≤18·4 kg/m2, n 2570) and very high level of hs-CRP (≥10 mg/l, n 294)(Reference Wu, Huang and Jin27). Finally, we excluded participants lost to follow-up (n 13 378) and with missing data during the follow-up (n 10 259). Because there were only thirty-eight aged participants (≥65 years), we further excluded them. Included were 4855 (1942 men and 2913 women) metabolically healthy Chinese adults with mean age of 36·0 ± 8·9 years (Fig. 1). Participants included in the study tended to be younger and have higher proportion of women and lower baseline BMI, level of HbA1c, FBG and blood pressure, compared with those who were out of the study (see online supplementary material, Supplemental Table S1). The study protocol was approved by the Ethical Committee. As a de-identified secondary data analysis, patients’ consent was waived by the Ethical Committee.
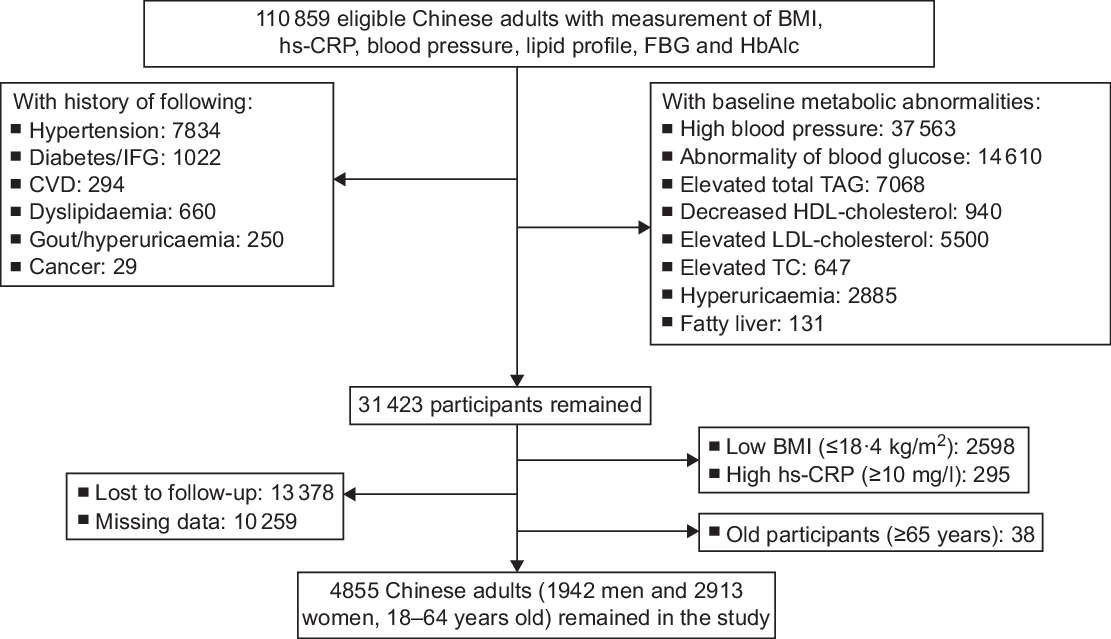
Fig. 1 The process of sample recruitment. Criteria: high blood pressure, systolic blood pressure ≥ 130 mmHg and/or diastolic blood pressure ≥ 80 mmHg; abnormality of blood glucose, FBG ≥ 5·6 mmol/l and/or HbA1c ≥ 5·6 %; elevated TAG, ≥1·7 mmol/l; elevated TC, ≥5·72 mmol/l; elevated LDL-cholesterol, ≥3·4 mmol/l; decreased HDL-cholesterol, <0·9 mmol/l in men and <1·0 mmol/l in women; hyperuricaemia, serum uric acid ≥416 μmol/l in men and ≥357 μmol/l in women. Fatty liver was confirmed by the ultrasound B model. CVD included stroke, haemorrhage, coronary artery bypass grafting, stent surgery and ischaemic infarction. hs-CRP, high-sensitivity C-reactive protein; FBG, fasting blood glucose; HbA1c, glycated Hb A1c; IFG, impaired fasting glucose; TC, total cholesterol
Exposure
In the current study, baseline BMI and hs-CRP were considered as the exposures. Body weight (to the nearest 0·5 kg) and height (to the nearest 0·5 cm) were measured in standing position without shoes and in light clothing, using an electronic scale (SK-CK; Shuang Jia Company). BMI was calculated by body weight (kg) divided by height square (m2). Participants were classified into normal weight (18·5 ≤ BMI < 24·0 kg/m2) or overweight (BMI ≥ 24·0 kg/m2) groups based on the criteria for Chinese adults(Reference Zhou28).
Venous blood samples were drawn and transfused into vacuum tubes containing EDTA in the morning after participants were fasted for at least 6 h. The concentration of hs-CRP was measured by the immunoturbidimetric method (CardioPhase hsCRP kit; Siemens Healthcare Diagnostics Products GmbH). The lower limit of detection was 0·01 mg/l. The intra-assay CV was 7·6 % and the inter-assay CV was 4·0 %. All the participants were classified into low risk (<1·0 mg/l) and high risk (≥1·0 mg/l) groups based on baseline hs-CRP(Reference Pearson, Mensah and Alexander29).
Baseline BMI and hs-CRP had a significant interaction, in relation to the risk of the conversion (P interaction was tested by likelihood-ratio tests where BMI and hs-CRP were categorised as follows: BMI < 24·0 kg/m2 v. BMI ≥ 24·0 kg/m2 and hs-CRP < 1 v. ≥1 mg/l, P for interaction =0·005). We further classified the participants into four groups based on both baseline BMI and hs-CRP status as follows: normal body weight – low-risk group, BMI <24·0 kg/m2 and hs-CRP < 1·0 mg/l; normal body weight – high-risk group, BMI < 24·0 kg/m2 and hs-CRP ≥ 1 mg/l; overweight – low-risk group, BMI ≥ 24·0 kg/m2 and hs-CRP < 1 mg/l and overweight – high-risk group, BMI ≥24·0 kg/m2 and hs-CRP ≥ 1·0 mg/l.
Outcomes
An automatic analyser (Roche 701 Bioanalyzer; Roche) was used to measure FBG with the hexokinase/glucose-6-phosphate dehydrogenase method. The CV using blind quality control specimens was 2·0 %. The concentration of HbA1c was measured by HPLC, using the fully automated VARIANT™ II Hemoglobin Testing System (Bio-Rad). The measurement range was between 2·0 and 18·0 %. Blood pressure was measured twice using an automatic blood pressure metre (HBP-9020; OMRON (China) Co. Ltd) after participants were seated for at least 10 min. The average of two measurements was recorded for further analysis. Total cholesterol, TAG, HDL-cholesterol, LDL-cholesterol, alanine transferase, aspartate transferase, creatinine and uric acid were measured by an automatic biochemical analyser (Roche 701 Bioanalyzer; Roche). The estimating glomerular filtration rate was calculated using the Chronic Kidney Disease Epidemiology Collaboration 2-level race equation(Reference Kong, Ma and Chen30). All the measurements were completed in the clinical laboratory of our hospital.
Metabolically healthy was defined as participants with no history of metabolic diseases, free of metabolic abnormalities and normal liver ultrasonographic findings at baseline(Reference Xu, Gao and Wan26). Conversion from baseline metabolically healthy to unhealthy phenotype (outcome) was deemed if any of the following metabolic abnormalities were at least double confirmed during subsequent 5 years of follow-up: high blood pressure (systolic blood pressure ≥ 130 mmHg or diastolic blood pressure ≥ 80 mmHg)(Reference Whelton, Carey and Aronow31), glucose abnormality (FBG ≥ 5·6 mmol/l or HbA1c ≥ 5·7 %)(32), dyslipidaemia (elevated total glycerides ≥1·7 mmol/l, elevated total cholesterol ≥5·72 mmol/l, elevated LDL-cholesterol ≥3·4 mmol/l, decreased HDL-cholesterol <0·9 mmol/l in men and <1·0 mmol/l in women)(Reference Srikanth and Deedwania33), hyperuricaemia (serum uric acid ≥416 μmol/l in men and ≥357 μmol/l in women)(Reference Shen, Wu and Xu34) and fatty liver(Reference Sookoian and Pirola35).
Statistical analysis
Data were presented as mean and sd if it was in normal distribution and medium and quartile range if it was in abnormal distribution. We completed all statistical analyses by SAS version 9.4 (SAS Institute, Inc.). Formal hypothesis testing will be two-sided with a significant level of 0·05. Because the conversion was confirmed at least twice, we determined the person-time of follow-up for each participant from 1 January 2014 to either the first onset date of the conversion or the end of follow-up (31 December 2018), whichever came first.
We used the proportional Cox regression model to evaluate the association between baseline BMI, hs-CRP and the conversion from metabolically healthy to unhealthy phenotype. We adjusted the potential confounders in different models: model 1, adjusting for age (years) and sex and model 2, further adjusting for baseline systolic blood pressure (mmHg), diastolic blood pressure (mmHg), FBG (mmol/l), HbA1c (%), total cholesterol (mmol/l), TAG (mmol/l), LDL-cholesterol (mmol/l), HDL-cholesterol (mmol/l), alanine transferase (U/l), aspartate transferase (U/l), uric acid (μmol/l) and estimating glomerular filtration rate (ml/min per 1·73 m2). We further adjusted the baseline hs-CRP when considering the association between BMI and the conversion while baseline BMI when considering the association between hs-CRP and the conversion in model 3.
Likelihood-ratio tests were conducted to examine statistical interactions between baseline BMI and sex, and age, in relation to the conversion by comparing −2 log likelihood χ 2 between nested models with and without the cross-product terms.
To test the robustness of the main results, we conducted four sensitivity analyses in model 2. First, we censored participants whose baseline level of hs-CRP was 3·0 mg/l or more(Reference Pearson, Mensah and Alexander29). Then, we censored participants whose BMI was 28·0 kg/m2 or more(Reference Zhou28). Third, we censored participants who were confirmed with the conversion either in 2014 or in 2015 to alleviate the potential distraction of baseline characteristics. At last, we replaced baseline BMI by cumulative average of BMI (the average of all the measurements during the follow-up) as the exposure. The participants were classified into normal weight (BMI < 24·0 kg/m2) or overweight (BMI ≥ 24·0 kg/m2) groups based on the criteria for Chinese adults(Reference Zhou28).
Results
The mean age and BMI were 36·0 ± 8·9 years and 22·2 ± 2·4 kg/m2, respectively, while median hs-CRP level was 0·38 mg/l (inter-quartile range 0·2, 0·76 mg/l). There were significant differences in all the baseline characteristics except total cholesterol level (Table 1).
Table 1 Baseline characteristics across different BMI and high-sensitivity C-reactive protein (hs-CRP) groups in 4855 metabolically healthy Chinese adults*

NWB, normal body weight; HbA1c, glycated Hb A1c; SBP, systolic blood pressure; DBP, diastolic blood pressure; FBG, fasting blood glucose; HbA1c, glycated Hb A1c; ALT, alanine transferase; AST, aspartate transferase; TC, total cholesterol; eGFR, estimating glomerular filtration rate.
* Criteria: NBW – low risk, BMI < 24·0 kg/m2 and hs-CRP < 1·0 mg/l; NBW – high risk, BMI < 24·0 kg/m2 and hs-CRP ≥ 1 mg/l; overweight – low risk, BMI ≥ 24·0 kg/m2 and hs-CRP < 1 mg/l; overweight – high risk, BMI ≥ 24·0 kg/m2 and hs-CRP ≥ 1·0 mg/l.
We identified 1692 (34·9 %) participants who experienced the conversion from baseline metabolically healthy to unhealthy phenotype during 5 years of follow-up. Compared with their counterparts, the adjusted hazards ratio (HR) was 1·04 (95 % CI 1·02, 1·07) for each unit (1·0 kg/m2) increase of BMI to the conversion, while it was 1·12 (95 % CI 1·02, 1·22) for each mg/l increase of hs-CRP level, after adjustment of age, sex, baseline blood pressure, FBG, HbA1c, lipid profile, alanine transferase, aspartate transferase, uric acid and estimating glomerular filtration rate (Table 2, model 2). Further adjustment of hs-CRP did not materially change the association between BMI and the risk of the conversion (adjusted HR = 1·04 for each unit increase of BMI, 95 % CI 1·01, 1·07). However, the association between hs-CRP and the risk of the conversion was not significant after further adjustment of BMI (adjusted HR = 1·09 for each mg/l increase of hs-CRP level, 95 % CI 0·99, 1·19) (Table 2, model 3).
Table 2 Adjusted hazards ratios (HR) and 95 % CI for the risk of the conversion from metabolically healthy to unhealthy phenotype, across different BMI and high-sensitivity C-reactive protein (hs-CRP) groups during 5 years of follow-up among 4855 metabolically healthy Chinese adults
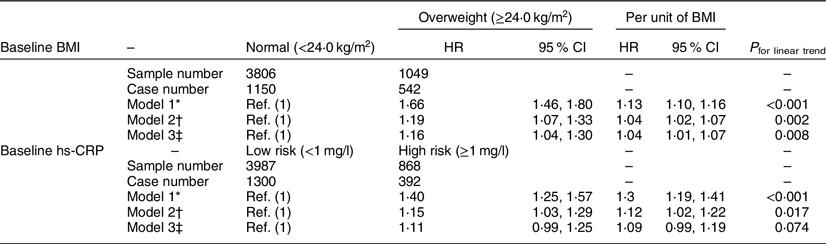
* Model 1, adjusting for age (years) and sex.
† Model 2, adjusting for age (years) and sex, and further baseline systolic blood pressure (mmHg), diastolic blood pressure (mmHg), fasting blood glucose (mmol/l), HbA1c (%), total cholesterol (mmol/l), TAG (mmol/l), LDL-cholesterol (mmol/l), HDL-cholesterol (mmol/l), alanine transferase (U/l), aspartate transferase (U/l), uric acid (μmol/l) and estimating glomerular filtration rate (ml/min per 1·73 m2).
‡ Model 3, adjusting for variables in model 2 and further baseline hs-CRP (mg/l) for BMI as well as BMI (kg/m2) for hs-CRP.
Compared with participants with normal weight and low level of hs-CRP, participants with overweight and high level of hs-CRP were associated with the highest risk of the conversion (adjusted HR 1·35, 95 % CI 1·14, 1·59). Participants with overweight but low level of hs-CRP were also associated with higher risk of the conversion (adjusted HR 1·16, 95 % CI 1·02, 1·32). However, the association was not significant in the reverse scenario (HR 1·11, 95 % CI 0·95, 1·29) (Table 3, model 2).
Table 3 Adjusted hazards ratios (HR) and 95 % CI for the risk of the conversion from metabolically healthy to unhealthy status, across different groups divided by baseline BMI and high-sensitivity C-reactive protein (hs-CRP) during 5 years of follow-up among 4855 metabolically healthy Chinese adults*
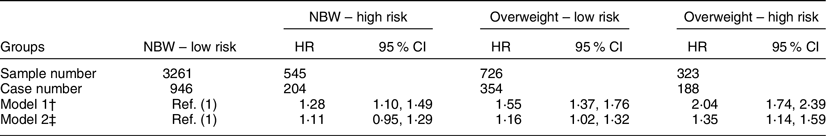
* Criteria: NBW – low risk, BMI < 24·0 kg/m2 and hs-CRP < 1·0 mg/l; NBW – high risk, BMI < 24·0 kg/m2 and hs-CRP ≥ 1 mg/l; overweight – low risk, BMI ≥ 24·0 kg/m2 and hs-CRP < 1 mg/l; overweight – high risk, BMI ≥ 24·0 kg/m2 and hs-CRP ≥ 1·0 mg/l.
† Model 1, adjusting for age (years) and sex.
‡ Model 2, adjusting for age (years) and sex, and further baseline systolic blood pressure (mmHg), diastolic blood pressure (mmHg), fasting blood glucose (mmol/l), HbA1c (%), total cholesterol (mmol/l), TAG (mmol/l), LDL-cholesterol (mmol/l), HDL-cholesterol (mmol/l), alanine transferase (U/l), aspartate transferase (U/l), uric acid (μmol/l) and estimating glomerular filtration rate (ml/min per 1·73 m2).
We did not find significant interaction between BMI and sex, and age, in relation to the risk of the conversion (all P > 0·05, see online supplementary material, Supplemental Table S2). Excluding participants whose baseline hs-CRP level was 3 mg/l or more (n 185), or participants who experienced the conversion in the first 2 years (2014 and 2015) (n 748), and using cumulative average of BMI as the exposure generated similar results to the main analysis (see online supplementary material, Supplemental Table S3).
Discussion
In the current cohort study, we found that baseline BMI was associated with the risk of the conversion from metabolically healthy to unhealthy phenotype in about 5000 Chinese adults, after adjustment of age, sex, baseline blood pressure, FBG, HbA1c, lipid profile, alanine transferase, aspartate transferase, uric acid and estimating glomerular filtration rate. Compared with participants with normal body weight and low level of hs-CRP, participants with overweight and high level of hs-CRP were associated with the highest risk of the conversion.
A recent large-scale cohort study (n 121 701) confirmed that most of the women with obesity moved from metabolically healthy to unhealthy condition after 20 years of follow-up(Reference Eckel, Li and Kuxhaus19). However, the factors contributing to the conversion remained unclear. Our results, consisted with the previous studies(Reference Moussa, Arhi and Ziprin12,Reference Hamer, Bell and Sabia15) focusing on participants with obesity and general population(Reference Heianza, Kato and Kodama14), confirmed that BMI was associated with the risk of conversion. Moussa et al.(Reference Moussa, Arhi and Ziprin12) recruited 231 399 metabolically healthy patients with a recorded BMI of 35 kg/m2 or greater from the Clinical Practice Research Datalink, and they reported that participants with higher BMI (50–60 kg/m2) were in higher risk of conversion to unhealthy phenotype, compared with participants with relatively lower BMI (35–40 kg/m2). Participants with the highest BMI (≥60 kg/m2) were associated with the shortest duration of stable MHO(Reference Moussa, Arhi and Ziprin12). Hamer et al.(Reference Hamer, Bell and Sabia15) reported metabolically healthy participants with obesity were four times as likely to convert to metabolically unhealthy phenotype compared with healthy participants with normal weight. Another cohort study included 27 478 metabolically healthy Japanese participants with similar BMI (21·4 ± 2·0 kg/m2 for normal weight group and 26·8 ± 1·7 kg/m2 for obesity group) to our study, and the results also showed that high baseline BMI was a risk factor for the conversion (HR 1·11; 95 % CI 1·02, 1·21) to unhealthy phenotype(Reference Heianza, Kato and Kodama14). However, two cohort studies, also focusing on participants with obesity (BMI ≥ 30 kg/m2), did not confirmed the association between BMI and the risk of conversion(Reference Gilardini, Zambon and Soranna10,Reference Kouvari, Panagiotakos and Yannakoulia11) . Except for the absence of standard definition, the differences in baseline BMI and study population might be plausible explanations. The opposite evidences were generated from the studies(Reference Gilardini, Zambon and Soranna10,Reference Kouvari, Panagiotakos and Yannakoulia11) including participants with obesity, while our study and two other studies(Reference Heianza, Kato and Kodama14,Reference Hamer, Bell and Sabia15) included both participants with obesity and with normal body weight. In the study including only participants with obesity, mean BMI at baseline was 38·8 kg/m2, and participants with BMI of 50–60 kg/m2 were associated with high risk of conversion(Reference Moussa, Arhi and Ziprin12). It was obviously higher than those in two opposite studies(Reference Gilardini, Zambon and Soranna10,Reference Kouvari, Panagiotakos and Yannakoulia11) .
Our study found that hs-CRP was also associated with the risk of the conversion; however, the association lost after further adjustment of BMI. A cross-sectional study supported our findings. They reported that the level of hs-CRP was similar between metabolically healthy participants with and without the metabolic syndrome(Reference Iglesias Molli, Penas Steinhardt and Lopez22). Kouvari et al.(Reference Kouvari, Panagiotakos and Yannakoulia11) reported the high level of hs-CRP was associated with metabolically healthy participants with obesity; however, the results were based on unadjusted analysis. The results indicated that the association between baseline body weight status (assessed by BMI) and the development into unhealthy condition was mediated by low-grade systemic inflammation (assessed by hs-CRP). The mechanism between BMI and the conversion was unclear; however, it might share the same pathway between obesity and metabolic diseases, in which inflammation(Reference Saltiel and Olefsky36) and dysfunction of adipose tissue(Reference Goossens37) could play important roles.
The strength of the current study includes its strictest definition of metabolically healthy (‘zero’ risk factors of metabolic abnormalities including blood pressure, glucose metabolism, lipid profile, serum uric acid level and liver ultrasonography) and double confirmation of metabolic abnormalities during the follow-up, which provided greater breadth of insights regarding accurate estimates of metabolic outcomes of the MHO phenotype. Our study also has some limitations. First, the current study focused on the baseline measure of CRP and neglected long-term change. The concentration of CRP changes in life(Reference Tabak, Kivimaki and Brunner38). Temporary fluctuations and changes in CRP levels over time may result in underestimation of the true association between exposure and outcome. Second, the participants in the current study were recruited from healthy examination in our hospital, which could not represent the general population in Shanghai city. Generalisability of our findings is thus limited. Second, information on other lifestyle factors and behaviours (e.g., physical activity and diet), which have been identified as modifiable factors for carotid artery plaque (CAP)(Reference Paraskevas, Mikhailidis and Veith39), was not collected. Waist circumference, which might be closely associated with metabolic abnormalities(Reference Shen, Punyanitya and Chen40), was also not collected, which could result in overestimation of the association between BMI and the risk of conversion. Third, behaviour habits such as smoking were not included in the analysis. The self-report prevalence of smoking in this population was rather low (1 %), and we thus did not include smoking variable in the model. Excluding those self-reported smokers did not materially change significant results (data not shown). Finally, we could not exclude the possible collinearity because there was a significant correlation between baseline BMI and hs-CRP (coefficient was 0·137 in men and 0·208 in women controlling for baseline age, both P < 0·01). However, the variance inflation factor was 1·172 for BMI (normal v. overweight) and 1·058 for hs-CRP (<1 v. ≥1 mg/l), which showed that the effects of collinearity might be slight.
Conclusions
BMI was associated with the risk of the conversion from metabolically healthy to unhealthy status in Chinese adults. Metabolically healthy participants with overweight and obesity are necessary to initiate dietary and behaviour intervention, facilitating to maintain a stable metabolically healthy condition. Although the association between baseline hs-CRP and the risk of the conversion from metabolically healthy to unhealthy status lost when further adjusting for baseline BMI, the role of hs-CRP should not be underestimated. BMI and hs-CRP were jointly associated with the risk of conversion from metabolically healthy to unhealthy status.
Data availability
The SAS code and data that support the findings of the current study are available from the first author upon reasonable request.
Acknowledgements
Acknowledgements: None. Financial support: The study was supported by the grant from Shanghai Key Laboratory of Pediatric Gastroenterology and Nutrition (no. 17DZ2272000). Conflict of interest: There are no conflicts of interest. Authorship: R.X. researched data, performed the analyses and drafted and reviewed the manuscript; P.S., C.W. and Z.F. researched the data; Y.W. and X.G. reviewed/edited the manuscript. All the authors have read and approved the final submitted manuscript. Ethics of human subject participation: The study protocol was approved by the Ethical Committee of Ren Ji Hospital, School of Medicine, Shanghai Jiao Tong University. As a de-identified secondary data analysis, patients’ consent was waived by the Ethical Committee.
Supplementary material
For supplementary material accompanying this paper visit https://doi.org/10.1017/S136898002000289X


