


Technology currently available in consumer-level unmanned aerial vehicles (UAVs; units costing ≤US$2,000) is capable of capturing archaeological features that leave some type of topographic signature in most landcover contexts using aerial photogrammetry. UAV technology, therefore, can be usefully applied by archaeologists in most study areas to develop high-resolution digital terrain models of archaeological features of interest. To democratize (Magnani et al. Reference Magnani, Douglass, Schroder, Reeves and Braun2020) the use of UAVs in archaeological research—regardless of a researcher's technological experience or equipment access—we present a free and open-source software protocol (FOSS Protocol) for producing high-resolution digital terrain models from UAV-based photogrammetry. The FOSS Protocol covers pre-, in-, and post-field processes by providing reproducible code to define a research area of interest, determine the landcover contexts within that area of interest that are most likely to produce the best results, systematically collect images within that area, and then process the collected images to produce a high-resolution digital terrain model. Resulting terrain models can then be used to identify the presence of sites for more efficient survey and utilized in targeted spatial analyses that benefit from high-resolution digital terrain models.
We present the FOSS Protocol as an accessible aggregated toolset for systematically collecting and processing UAV imagery that is reproducible and automatically creates the highest-resolution digital terrain model based on the equipment available to the researcher. The FOSS Protocol, therefore, provides a standardized methodological framework that aggregates the tools needed for researchers to move beyond the explicit production of data and encourage its implementation in the pursuit of knowledge production. We also present a direct comparison of digital terrain models produced using the FOSS Protocol with those created using proprietary software—through a controlled case study on the Mesa Verde North Escarpment in the northern US Southwest (Figure 1)—to highlight the power of this set of freely available computational tools.
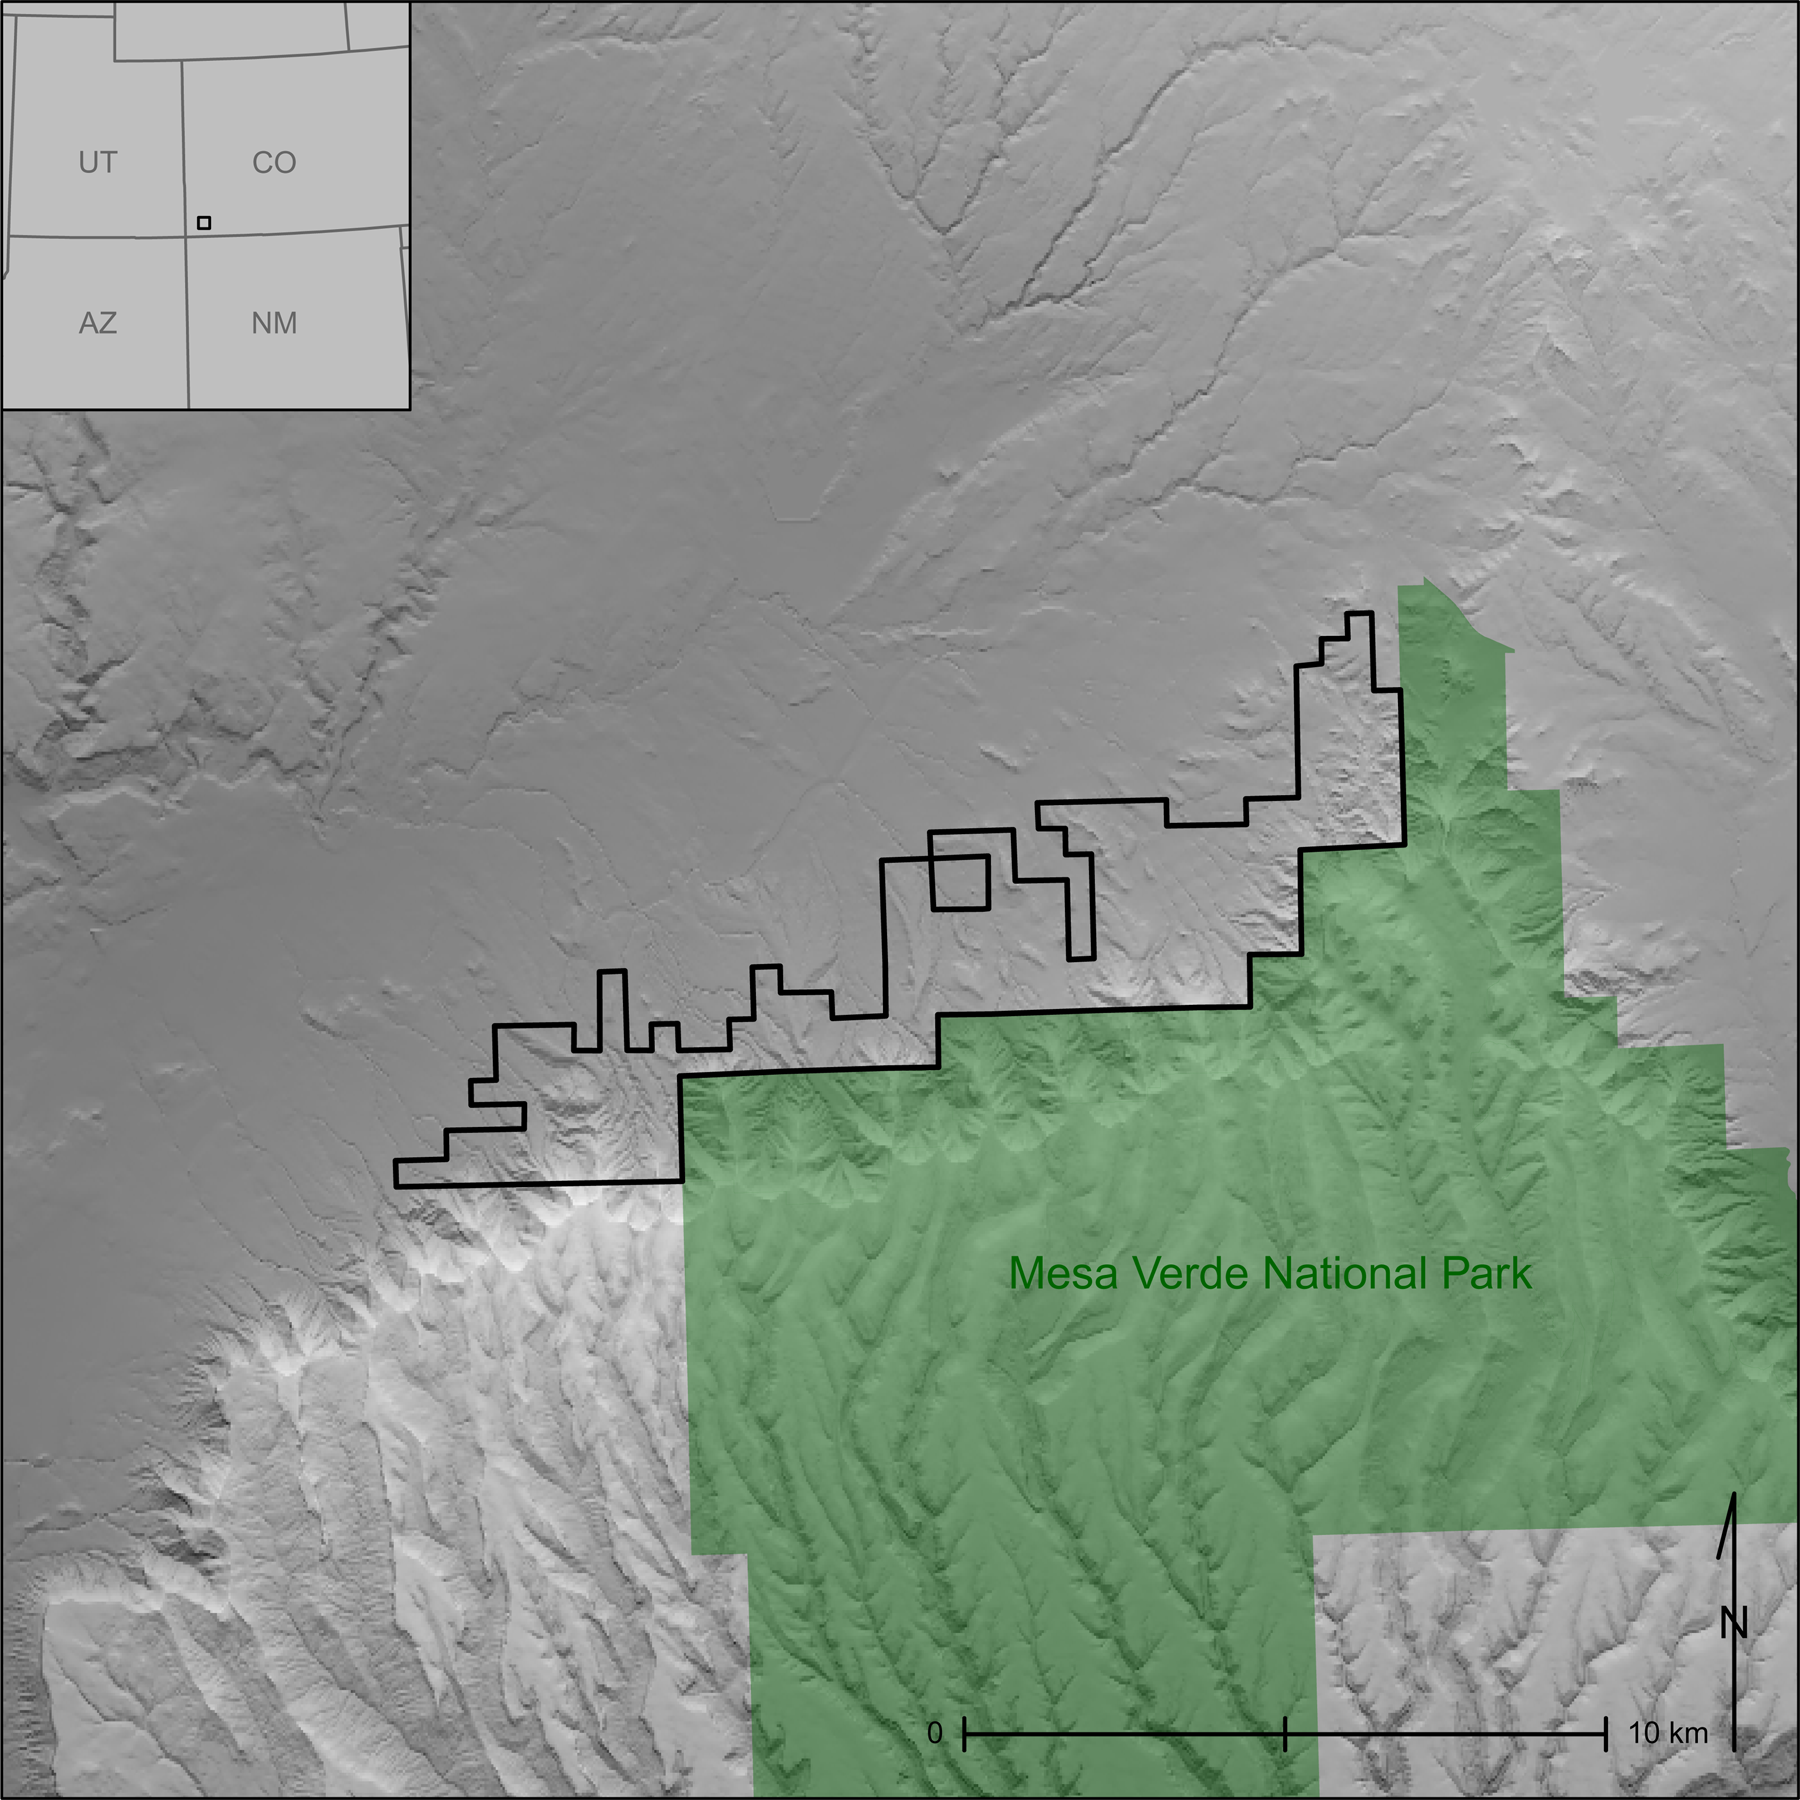
FIGURE 1. The Mesa Verde North Escarpment. The Mesa Verde North Escarpment (outlined in black) and Mesa Verde National Park (shaded in green) are located in southwestern Colorado of the northern US Southwest (inset, top left).
A FREE AND OPEN-SOURCE SOFTWARE PROTOCOL
The protocol is split into three general steps: pre-, in-, and post-field analyses that can be repeated as needed, or whenever newer technology becomes available to the researcher. The pre-field steps focus on installing all necessary frameworks, programs, and dependencies for the analysis, defining an area of study, creating spatial polygons that can be flown by the UAV available to the researcher, and exporting those polygons to the UAV remote. The in-field section provides general instructions on collecting images while in the field, and although not explicitly reproducible, the pre-field step ensures that the same information can be repeatedly collected by the same—or other—researchers. The post-field section highlights how easily images can be processed after returning from the field to produce a high-resolution digital terrain model of the study area.
Each of the short pre-, in-, and post-field sections describe the steps to execute the FOSS Protocol, and directions on how to install and execute the FOSS Protocol are provided online. Please refer to the Github repository to use the most current version.
PRE-FIELD: INSTALLING SOFTWARE AND DEFINING AN AREA OF INTEREST
The pre-field process is the most involved, requiring the installation of several programs on the project computer to create the spatial polygons that will be used while in the field for data collection. The installation instructions provided in the reproducible code are tailored to MacOS platforms, and they utilize the Homebrew file manager, although the same programs are available for PC and Linux operating systems. The protocol automatically uses the most up-to-date versions of each free and open-source software when available, and freely available software when open-source options are not available. The required frameworks and programs to run the FOSS Protocol successfully are Docker, Git, Python, GDAL, OpenDroneMap, and R. The combination of these six free and open-source programs will provide all necessary tools to process UAV-collected imagery and make high-resolution digital terrain models—for free.
After all necessary software is installed, all required R packages outlined in the reproducible code should be installed and loaded so that the study area of interest can be defined and spatial polygons exported. The process requires a shapefile that outlines a specific area of study, which can be created using freely available QGIS software if a shapefile is not already available. The reproducible code shows how to import the shapefile, divide it based on the typical battery life of the accessible UAV for the given project, download landcover data for the study area, and quantify landcover into four categories of increasingly canopied contexts. It then provides several scenarios for saving a spatial polygon for the desired UAV flight(s). These scenarios include exporting all potential flight polygons, exporting a specific polygon from a spatial grid, providing specific coordinates of an area of interest, or exporting polygons based on their landcover context.
Once the desired flight polygons have been created and saved, they should be imported into the DroneDeploy application (available for both iOS and Android) on the UAV remote, and draft flight plans can be created with each polygon. Specific flight parameters can be set up on the application before going into the field, which helps ensure a systematic and complete collection of the desired areas of interest for the study area.
Although this method provides explicit directions for using a combination of R, DroneDeploy, and OpenDroneMap, it is important to note that DroneDeploy can be substituted for any other UAV photogrammetry collection application available to the researcher that is compatible with the UAV and remote, as long as raw images are available for download after they are collected in the field. Please refer to the Github repository for alternative applications to DroneDeploy.
IN-FIELD: COLLECTING IMAGES
The setup completed in the pre-field step makes the in-field process as reproducible and easy as possible. The researcher brings the UAV to the flight area with the remote, memory card, and charged batteries, and instructs the UAV to launch from the desired flight plan within the DroneDeploy application.
POST-FIELD: PRODUCING A DIGITAL TERRAIN MODEL
After all images have been collected for each flight, images are transferred from the memory card to the project computer. Images are separated by flight collection polygon within a project folder, and within each of the flight collection polygon folders, all respective images are placed in a subfolder called “images.” Docker is then started and the OpenDroneMap algorithm is executed for images in a specified flight folder. OpenDroneMap will then produce a digital terrain model with the best resolution possible based on the images it is given. Although we provide a very simple and straightforward version of the OpenDroneMap algorithm in the reproducible code, there are a multitude of available processing options that we have not explicitly included (to ensure broad applicability), including the ability to define ground control points.
Resulting digital terrain models should then be critically examined by the researcher, and subsequent field episodes can be used to investigate previously unrecorded archaeological features, or reexamine features within the area of interest from the perspective provided in the terrain models. By repeatedly returning to the field, the researcher can also better contextualize the study area within the cultural landscape and reassess previous interpretations of the archaeological site of interest (Ainsworth et al. Reference Ainsworth, Oswald, Went, Optiz and Cowley2013; Doneus and Kühteiber Reference Doneus, Kühteiber, Optiz and Cowley2013; Halliday Reference Halliday, Optiz and Cowley2013; Poller Reference Poller, Gillings, Hacigüzeller and Lock2019). By automating the collection and processing of UAV imagery with the above protocol, data collection can be systematically repeated on-demand during site revisitation in cases of site monitoring, looting, tracking erosional changes, or if newer equipment becomes available.
COMPARING THE FOSS PROTOCOL AND PROPRIETARY SOFTWARE RESULTS
To assess the capabilities of the FOSS Protocol in comparison to leading proprietary software, we designed a controlled study that systematically collected images from the Mesa Verde North Escarpment—located in the northern US Southwest (Figure 1)—at three different flight heights in four landcover contexts, and we then processed the same groups of images using both FOSS (OpenDroneMap) and proprietary software (Agisoft PhotoScan Professional Edition). We outline this process below:
(1) A spatial polygon of the study area was loaded into the R environment.
(2) The National Landcover Dataset from the US Geological Survey was downloaded, and all types of landcover within the study area were ranked from the most-barren to the most-canopied types of vegetation.
(3) A numeric value was assigned to the ranked types of vegetation to reflect landcover that was most likely to produce a digital terrain model showing topographic detail (most-barren), to those that were least likely to produce topographic detail (most-canopied).
(4) The spatial polygon of the study area was partitioned into a 3 ha grid—a subjective number that was chosen so that all flights for a single vegetation context could be collected with the total number of batteries (3) we were able to bring into the field on a daily basis.
(5) The 3 ha grid was overlaid across the ranked landcover values.
(6) All values within each 3 ha polygon were then summed to produce a landcover “score” for each 3 ha polygon across the study area.
(7) The total range of scores was computed, and the minimum, maximum, and the two intermediate quartile values were identified. These are the color-coded landcover tiles shown in Figure 2, with light (green/most-barren), medium (yellow), heavy (orange), and extreme (red/most-canopied) levels of landcover. Four of these tiles were selected to be flown for this study—one in each representative landcover context (Figure 2, color-coded tiles outlined in black).
The four spatial polygons outlining each representative landcover context were then exported to the UAV controller. Flights at 20 m, 35 m, and 50 m flight heights were defined within the freely available DroneDeploy application, but all other settings within DroneDeploy were left at their default. After completing all UAV flights of a representative landcover context, a traditional full-coverage pedestrian survey of the corresponding area was performed, and all archaeological features were recorded.
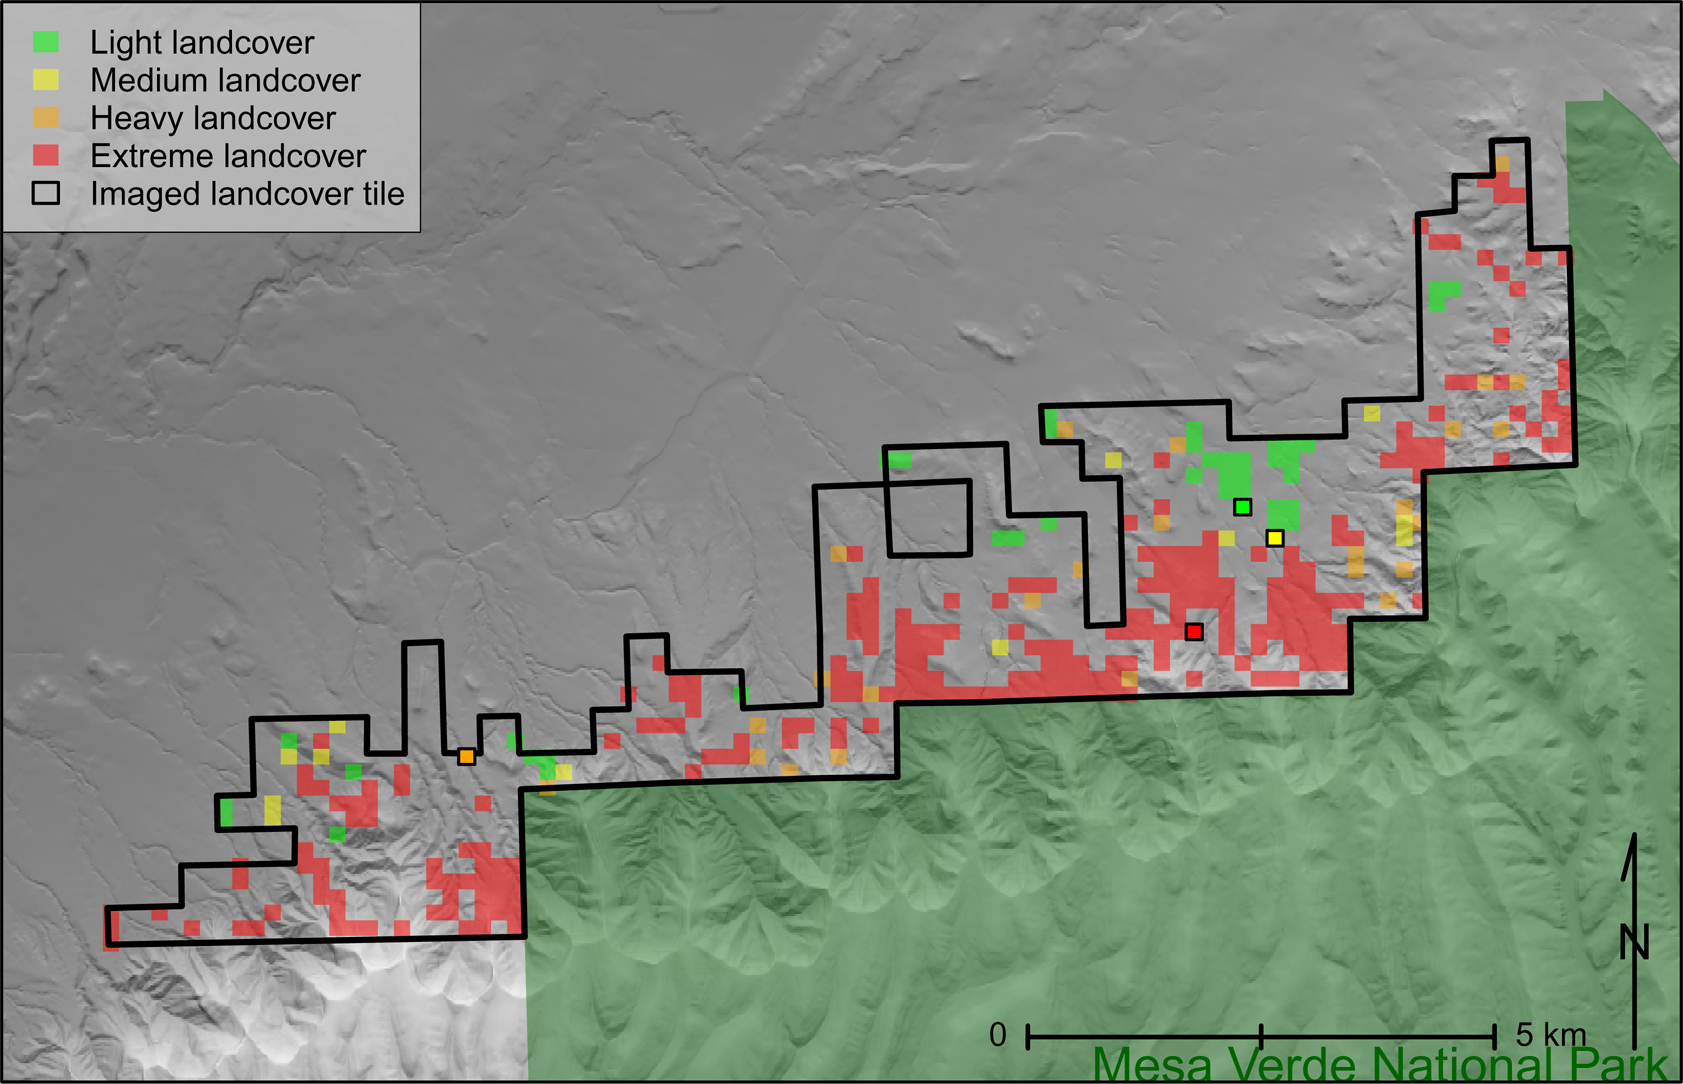
FIGURE 2. Landcover classifications on the Mesa Verde North Escarpment. Representative tiles across the North Escarpment for light (green/most-barren), medium (yellow), heavy (orange), and extreme (red/most-canopied) landcover contexts, and the four tiles presented in this analysis (outlined in black, in their respective colors).
Once the data collection was completed, we processed the same images in FOSS and proprietary software using two hardware configurations (3.6 GHz 8-Core Intel Core i9 with 128 GB RAM and 2.5 GHz 12-Core Intel(R) Xeon E5 Processor with 263.5 GB RAM, respectively), and we used the automated, default vegetation-removal algorithms in each program to create the resulting digital terrain models. A comparison of the resulting digital terrain models between the FOSS and proprietary software from the “heavy” landcover context at each flight height is shown in Figure 3, and the same comparisons for the three other landcover contexts are available as Supplemental Figures 1–3.
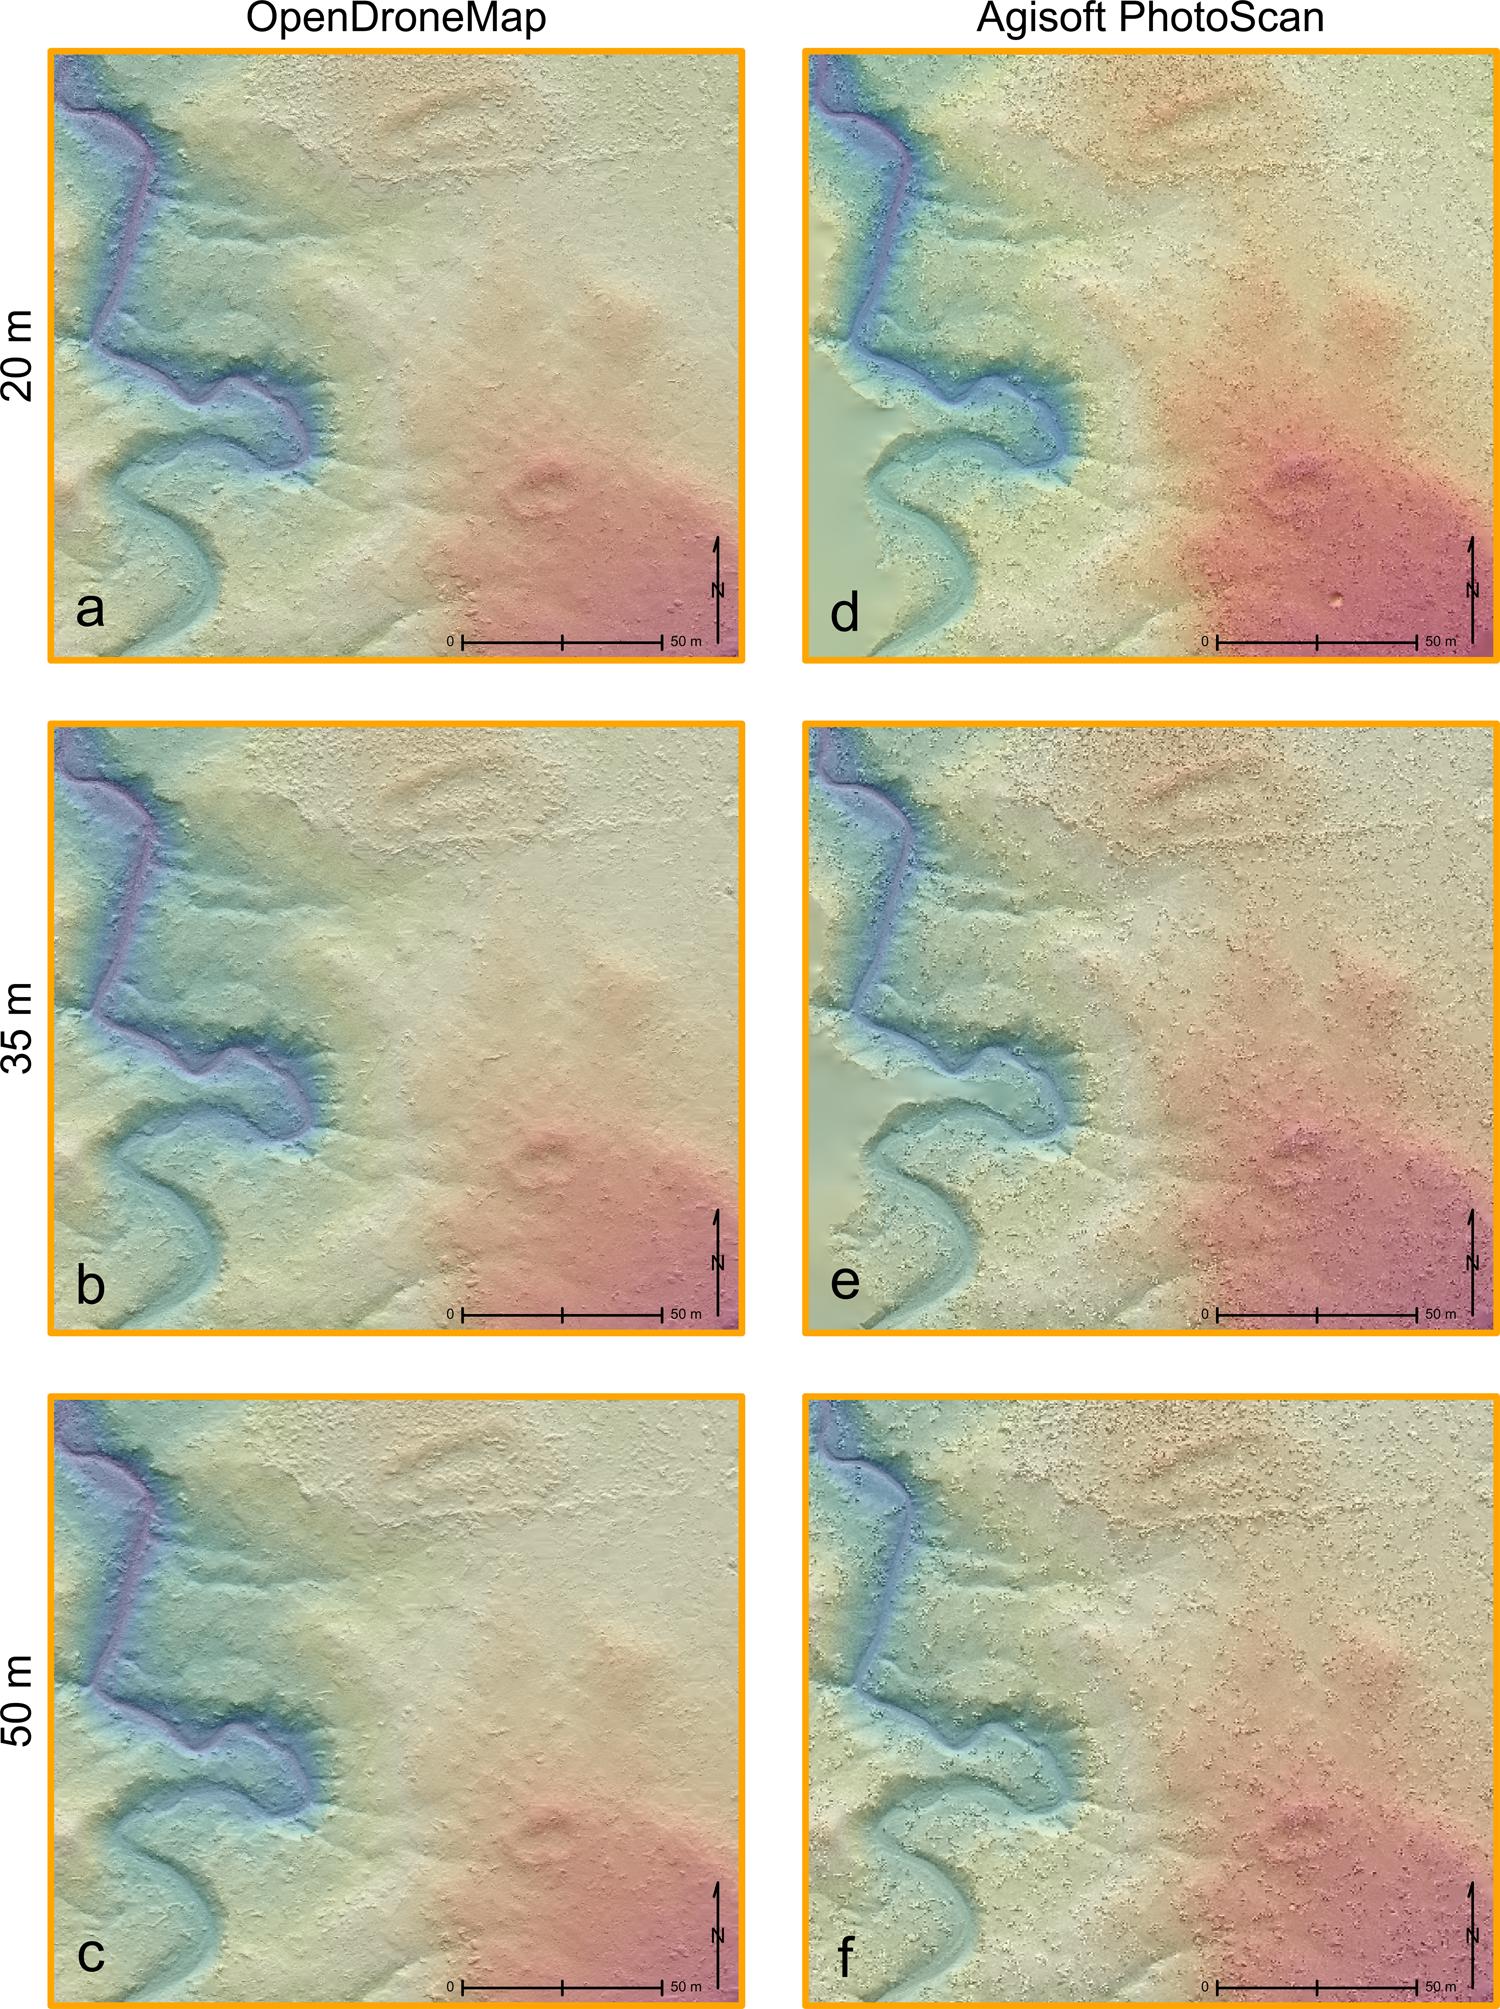
FIGURE 3. Results from the “heavy” landcover tile. A direct comparison of the digital terrain models, with vegetation removed, created from the “heavy” landcover tile. The left column shows the results from OpenDroneMap and the right from Agisoft PhotoScan (Professional Edition), each from 20 m, 35 m, and 50 m flight heights.
The results for each of the landcover contexts show that the FOSS Protocol is as effective as the proprietary software in revealing archaeological features that leave a topographic signature in “light,” “medium,” and “heavy” landcover contexts. Archaeological features are not visible in either the FOSS or proprietary digital terrain models from the “extreme” landcover context. This result may be due to the larger elevation range within this landcover tile compared to the other three, but we expect that even if the elevation were more uniform across the area, archaeological features underneath “extreme” landcover conditions would not be detected with passive remote sensing, such as UAV-based photogrammetry. Incomplete digital terrain models in the “medium” landcover context at the 20 m flight height (Supplemental Figure 2) are a result of neither the FOSS nor proprietary software being able to combine images from two different launch locations with different starting elevations—a consequence of underestimating the combined height of elevation change and tree height over the representative landcover tile while in the field. The proprietary software did process a portion of the collected images, whereas the FOSS software did not produce any results. The other two flight heights in the “medium” landcover context, however, are presented without issue. Each terrain model created using the FOSS Protocol at the 35 m flight height with the corresponding archaeological features recorded during pedestrian survey are shown in Figure 4.
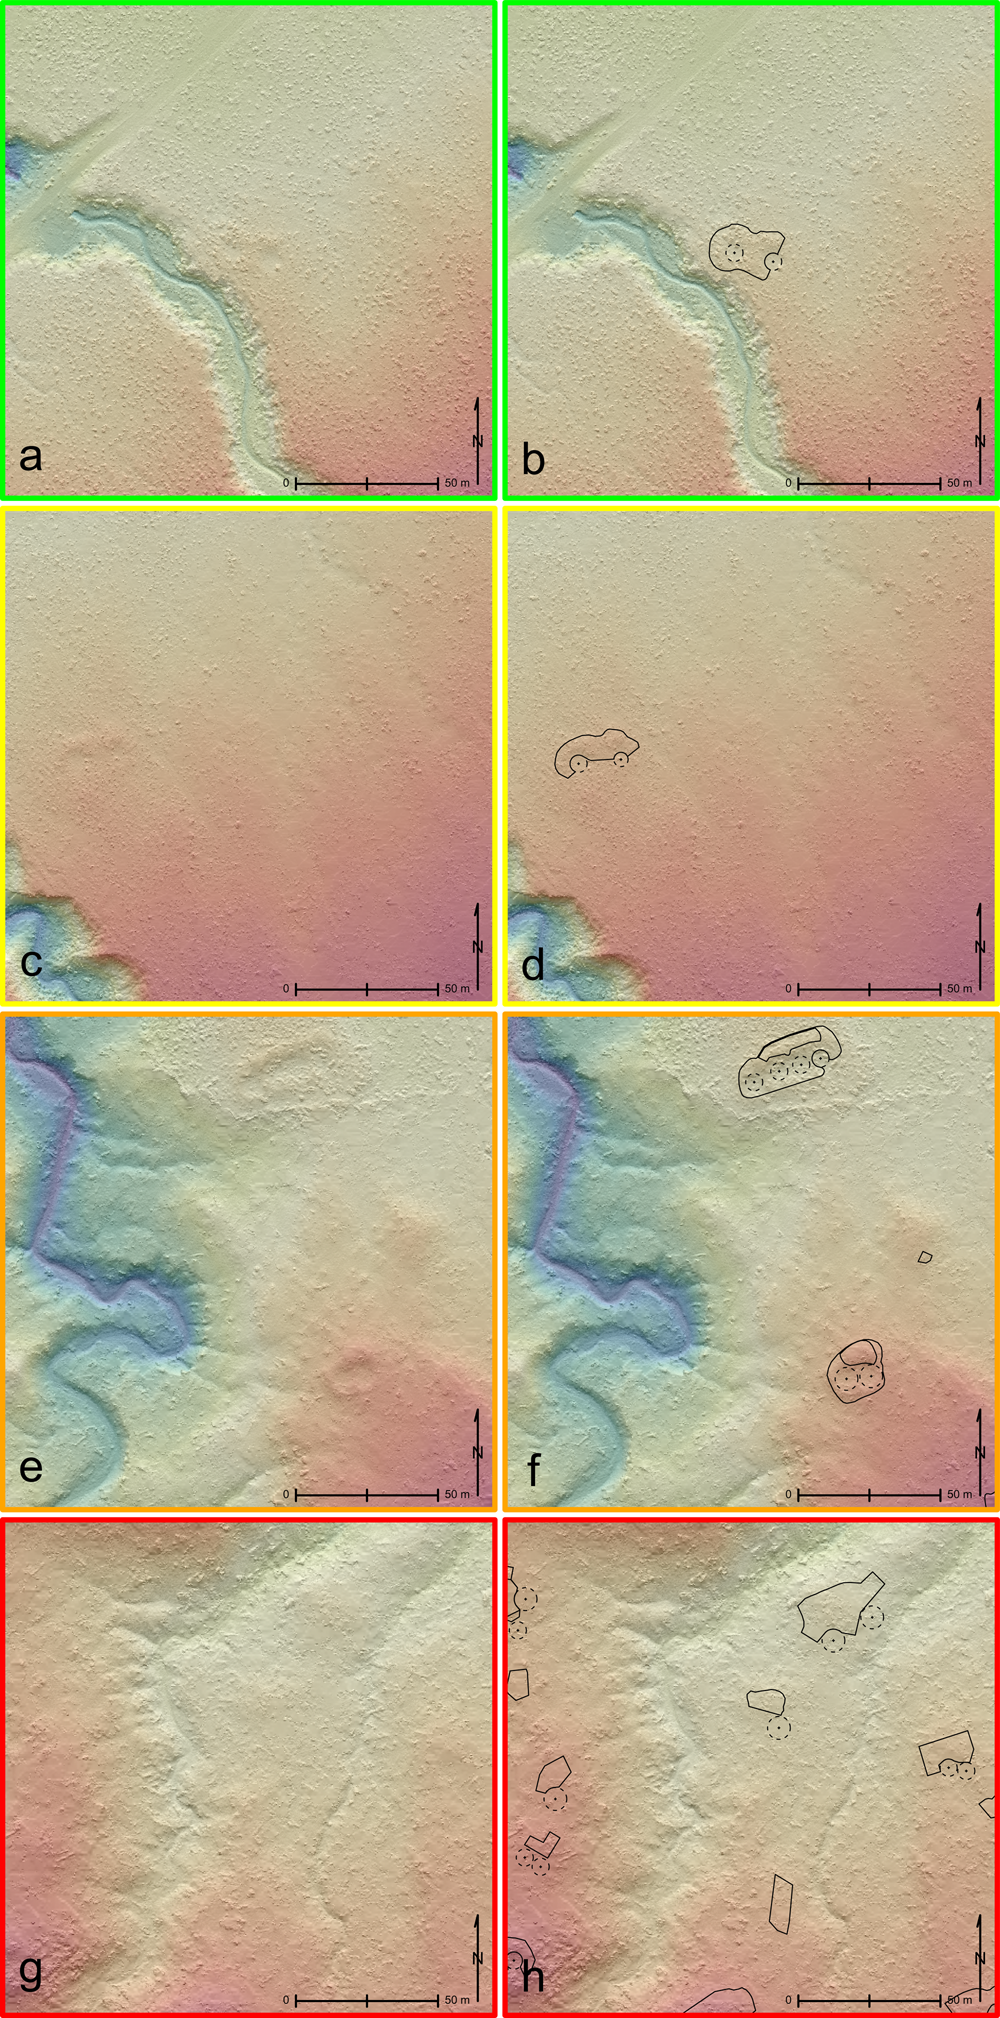
FIGURE 4. Mapped archaeological features in each landcover tile. A direct comparison of the digital terrain models in “light,” “medium,” “heavy,” and “extreme” landcover tiles collected at a 35 m flight height (left column) with the corresponding archaeological features identified during pedestrian survey (outlined in right column).
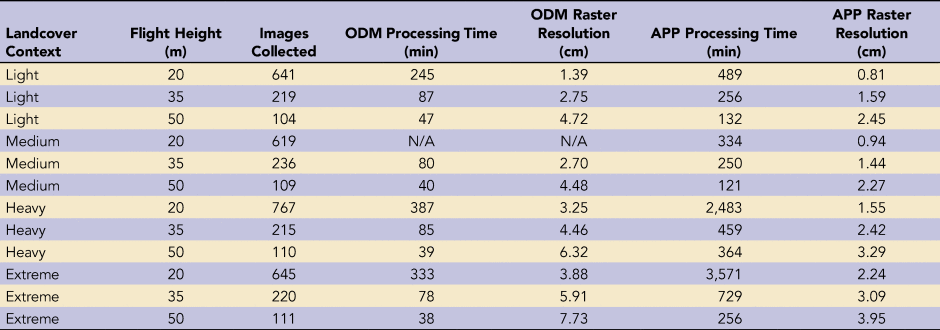
Although terrain visibility is arguably better from the FOSS software—and was produced in a shorter amount of processing time—the proprietary software consistently produced higher resolution terrain models in all flight height and landcover contexts (Table 1). Table 1 shows the results of a controlled comparison for image processing between FOSS and proprietary software, and it is meant to highlight the capabilities of freely available software. It is important to note, however, that processing times and raster resolutions will vary depending on the flight parameters for initial image collection and the exact equipment being used for processing. In our specific case, the level of resolution available in all resulting FOSS terrain models is more than adequate for identifying Ancestral Pueblo residential architecture constructed sometime between AD 900 and 1300—because this type of architecture leaves a clearly defined topographic signature. Higher-resolution digital terrain models can be more desirable depending on the types of archaeological features or artifacts that the researcher is trying to identify remotely, but unless the researcher is trying to identify small artifacts or submeter cultural features on the ground (Field et al. Reference Field, Waite and Wandsnider2017; Orengo and Garcia-Molsosa Reference Orengo and Garcia-Molsosa2019), centimeter-scale differences in resolution do not necessarily provide a proportionate return for the level of computational investment.
TABLE 1. Controlled Comparison of Run-Time and Processing Results between FOSS (ODM) and Proprietary (APP) Software.
Additionally, and counterintuitively, increased resolution in terrain models does not always result in a similar increase in visualization or accuracy of spatial analyses. Barbarash (Reference Barbarash, Buhmann, Ervin and Pietsch2012) has shown that “visualizations exhibiting a medium level of realistic detail conveyed an impression that subjects found to be only marginally less complete than . . . images with a high degree of realism detail” (Kullmann Reference Kullmann2014:3). Furthermore, Lock and Pouncett (Reference Lock and Pouncett2017) discuss how the use of high-resolution terrain models in least cost analyses actually decrease the representation of reality in resulting cost pathways. Typical least cost algorithms make decisions on paths of least resistance by calculating the difference in slope between the current cell and all surrounding cells (Tobler Reference Tobler1993; White and Surface-Evans Reference White and Surface-Evans2012), but real people on the ground do not make pathway decisions based on centimeter-scale changes in terrain elevation directly in front of their feet. Instead, they make pathway decisions based on what is visually forthcoming approximately 10 m away (Lock and Pouncett Reference Lock and Pouncett2017).
Regardless of the exact resolution of each terrain model created in this study, we can see that both the FOSS and proprietary software provide terrain models that are more than sufficient for the identification of cultural features that leave a topographic signature (Figure 4).
CONCLUSIONS
Collecting UAV-based imagery to produce high-resolution digital terrain models of localized landscapes is becoming increasingly common in archaeological research. To guide the growth of this technology in archaeological research contexts, we present the FOSS Protocol as a standardized, reproducible, and freely available aggregated toolset for collecting and processing UAV-based imagery. This collection of free and open-source software is demonstrably effective in producing high-resolution digital terrain models that are equal to—or better than—leading proprietary software. We intend for the FOSS Protocol to democratize accessibility to UAV-based data collection, and we encourage the pursuit of anthropologically based research questions with the resulting high-resolution digital terrain models.
Acknowledgments
The authors would like to thank the Department of Anthropology at the University of Notre Dame for providing the equipment and software we used in this study. We would also like to thank Brian Yaquinto for coordinating and encouraging the data collection phase of this project. All images collected for this project were done under Research Permit #C-79006 with the Bureau of Land Management, and access to these areas was facilitated by the generosity of private landowner Ann Hindmarsh. The lead author would like to thank the Santa Fe Institute for providing institutional support during the writing phase of this project. We would also like to thank Mark Golitko, Devin A. White, Matthew Sisk, and Vania Smith-Oka for substantive comments and discussion on earlier drafts of this paper.
Data Availability Statement
Spatial data used in this analysis were collected by the authors under Research Permit #C-79006 and are available upon request with permission from Brian Yaquinto at the Bureau of Land Management - Tres Rios Field Office (byaquinto@blm.gov). Installation instructions and a reproducible example are available on Github at kmreese-io/Reese_and_Field_2021-AAP.
Supplemental Material
For supplemental material accompanying this article, visit https://doi.org/10.1017/aap.2021.27.
Supplemental Figure 1. Results from the “light” landcover tile. A direct comparison of the digital terrain models, with vegetation removed, created from the “light” landcover tile. The left column shows the results from OpenDroneMap and the right from Agisoft PhotoScan (Professional Edition), each from 20 m, 35 m, and 50 m flight heights.
Supplemental Figure 2. Results from the “medium” landcover tile. A direct comparison of the digital terrain models, with vegetation removed, created from the “medium” landcover tile. The left column shows the results from OpenDroneMap and the right from Agisoft PhotoScan (Professional Edition), each from 20 m, 35 m, and 50 m flight heights.
Supplemental Figure 3. Results from the “extreme” landcover tile. A direct comparison of the digital terrain models, with vegetation removed, created from the “extreme” landcover tile. The left column shows the results from OpenDroneMap and the right from Agisoft PhotoScan (Professional Edition), each from 20 m, 35 m, and 50 m flight heights.


 Open access