


1. Introduction
The formation of drops has become a paradigm for the study of singularities in fluid mechanics and beyond. The formation of a drop from an orifice leads to a new length scale, the diameter of the neck that connects the drop to the orifice, which goes to zero at a finite time when the drop breaks off from the orifice. As a result, pinch-off is described by a similarity solution that describes the time evolution and self-similar shape of the neck close to breakup. In the case of Newtonian fluids of both large and small viscosity, the neck diameter behaves like a power law as a function of the time to pinch-off. The interface is found to have a universal shape, and profiles at different times can be superimposed onto one another by rescaling the radial and axial coordinates by appropriate powers of the time distance to the singularity.
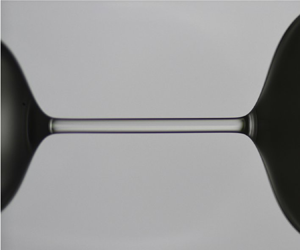
Beyond Newtonian fluids, much work has been dedicated to the formation of drops in non-Newtonian fluids such as polymer solutions. These fluids are characterized by a slow time scale  $\lambda$ on which the constituents relax. If one takes a dilute solution of a high-molecular-weight polymer and tries to make a droplet (Middleman Reference Middleman1965; Goldin et al. Reference Goldin, Yerushalmi, Pfeffer and Shinnar1969; Petrie & Denn Reference Petrie and Denn1976; Eggers Reference Eggers1997; Deblais, Velikov & Bonn Reference Deblais, Velikov and Bonn2018), polymers become stretched in the extensional flow close to pinch-off, and long and slender filaments form in between drops, where previously power-law pinch-off would have been observed (Goldin et al. Reference Goldin, Yerushalmi, Pfeffer and Shinnar1969; Bazilevskii et al. Reference Bazilevskii, Voronkov, Entov and Rozhkov1981; Entov & Yarin Reference Entov and Yarin1984; Wagner et al. Reference Wagner, Amarouchene, Bonn and Eggers2004; Clasen et al. Reference Clasen, Eggers, Fontelos, Li and McKinley2006; Bhat et al. Reference Bhat, Appathurai, Harris, Pasquali, McKinley and Basaran2010). In the case of a jet, this means a long sequence of almost circular drops form, connected by tiny threads, a phenomenon that has been called the ‘beads-on-a-string’ structure. In the case of a dripping tap (faucet), one observes essentially the same phenomenon, except that here only a single drop forms, with perhaps a satellite drop in between (Wagner et al. Reference Wagner, Amarouchene, Bonn and Eggers2004), connected to the tap (faucet) by a tiny thread, as seen in figure 1(a,b).

Figure 1. (a) Schematic of the experimental set-up used to determine the interface shape of the polymer thread. A full-frame camera is combined with a flashlight allowing short flash duration. The flash is triggered on the falling drop and a high-accuracy delay line allows one to follow the breakup event in time by taking pictures at different delays. (b) Typical photograph of a pendent drop of a very dilute polymer solution breaking from a syringe. A long tiny polymer thread connecting the two drops is formed. Scale bar is 1 mm. (c) Self-similar thinning of the interface profiles obtained from the experimental work of Clasen et al. (Reference Clasen, Eggers, Fontelos, Li and McKinley2006) and the simulations of Turkoz et al. (Reference Turkoz, Lopez-Herrera, Eggers, Arnold and Deike2018). Here  $z_{0}$ is the axial location for which the profiles collapse best. The comparison reveals a discrepancy between the two. Figure adapted from Turkoz et al. (Reference Turkoz, Lopez-Herrera, Eggers, Arnold and Deike2018).
This and similar phenomena are often modelled using the so-called Oldroyd-B model (Bird, Armstrong & Hassager Reference Bird, Armstrong and Hassager1987), which describes the polymer relaxation with a single time scale  $\lambda$. The stress is written as the sum of a polymeric contribution and that of the solvent.
The formation of filaments and their instabilities have by now become a benchmark problem for testing viscoelastic fluid mechanics (Anna & McKinley Reference Anna and McKinley2001; McKinley & Sridhar Reference McKinley and Sridhar2002; Furbank & Morris Reference Furbank and Morris2004; Suryo & Basaran Reference Suryo and Basaran2006; Smith et al. Reference Smith, Besseling, Cates and Bertola2010; Huisman, Friedman & Taborek Reference Huisman, Friedman and Taborek2012; Miskin & Jaeger Reference Miskin and Jaeger2012). Instead of following a power law, the filament now thins exponentially with a rate set by the relaxation time of the polymer (Bazilevskii et al. Reference Bazilevskii, Voronkov, Entov and Rozhkov1981; Anna & McKinley Reference Anna and McKinley2001; Clasen et al. Reference Clasen, Eggers, Fontelos, Li and McKinley2006). The profile is extremely uniform over the thread, and then merges smoothly with a neighbouring drop on either side. It was proposed by Clasen et al. (Reference Clasen, Eggers, Fontelos, Li and McKinley2006) that the profile at this junction is once more a similarity solution, which yields a universal profile, if both the axial and the radial coordinates are rescaled with the thread radius, with an exponential rise towards the drop (figure 1c). Clasen et al. (Reference Clasen, Eggers, Fontelos, Li and McKinley2006) were able to calculate the similarity profile using a lubrication approximation, in which the interface slope is assumed small; however, this assumption of small slopes is not satisfied throughout the profile. Indeed, while an experiment using long flexible polymers in a viscous solvent showed collapse to a self-similar profile, a comparison with the theoretical calculation revealed an axial length scale in the experiment that was about twice as short as the one obtained from lubrication theory (figure 1c). At the time, this serious discrepancy in the self-similar profile was attributed to a failure of the lubrication approximation.
However, a recent full numerical simulation of the Oldroyd-B equations (Turkoz et al. Reference Turkoz, Lopez-Herrera, Eggers, Arnold and Deike2018) showed the same discrepancy with the experimental data of Clasen et al. (Reference Clasen, Eggers, Fontelos, Li and McKinley2006), and rather agreed with the lubrication calculation (figure 1c). This left the serious possibility that the source of the discrepancy was the Oldroyd-B model itself. One possibility was that the experimental fluid was described by more than a single length scale, the other that the finite extensibility of a real polymer has to be taken into account, as described, for example, by more elaborate models such as the FENE-P model (Bird et al. Reference Bird, Armstrong and Hassager1987), which also describes the shear-thinning behaviour of a real polymeric fluid.
More recently, the similarity theory of Clasen et al. (Reference Clasen, Eggers, Fontelos, Li and McKinley2006) was extended to a treatment of the full axisymmetric Oldroyd-B equations, and the similarity profile was calculated without any lubrication assumptions (Snoeijer et al. Reference Snoeijer, Pandey, Herrada and Eggers2019). The robustness of these calculations was also underlined by the observation that the universal interface shape even holds for purely elastic filaments undergoing elasto-capillary instabilities (Snoeijer et al. Reference Snoeijer, Pandey, Herrada and Eggers2019; Eggers, Herrada & Snoeijer Reference Eggers, Herrada and Snoeijer2020) that could be dubbed sausage-on-a-string instabilities (Mora et al. Reference Mora, Phou, Fromental, Pismen and Pomeau2010; Kibbelaar et al. Reference Kibbelaar, Deblais, Burla, Koenderink, Velikov and Bonn2020). These findings suggest that the specific type of viscoelastic model for the polymer solution is not crucial for calculating the shape of the interface, and hence could not explain the discrepancy between theory and experiment.
To clear up these questions, we investigate the breakup of very dilute polymer solutions. We record the interface profiles of the filaments at an extremely high temporal and spatial resolution during the experiments, and compare the results with the newly developed similarity theory of Eggers et al. (Reference Eggers, Herrada and Snoeijer2020), based on the full Oldroyd-B equations. Our results convincingly show that the experimental profiles all converge to a universal self-similar solution that in addition agrees excellently with theory.
2. Experiments
We experimentally study the extensional thinning and destabilization of filaments of long-chain polymer solutions in water at different concentrations (figure 2). The experiments are performed with polyethylene oxide (PEO) with a molecular weight ( $M_{w}$) of $(4 \pm 2) \times 10^{6}\ \textrm {g}\,\textrm {mol}^{-1}$ (Berman Reference Berman1978) from Sigma-Aldrich ( $\textrm {purity}=0.98$). Four concentrations $C_{p}$ between 10 and 120 w.p.p.m. (weight parts per million) are obtained from successive dilutions of the initial batch. This range of concentrations is chosen to be well below the critical overlap concentration of polymer coils (Graessley Reference Graessley1980):
 \begin{equation} c^{*} = \frac{0.77}{[\eta]}, \end{equation}
with  $[\eta ]$ the intrinsic viscosity of the polymer solution (see details in table 1, from Del Giudice, Haward & Shen (Reference Del Giudice, Haward and Shen2017)). The concentrations we consider allow us to work in conditions that are very close to satisfying the Oldroyd-B model, as we will show below. A syringe pump supplies the polymer solutions to the needle tip (inner diameter $h_{0}=2$ mm).
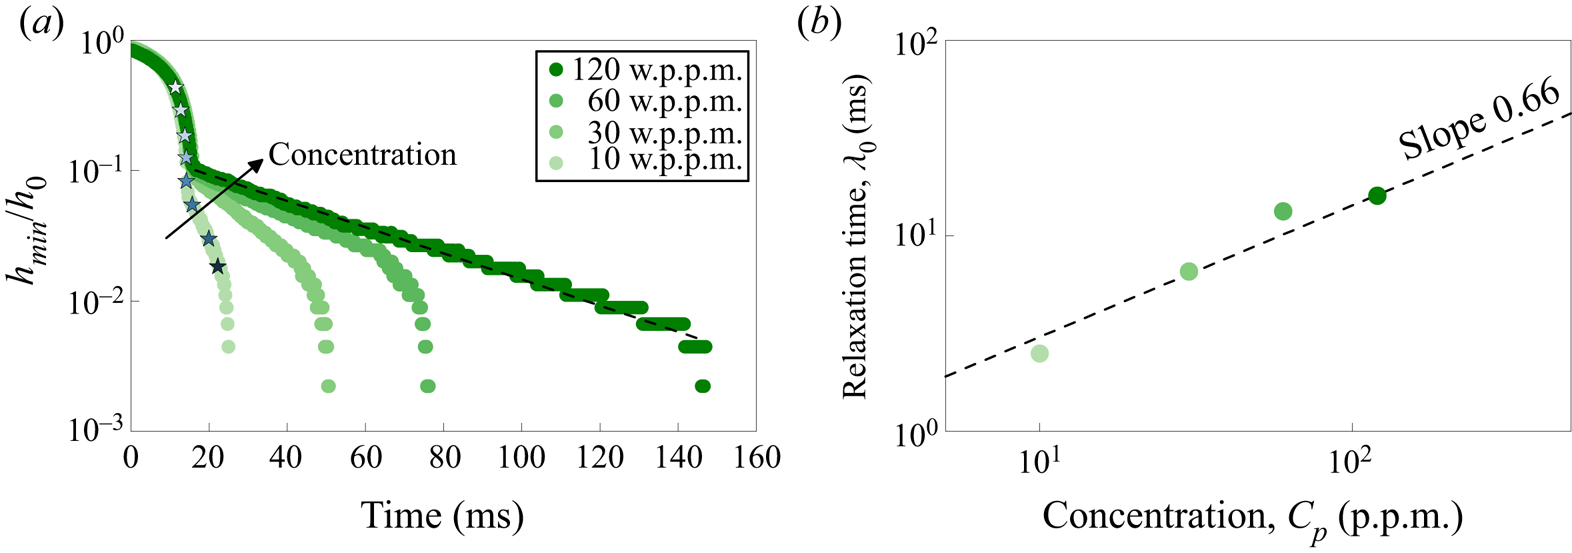
Figure 2. Thinning dynamics of a filament of four concentrations of polyethylene oxide in water. (a) Symbol colours, from light to dark: 10, 30, 60 and 120 w.p.p.m. (weight parts per million). The minimum neck radius  $h_{min}$ is tracked in time and normalized by the inner radius $h_{0}$ of the syringe orifice; the longest relaxation time of the solution $\lambda _{0}$ is deduced from the slope of the elasto-capillary regime highlighted by the dashed black line. (b) Relaxation time $\lambda _{0}$ as a function of the concentration $C_{p}$. The dashed line is a power-law fit to the experimental points $\lambda _{0} \propto C_p^{0.66}$.
We used a Phantom V1 fast camera (frame rate 10 000 frames per second) to record the dynamics of the filament thinning at a high temporal resolution, and a full-frame camera ( $8256\ \textrm {pixel} \times 4640\ \textrm {pixel}$, Nikon D850) equipped with a $5\times$ microscope lens to obtain a very good spatial resolution of the polymer interface during its detachment. In order to be able to capture high-quality pictures of the interface during the fast thinning ( $\sim$ milliseconds), we use a flashlight (Vela one) with $1\ \mathrm {\mu } \textrm {s}$ flash duration. The camera and the flashlight are coupled to a trigger to which we can control the delay to the next breakup event with a very good accuracy. The delay between two flashes is controlled through a precise delay line (Digital Delay Generator, DG535 Stanford Research Systems) that delays the initial trigger pulse (the event is triggered electronically on each bottom edge of droplets falling in repetition) and allows a delay resolution from 5 ps to 1000 s. The limiting factor here is the flash duration of 1 $\mathrm {\mu }$s of the flashlight itself. The shutter of the camera is open for a ‘long’ time during the flash, and so the read-out time of the camera is not a limiting step. This allow us to obtain a sequence of very highly resolved pictures (10 $\mathrm {\mu }$m pixel $^{-1}$) as one would obtain with a fast camera but with a much better resolution (see sequence of pictures in figure 3).

Figure 3. High-resolution photographs of a pendent drop of PEO solution ( $M_{w} =$ $4 \times 10^{6}\ \textrm {g}\ \textrm {mol}^{-1}$, $C_{p}= 10$ w.p.p.m.) breaking from a nozzle of diameter $h_{0} = 2$ mm. The time between subsequent panels (a–d) is 1 ms. Scale bar is 2 mm. Panel (e) highlights the region of interest from which we extract the profile shown in panel (f). Scale bar is 1 mm.
Typical results are shown in figures 2 and 3. The thinning dynamics (figure 2) of PEO show an initial thinning similar to that of a low-viscosity Newtonian fluid. Subsequently, a very long and slender cylindrical filament is formed. In this elasto-capillary thinning regime, the dynamics slows down dramatically. Both the Oldroyd-B model and experiments show that in this regime the minimum neck radius  $h_{min}$ as a function of time can be described as
 \begin{equation} h_{min} = h_{0}\,\textrm{e}^{-t/3 \lambda_{0}}, \end{equation}
with  $\lambda _{0}$ the longest relaxation time of the polymer solution (Amarouchene et al. Reference Amarouchene, Bonn, Meunier and Kellay2001; Anna & McKinley Reference Anna and McKinley2001). In the range of (very) diluted concentrations studied here, $\lambda _{0}$ varies with concentration between $\sim$1 and 50 ms. Even though in the dilute limit a variation of the relaxation time is not predicted by theory, this is in fact commonly observed in experiments (Clasen et al. Reference Clasen, Eggers, Fontelos, Li and McKinley2006). This is confirmed by plotting the dependence of the relaxation time $\lambda _{0}$ with the polymer concentration $C_{p}$ in figure 2(b), showing that it follows a power-law dependence as reported by Clasen et al. (Reference Clasen, Eggers, Fontelos, Li and McKinley2006) for dilute polymer solutions.
Figure 3 shows a typical sequence of pictures of a droplet's interface, obtained using the combination of fast camera and triggered flash to increase the resolution. We use these photographs to extract the interface profile with a homemade algorithm in MATLAB; this procedure allows determination of the edges of the polymer solution as shown in figure 3(f).
3. Results
In figure 4(a) we show the evolution of the interface profile during filament thinning, near the drop that forms due to destabilization. Here,  $r$ is the filament radius and $z$ the direction along the filament. In figure 4(b), we plot the same profiles but rescaled by the minimum neck radius $h_{min}$ and with $z_{0}$ an adjustable parameter that represents the location for which the experimental profiles collapse best. As time progresses, the interface shape converges to a universal shape. Comparing this shape to the recent viscoelastic calculations using the Oldroyd-B model (Eggers et al. Reference Eggers, Herrada and Snoeijer2020), we find an excellent agreement: the profiles converge to the same universal self-similar solution profile indicated by the black line. We quantify the threshold to the self-similar solution by measuring the distance $\Delta (t)$ of the experimental profiles to the self-similar curve at $r/h_{min}=\exp (1)$. This quantity is shown in the inset of figure 4(b) and converges to a constant value at the moment where the elasto-capillary regime is reached. Since the onset is set by the elasto-capillary time, a dependence with the polymer concentration $C_{p}$ is expected. In figure 4(c), we show the profiles after converging for different polymer concentrations. They fall onto each other, confirming the self-similarity of the polymer thread interface. Here, again, agreement with theory (black line) is excellent; this also confirms that the profile grows exponentially, as discussed in detail in Eggers et al. (Reference Eggers, Herrada and Snoeijer2020).

Figure 4. (a) Time evolution of PEO filament profiles near the onset of the filament. Data are shown for subsequent times between each profile that are highlighted in figure 2(a) (star symbols) and for  $C_{p} = 10$ w.p.p.m. (b) Same profiles but rescaled by the minimum neck radius $h_{min}$ and with $z_{0}$ the location for which the experimental profiles beyond a time threshold collapse onto each other. The inset shows the convergence of the quantity $\Delta (t)$ towards the self-similar solution. (c) Post-threshold profiles for four polymer concentrations in the dilute regime. In panels (b) and (c), the solid black line indicates a universal self-similar solution calculated using the Oldroyd-B model.
Solving the constitutive equation for a Hookean dumbbell model, a quadratic dependence of the first normal stress difference  $N_1$ on shear rate $\dot {\gamma }$ can be obtained (Bird et al. Reference Bird, Armstrong and Hassager1987):
 \begin{equation} N_{1}(\dot{\gamma}) = \psi_{1} \dot{\gamma}^{2} = 2 n k_{B} T \lambda_{0,{rheo}}^{2} \dot{\gamma}^{2}, \end{equation}
with  $T$ denoting temperature, $\psi _1$ the first normal stress coefficient, $n$ the number density of polymer molecules (table 1) and $k_B$ Boltzmann's constant. The rheology measurements (Anton Paar, MCR 302) shown in figure 5(a) show that the increase in polymer concentration slightly influences the shear viscosity, in agreement with Einstein expansion, whereas it significantly affects the normal force (figure 5b), from which we can extract the relaxation time of the solution $\lambda _{0,{rheo}} = 7.4$ ms (Lindner, Vermant & Bonn Reference Lindner, Vermant and Bonn2003). This is a factor $\sim$2 below the value obtained with the relaxation time obtained from the pinch-off experiment ( $\lambda _{0}= 14.5$ ms). Such discrepancies have already been reported before by Clasen et al. (Reference Clasen, Eggers, Fontelos, Li and McKinley2006). The primary reason for the discrepancy is that high-molecular-weight polymers invariably exhibit a significant polydispersity, which may result in multiple time scales; the elongational flow is more sensitive to the longest time scale, whereas the shear flow probes an average time scale. We can nevertheless evaluate the ratio between these two time constants using the multimode Zimm model:
 \begin{equation} \langle \lambda \rangle \approx \lambda_{0,{rheo}} = \frac{1}{N} \sum_i \lambda_{i} = \frac{1}{N} \sum_i \frac{\lambda_{0}}{i^{2+\tilde{\sigma}}}, \end{equation}
where  $N$ is the total number of modes and $\tilde {\sigma }$ is a measure of the hydrodynamics interaction, with $\tilde {\sigma }\approx -0.4$ in our dilute polymer solutions (Anna & McKinley Reference Anna and McKinley2001). This time quickly decays for the higher modes; evaluating the ratio between the two time scales for the five first modes gives a good approximation. In fact, this gives a value of $\lambda _{0,{rheo}} / \lambda _{0}\approx 3$, which is a good estimate of what we find experimentally and is a value also reported experimentally by Liang & Mackley (Reference Liang and Mackley1994).

Figure 5. (a) Shear rheology of a PEO solution (green symbols;  $M_{w} =4\times 10^{6}$ g mol $^{-1}$, $C_p = 120$ w.p.p.m.) compared to water (blue symbols) for shear-rate values allowed by our experimental set-up. (b) Magnitude of the first normal stress difference $N_{1}$ as a function of shear rate for a PEO solution ( $C_p=120$ w.p.p.m.). Dashed line is a fit of the Oldroyd-B model (3.1).
Table 1. Physical parameters of the polymer solutions investigated (PEO) with a molecular weight of  $M_{w} = 4 \times 10^{6}\ \textrm {g}\ \textrm {mol}^{-1}$.

4. Conclusions
In conclusion, we have studied the destabilization of diluted polyethylene oxide (PEO) solution in water using a camera set-up allowing us to visualize the droplet and filament shapes with very high resolution. We find that, during destabilization of a polymer droplet initially attached to a capillary, the interface converges to a self-similar shape independent of time or polymer concentration, which agrees very well with the theoretical prediction of Eggers et al. (Reference Eggers, Herrada and Snoeijer2020), based on the Oldroyd-B model. This contrasts with an earlier discrepancy, observed in Turkoz et al. (Reference Turkoz, Lopez-Herrera, Eggers, Arnold and Deike2018), between full numerical simulations of the Oldroyd-B model and the earlier experiments of Clasen et al. (Reference Clasen, Eggers, Fontelos, Li and McKinley2006).
Three main differences between our experiment and that of Clasen et al. (Reference Clasen, Eggers, Fontelos, Li and McKinley2006) can be mentioned that might explain the observed discrepancy. (i) In the work presented here we are now able to work at significantly higher spatial and temporal resolution than they could do at the time. (ii) The second important difference to note is the solvent used, which is much more viscous than the one we use in our study (water) and also exhibits non-Newtonian behaviour (‘Boger fluid’). (iii) They used a Caber device to impose an extensional deformation to their samples. For that purpose, they used endplate diameters up to 6 mm (three times our nozzle diameter  $D_{min}$). As a consequence, gravitational and inertial effects may have an effect on the overall extensional flow: it consequently may generate additional flows during the thinning of the filament and affect the profile of the interface, as discussed for instance in Brady & Acrivos (Reference Brady and Acrivos1982).
Acknowledgements
A.D. acknowledges funding from the EU's Horizon 2020 research and innovation programme under the Individual Marie Skłodowska-Curie fellowship grant agreement 798455. M.A.H. acknowledges the support of the Junta de Andalucia through grant P18-FR-3623.
Declaration of interests
The authors report no conflict of interest.


 Open access