


Introduction
Studies assessing engineering bottlenecks of automation (Frey and Osborne, Reference Frey and Osborne2013, Reference Frey and Osborne2017; Arntz et al., Reference Arntz, Gregory and Zierahn2016; Nedelkoska and Quintini, Reference Nedelkoska and Quintini2018) have suggested that digital technologies and artificial intelligence (AI) may displace a considerable number of work tasks in the coming decades. While many authors (e.g. Brynjolfsson and McAfee, Reference Brynjolfsson and McAfee2014; Ford, Reference Ford2015) have noted that the digital transformation may also have substantial socio-economic implications for welfare states, researchers have not studied the question in much detail. Very little is currently known about the implications of divergent employment scenarios for government budgets, poverty or economic inequality. The main purpose of this paper is to fill this knowledge gap by comparing the socio-economic indicators in the European Union member states and the United Kingdom (henceforth the EU-28) in two ideal-type scenarios that reflect the divided expert view on long-term employment development. The pessimistic scenario assumes technological mass unemployment to constitute a permanent problem over the next two decades; while the optimistic one illustrates a future in which unemployment has been reduced by half, due to positive spillover effects deriving from the technological change.
Hence, the research question addressed in this article is as follows: What are the possible implications of a technological mass unemployment scenario and an optimistic employment scenario for government revenues, social expenditures, budget balances, population-level poverty rates, and Gini coefficients for disposable income in the EU-28 countries?
To conduct the research, we develop a methodological approach utilising applicable mean probabilities of automation by occupation (Nedelkoska and Quintini, Reference Nedelkoska and Quintini2018, p. 51) to specify the technological unemployment scenario, a micro imputation technique to construct the scenarios, and the European Union tax-benefit microsimulation model EUROMOD (Sutherland and Figari, Reference Sutherland and Figari2013) to simulate income transfers in the scenarios. We compare the socio-economic implications by ranking the countries by each indicator.
The reader should bear in mind that this study does not predict labour market outcomes. Instead, the purpose of this paper is to examine between-country differences in socio-economic risks, but also opportunities deriving from divergent occupational structures and social policy systems. In other words, we seek to explore whether certain European welfare states are particularly fit for purpose in hypothetical counterfactual scenarios that reflect the current digital economy debate. An apparent limitation of our study is that it does not consider plausible policy changes introduced in response to employment changes.
We have divided this paper into five parts. The subsequent section discusses the polarised nature of the future of work predictions and how we reflect that in our scenario-building. This is followed by the methodology and data section, in which we describe the specification of the formulated ideal-type scenarios, construction of the scenarios with a micro imputation technique, the microsimulation method, and the analysed socio-economic indicators. We also critically examine the methodological limitations entailed by the approach that we develop in this paper. The fourth section presents the main results, focusing on each socio-economic indicator one by one. Finally, we summarise our main findings, discuss the policy implications and make recommendations for further research work.
Identifying ideal-type scenarios
Although the view of more capable technologies is widely shared among scholars and tech experts, literature reviews suggest that opinions on long-term employment development are divided. To illustrate the foremost divisions in the current debate, Pulkka (Reference Pulkka2017, Reference Pulkka2019) has formulated two ideal-type scenarios in his recent research papers – a pessimistic scenario assuming permanent technological (mass) unemployment and an optimistic scenario suggesting positive employment development (see also Greve, Reference Greve2017, p. 123–128 for a similar approach).
Advocates of the pessimistic scenario maintain that due to the exceptional pace of the development and non-routine tasks becoming increasingly automatable (e.g. Brynjolfsson and McAfee, Reference Brynjolfsson and McAfee2014, p. 39–56; Ford, Reference Ford2015, p. 63–81), education and reskilling become inadequate measures to guarantee people’s employability in the long term. Followers of this scenario may also point out that digital platforms provide employers with an economic incentive to optimise their production and organise work in smaller units, thus intensifying the negative impact of the digital economy.
While the advocates of the optimistic scenario may acknowledge that the automation of work tasks is likely to become more widespread, they also believe that positive spillover effects will stabilise or even improve the development (e.g. Bessen, Reference Bessen2015; Stewart et al., Reference Stewart, Debapratim and Cole2015; Gregory et al., Reference Gregory, Salomons and Zierahn2016; EC, 2019). What this means is that innovation-driven sectors are assumed to flourish, leading to their expansion and duly increasing the demand for labour within them. As a result of more efficient production, consumer prices can be lowered in the innovation-based sectors and consumers can re-allocate their resources to other sectors. This again increases demand in labour-intensive sectors. In addition to the positive spillover effects, some advocates of this scenario also point out that instead of entire jobs, it is more likely that independent tasks will be automated and the task contents of jobs evolve (e.g. Autor, Reference Autor2015).
Historically speaking, technological revolutions have improved people’s standard of living in the long term, although transition phases have been unfavourable for some workers (Allen, Reference Allen2017). Considering available evidence (e.g. EC, 2019), the record-high employment level in the EU before the COVID-19 crisis (Eurostat, 2020) and the marginal role of platform work (Urzí Brancati et al., Reference Urzì Brancati, Pesole and Fernández-Macías2019), it is reasonable to argue that likelihood of the technological mass unemployment scenario is lower than that of the optimistic one.
At the same time, new technologies often encounter implementation and restructuring lags (Brynjolfsson et al., Reference Brynjolfsson, Rock and Syverson2017), which suggests that the most disruptive changes may remain to be seen. Furthermore, current statistics have inadequacies when it comes to measuring technology-induced changes in employment (Mitchell and Brynjolfsson, Reference Mitchell and Brynjolfsson2017). Due to plausible implementation and restructuring lags, lacking evidence concerning the actual potential of recent technologies to automate work tasks, and manifold societal factors inevitably affecting employment development, long-term predictions are highly speculative. In such context, we maintain that simulating a technological unemployment scenario is reasonable regardless of the evidence concerning the implications of previous technological changes. By simulating a mass unemployment scenario, we also develop a better understanding of the differences between European social policy systems in their adaptability to major unemployment crises – most recently illustrated by the COVID-19 pandemic.
The specification for the scenarios is described in the next section.
Methodology and data
In order to compare the socio-economic implications of the identified scenarios, we have developed a methodological approach combining the mean probabilities of automation by occupation, a micro imputation technique to construct the scenarios, and the European Union microsimulation model EUROMOD to simulate income transfers in the scenarios. Below, we explain the research process step by step, and also discuss the methodological limitations of the developed approach.
Specifying the identified scenarios
In the first phase of the research process, we have specified the ideal-type scenarios identified in the previous section. In other words, we have determined the parameters that we will use to simulate the technological mass unemployment and the optimistic employment scenario. To specify the technological unemployment scenario, we have utilised the mean probabilities of automation by occupation estimated by Nedelkoska and Quintini (Reference Nedelkoska and Quintini2018, p. 51). To our knowledge, these automation risk estimates are the most applicable if not the only alternative given the aggregated occupational information from the European Union Statistics on Income and Living Conditions (EU-SILC)-based microdata utilised in European-level microsimulation studies.
The automation risk estimates provided by Nedelkoska and Quintini (Reference Nedelkoska and Quintini2018) build on technology expert assessments of engineering bottlenecks first used by Frey and Osborne (Reference Frey and Osborne2013, Reference Frey and Osborne2017). The study also further develops a task-based approach introduced by Arntz et al. (Reference Arntz, Gregory and Zierahn2016) as a critique of the occupation-based approach of Frey and Osborne (Reference Frey and Osborne2013, Reference Frey and Osborne2017). Instead of analysing the task contents of standardised occupational classifications (the occupation-based approach), the task-based approach assesses actual task content in individual jobs, exploiting data from the OECD’s Survey of Adult Skills (PIAAC). As noted by Autor (Reference Autor2015), for instance, within-occupation variations in task contents can be considerable, and hence the occupation-based approach most likely overestimates the number of automatable jobs. At a general level, the estimates by Nedelkoska and Quintini (Reference Nedelkoska and Quintini2018) expect that tasks related to social and cognitive intelligence, perception and manipulation cannot be automated. The authors also conclude that the occupations with the highest automation probabilities do not require specific skills or training.
Ideally, we would utilise task-based automation risk estimates calculated separately for each individual in the microdata. However, since imputing such information into EUROMOD microdata is not possible, we use the mean automation probabilities estimated by Nedelkoska and Quintini (Reference Nedelkoska and Quintini2018, p. 51). While EU-SILC provides occupational information at the same level of accuracy as the utilised automation risk estimates (ISCO-08 structure at 2-digit level), standardised EUROMOD input files have this information only at a more aggregated 1-digit level. To match the 2-digit level automation risk estimates with the EUROMOD input files, we test both the highest (‘Model 1’, variation 0.34–0.64) and the lowest (‘Model 2’, variation 0.28–0.57) 2-digit level estimates for each occupation group at 1-digit level. The aggregation and matching process is presented in Appendix 1.
Variations between the highest and the lowest estimate are somewhat moderate at 2-digit level, and hence biases resulting from this aggregation are expected to be moderate as well. Nevertheless, as pointed out by Nedelkoska and Quintini (Reference Nedelkoska and Quintini2018, p. 48), we inevitably lose valuable information when we utilise the risk of automation based on the skill requirements of broad occupational categories. Moreover, the mean probabilities are aggregated information from all OECD countries, which means that between-country differences cannot be considered. Due to the aggregated automation risk estimates, we recognise the illustrative nature of our results. Nevertheless, we maintain that the results still illustrate between-country differences in socio-economic resilience to technological unemployment deriving from divergent occupational structures and social policy systems.
Due to its technological determinism, utilising automation risk estimates based on an assessment of engineering bottlenecks is in our view an analytically justified manner to specify the technological unemployment scenario. Specifying the optimistic scenario is, however, a more complex task since there are no applicable ISCO-08-based estimates for determining which and how many of the currently unemployed individuals are expected to find employment in the digital economy.
As discussed above, positive spillover effects can theoretically increase demand for labour both in automation-intensive sectors (through expanded production and evolved tasks) and in non-automatable sectors (through increased consumption). Hence, it is complex to deduce, from the theory, which occupations are likely to grow in the future. A recent study by Bakshi et al. (Reference Bakshi, Downing, Osborne and Schneider2017) studying the future skill demand is illustrative in this sense. Exploiting trends analysis, expert views presented at foresight workshops and the U.S. Department of Labor’s O*NET data, the authors conclude that most occupations in the US and the UK have bright or highly uncertain employment prospects. Roughly seven in ten are in jobs having a probability of close to 50:50 to experience a higher workforce share. The authors argue that occupation redesign combined with retraining could promote growth in these occupations.
To reflect the observation of most jobs having roughly the probability of 0.5 to grow in the US and the UK, the optimistic scenario assumes unemployment to be reduced evenly in each occupational group. Although this specification is less accurate than that of the technological unemployment scenario, it recognises the plausible dynamics of positive spillover effects, highlighted by the ideal-type scenario and the study by Bakshi et al. (ibid.). Still, due to the lack of applicable estimates, specifying the rate of unemployment reduction is unavoidably arbitrary. In this study, we assume unemployment to be reduced by half in each country, which demonstrates in an intuitive manner socio-economic implications of substantially improved employment. Furthermore, in the context of weakening economic dependency ratios, policymakers might realistically pursue this goal in the future. Since our primary interest is to examine relative between-country differences, the country rankings would not change by using other estimates – if we still assume that positive effects of technological change evenly spill over all sectors, as the ideal-type scenario suggests. At the same time, it is necessary to note that the methodology introduced in this study facilitates revised simulations in a flexible manner – should more sophisticated estimates become available.
Constructing the scenarios with a micro imputation technique
To implement the specified scenarios, we have shifted individuals in the EUROMOD input microdata from employment to unemployment (or vice versa) according to the given parameters. This procedure has been carried out using the R programming tool and has included the following steps.
First, we have defined the population that move to unemployed (or find employment). In the technological unemployment scenario, the transition population consists of individuals who have a record of at least one month in employment (full-time or part-time employment or self-employment) and 12 months in employment or unemployment in total (by country around 74%–98% of all individuals having at least one month in employment). In the UK data, the transition population includes all individuals coded as employed, farmers or entrepreneurs. The different specification for the UK is needed because the UK data lack variables on months in employment and unemployment.
In the optimistic employment scenario, the transition population consists of individuals who have a record of at least one month in unemployment and 12 months in employment or unemployment in total (by country around 61%–97% of all individuals having at least one month in unemployment). In the UK data, the transition population includes all individuals coded as unemployed.
Second, we have defined the population that serves as a model population for the labour market transitions. In the technological unemployment scenario, the model population consists of individuals who have a record of 12 months in unemployment, while in the optimistic employment scenario it consists of individuals who have a record of 12 months in employment. We have defined the model population for the UK accordingly but with variables as in defining the transition population.
To implement the individual shifts in the transition population from employment to unemployment (or vice versa), we have imputed incomes, labour market variables and social benefit variables from the model population by using a non-parametric micro imputation technique (see Appendix 2 for the individual-level attributes imputed in the transitions). The imputation method randomly selects attribute donors from a suitable subset of all available donors of the model population. The matching variables include gender, age, and education, while the imputed attributes include data on income from employment/self-employment, employment/unemployment spells (months), working hours, unemployment benefits, and social assistance.
For the finalised scenario data, we have only imputed the given shares of the transition population (according to the occupation-related automation risk parameters). We have chosen the shifting shares from the total transition population using a simple random sampling procedure.
Critical perceptions of the micro imputation technique
We acknowledge that there are alternative strategies for assessing future scenarios with static microsimulation models. One possible method would be to re-weight the simulated micro data according to the given aggregate information on employment (see e.g. Marx et al., Reference Marx, Vandenbroucke and Verbist2012, p. 476 for further discussion). However, this method would also affect the distribution of household characteristics because the original weights in the EU-SILC data are for households. As our scenarios only contain information on individual-level changes, we consider conducting the analysis with an individual-level technique more accurate. The small number of observations in the data would also not allow us to conduct a very sophisticated calibration framework. Instead, large population transitions would likely lead to very large household weights, resulting in potentially large uncontrollable biases in the simulated outcomes.
Instead of using a matching technique in the imputation process, we could also have used an alternative technique such as deterministic rules (Jara Tamayo and Popova, Reference Jara Tamayo and Popova2020) or regression modelling (Marx et al., Reference Marx, Vandenbroucke and Verbist2012). However, modelling several individual- and household-level attributes consistently would have required simplified imputation rules that ignore the variance of the attributes in reality. Since the scenarios assume the employment changes to realise in the long-term, using the matching technique ensures reasonable variety in the characteristics of the unemployed.
An obvious criticism of our approach concerns the accuracy of imputation on the individual and household level. In other words, the matching variables do not necessarily result in proper matches so that, for instance, all relevant data needed for calculating unemployment benefits or social assistance are similar between attribute donors and attribute receivers. An alternative approach to implementing the technological unemployment scenario would have entailed using EUROMOD’s new Labour Market Adjustments (LMA) add-on (published after conducting this study), which utilises deterministic rules in imputing attributes for the unemployed individuals and follows policy rules in the calculation of household-level benefits (cf. Jara Tamayo and Popova, Reference Jara Tamayo and Popova2020). However, the add-on would not have facilitated simulating the optimistic scenario. Hence, using it would have resulted in a more inconsistent methodological approach.
One can also question the robustness of the results because the randomly chosen individuals who shift in the scenarios have large weights in the data, and therefore different samples might result in large variations in the outcome variables. Fortunately, our computational approach allows us to estimate the possible bias caused by the mismatch of individuals/households and the variance of outcome variables in the samples. An iterated simulation of the technological unemployment scenario for the UK shows that the range of estimated relative differences in government revenue and expenditure is roughly 1–2 percentage points.
Finally, imputing attributes from a model population to a transition population does not preserve all the relevant data of the transition population. Since Nedelkoska and Quintini (Reference Nedelkoska and Quintini2018) have exploited the expert assessment of engineering bottlenecks provided by Frey and Osborne (Reference Frey and Osborne2013, Reference Frey and Osborne2017), we assume the employment implications to be realised “over the next decade or two”, as Frey and Osborne describe a plausible timespan in their study. Given the long timespan, we maintain that imputing incomes and labour market statuses from the model population, instead of predicting them based on available background variables of the transition population, is a reasonable choice. In the simulation, we assume that the shifting population is – in the timespan of our analysis – more representative of the model population than how they would look immediately after shifting to unemployment (or employment).
Simulating income transfers in the scenarios and assessing changes in socio-economic indicators
Following the imputation of the microdata, we have simulated the constructed scenarios using the tax-benefit microsimulation model EUROMOD (version 3.0.2). We have compared the results in the scenarios both with the baseline simulation (no imputation) and between the countries within the scenario. The baseline data on incomes, labour market statuses, household structures and other individual characteristics represent the year 2016 apart from Luxembourg and the United Kingdom, whose data are from 2015. Rules and parameters of tax-benefit systems used in the simulation of taxes and benefits represent the year 2018. The input data are uprated to match the policy systems.
To compare socio-economic implications, we have analysed government revenues from taxes and social insurance contributions, government expenditures on social transfers, total budgetary implications, budget-balance-to-revenue ratios, poverty risks at population level, and Gini coefficients based on disposable income. Changes in revenues, expenditures, poverty rates, and Gini coefficients have been calculated using EUROMOD’s Statistics Presenter plug-in, but percent changes in budgetary indicators, total budgetary implications and budget balance-to-revenue ratios are based on the authors’ own calculations. Baseline budget balance data representing the year 2018 have been derived from Eurostat databases.
The analysed indicators are defined as follows:
-
Government revenue through taxes and social insurance contributions = Direct taxes, employee social insurance contributions, self-employed social insurance contributions, other social insurance contributions, employer social insurance contributions, credited social insurance contributions
-
Government expenditure on social transfers = Unemployment benefits, family and education benefits, social assistance and housing benefits, pensions, health and disability benefits
-
Total budgetary implication = (Change of government revenue – change of government expenditure)/Baseline government revenues
-
Baseline budget balance-to-revenue ratio = Baseline budget balance/Baseline government revenue through taxes and social insurance contributions
-
Scenario budget balance-to-revenue ratio = (Baseline budget balance + total budgetary implication)/scenario government revenue through taxes and social insurance contributions
-
Poverty = The share of individuals below the poverty line (= 60% of the country-specific median equivalised disposable household income, poverty line kept fixed throughout the scenarios)
-
Gini coefficient = Distribution of disposable income within a country where 0 means perfect income equality and 1 means perfect income inequality
We assess the socio-economic indicators independently and rank countries by each indicator. A high position in the rankings implies a beneficial result from the perspective of the studied indicator.
Results
The technological mass unemployment scenario
To compare the resilience of the EU-28 countries to technological unemployment, we first focus on budgetary implications in the simulated scenario. Since the utilised mean automation probabilities vary considerably from one occupational group to another (Model 1: 0.34–0.64 & Model 2: 0.28–0.57), major negative implications for government revenues presumably reflect high employment in automatable occupations. Additionally, the level of income taxation and social contributions can explain some of the variation. While occupational structures, income taxation, and social contributions explain most of the variation in government revenues, changes in social expenditures reflect the occupational structures and generosity of the benefit system. Table 1 presents the results obtained from budgetary implication calculations.
TABLE 1. Ranking of the EU-28 by budgetary indicators in the technological mass unemployment scenario
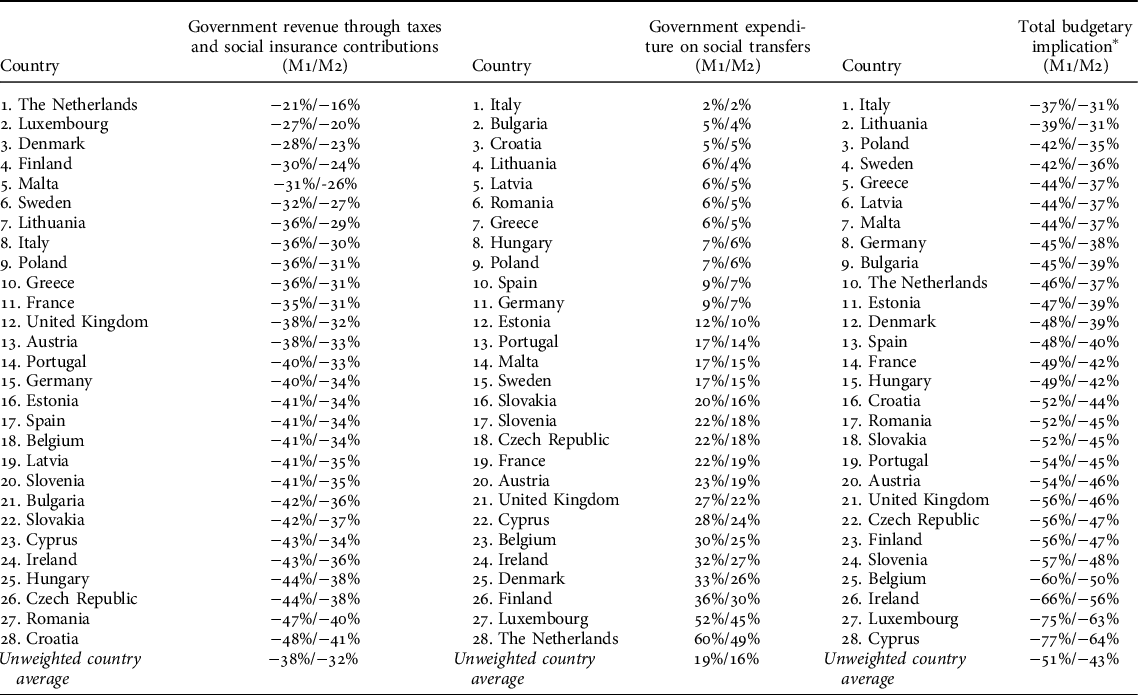
* (Change of government revenue – change of government expenditure)/Baseline government revenues
What stands out in Table 1 is that the impacts on government revenues in the simulated scenario vary substantially between the EU-28 countries, with the average impact being -38%/-32%. Similarly, the differences in social expenditures are striking (average 19%/16%). Major decreases in government revenues connected to minor increases in social expenditures in certain Eastern European countries, such as Romania and Croatia, can be expected to have a considerably negative impact on social indicators analysed later in this section. Based on the previous observations, it is unsurprising that total budgetary implications also vary substantially between the EU countries (average -51%/-43%). When compared to the average impact, the total budgetary implication is particularly negative in Cyprus, Luxembourg, and Ireland, while Italy and Lithuania stand out as the countries most resilient to technological unemployment from the budgetary perspective.
Obviously, budget balance in the baseline situation frames the political implications of decreased government revenues and increased social expenditures in the simulated scenario. To illustrate the significance of budget deficits/surpluses in the event of technological mass unemployment, we compare budget balances in the baseline year 2018 and in the simulated scenarios in Appendix 3. In general, countries with budget surpluses in the baseline situation perform better in the simulated scenario as well. However, this result is not entirely consistent, as the cases of Austria, Czech Republic, Slovenia, Croatia, and Ireland indicate. Still, when interpreting the results in Table 1, major surpluses (e.g. Malta, Bulgaria, and Luxemburg) and deficits (e.g. Italy, Spain, Hungary, United Kingdom, Romania, and Cyprus) in the baseline situation should be considered.
Poverty (10%–24% in the baseline scenario) and income inequality (0.22–0.38 in the baseline scenario) currently pose very divergent challenges depending on the EU member state. Since the generosity of social benefits alongside unemployment and working conditions largely explains differences in poverty rates (Eurostat, 2019), it can be expected that technological unemployment would increase poverty in those countries that have low social expenditures and high dependency on automatable occupations. In a similar fashion, we can expect that technological unemployment would increase income inequality particularly in those countries that are dependent on automatable occupations and provide unemployment benefits with relatively low replacement rates. Table 2 presents an overview of population-level poverty rates and Gini coefficients for disposable income in the simulated scenario.
TABLE 2. Ranking of the EU-28 by social indicators in the technological mass unemployment scenario
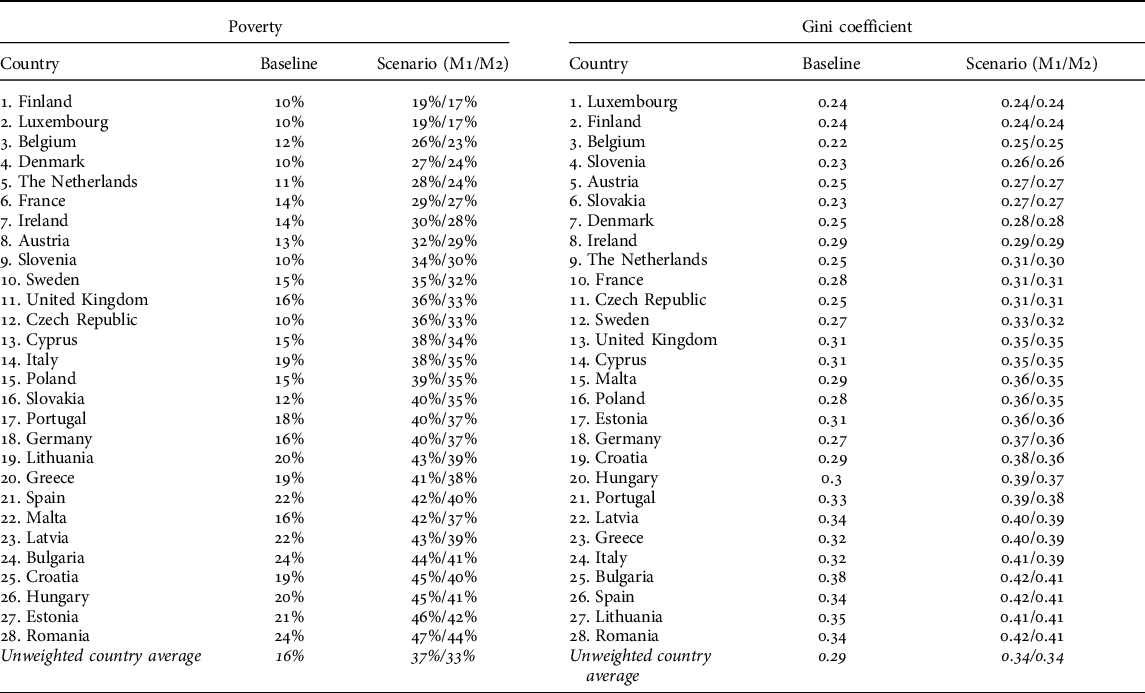
Despite the considerable variations, it is apparent from Table 2 that mass unemployment would have substantially negative impacts on poverty across the countries, with the average poverty rate being 37%/33% and average difference to the baseline poverty rate being 21pp/17pp. Only in Finland, Luxembourg, Belgium, Denmark, the Netherlands, and France would poverty rates remain under 30% in both simulated models. In Spain, Bulgaria, Croatia, Hungary, Estonia, and Romania, poverty increases considerably, above 40% in both models. Moreover, Finland and Luxembourg are the only countries in which the difference to the baseline poverty rate is below 10pp. In Romania, Poland, Slovenia, Estonia, Germany, Hungary, Croatia, the Czech Republic, Malta, and Slovakia, the difference to the baseline is above 20pp in both models.
The simulated technological mass unemployment scenario would increase inequality across the countries, but, once again, we can observe major differences (0.00–0.1/0.00–0.8) in social resilience, with the average Gini coefficient being 0.34/0.34 and the average difference to the baseline being 0.05/0.05. Gini coefficients remain below 0.30 in Luxembourg, Finland, Belgium, Slovenia, Austria, Slovakia, Denmark, and Ireland, whereas in Bulgaria, Spain, Lithuania, and Romania we can observe Gini coefficients above 0.40. We find the most dramatic (≥0.07 in both models) differences to the baseline in Greece, Spain, Croatia, Romania, Hungary, Italy, and Germany, while Ireland, Luxembourg, and Finland exhibit only minor changes.
The optimistic employment scenario
We will now move on to analyse the socio-economic implications of the optimistic employment scenario. As with the technological unemployment scenario, we first focus on budgetary indicators before turning to assess the implications for poverty and inequality.
Since the simulated scenario assumes that unemployment is reduced by half in each country, between-country differences can be explained by the level of unemployment, income taxation, and social benefits, but also by divergent working conditions. In countries whose unemployment, income taxation, and social benefit levels are low and working conditions weak, budgetary implications from halved unemployment can be expected to be minor, while high unemployment, high income taxation and generous social benefits combined with good working conditions predict greater benefits. We have summarised the budgetary implications of the optimistic employment scenario in Table 3.
TABLE 3. Ranking of the EU-28 by budgetary indicators in the optimistic employment scenario
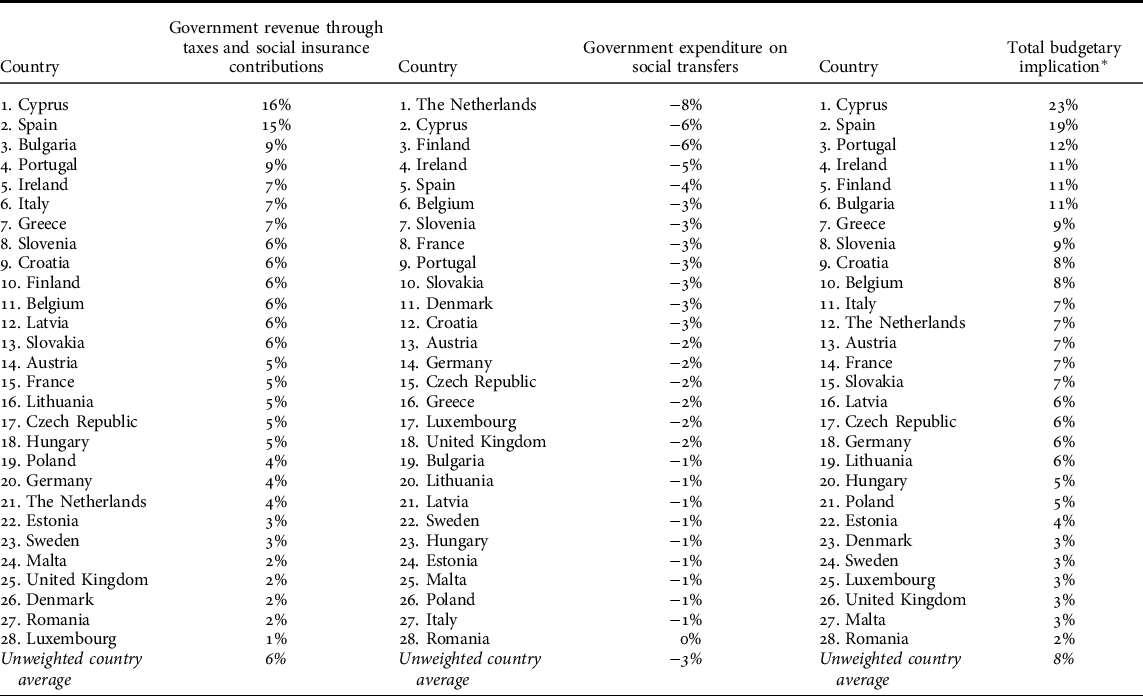
* (Change of government revenue – change of government expenditure)/Baseline government revenues
As with the unemployment scenario, the total budgetary implications of the optimistic scenario vary substantially (2%–23%) between the EU-28 countries, with the average impact being 8%. In the light of total budgetary implication, Cyprus and Spain in particular would benefit substantially from decreased unemployment, but Bulgaria, Finland, Ireland, and Portugal also benefit clearly above average. Considering the budget balance-to-revenue ratios (Appendix 3), halved unemployment would stabilise budgets in most countries struggling with deficits in the baseline situation. However, there are six countries – France, Italy, Cyprus, Hungary, the United Kingdom, and Romania – in which even substantially improved employment would not balance budgets entirely. In Hungary, the United Kingdom, and Romania the positive impact would actually be comparatively small.
If a country provides unemployment benefits with relatively high replacement rates, a substantial reduction in poverty might require not only combatting unemployment, but also higher salaries for low-income workers. Similarly, reducing unemployment without changes in taxation or labour market conditions might not lead to significant changes in income inequality either. The EU-28 countries are ranked by social indicators in the simulated scenario in Table 4.
TABLE 4. Ranking of the EU-28 by social indicators in the optimistic employment scenario
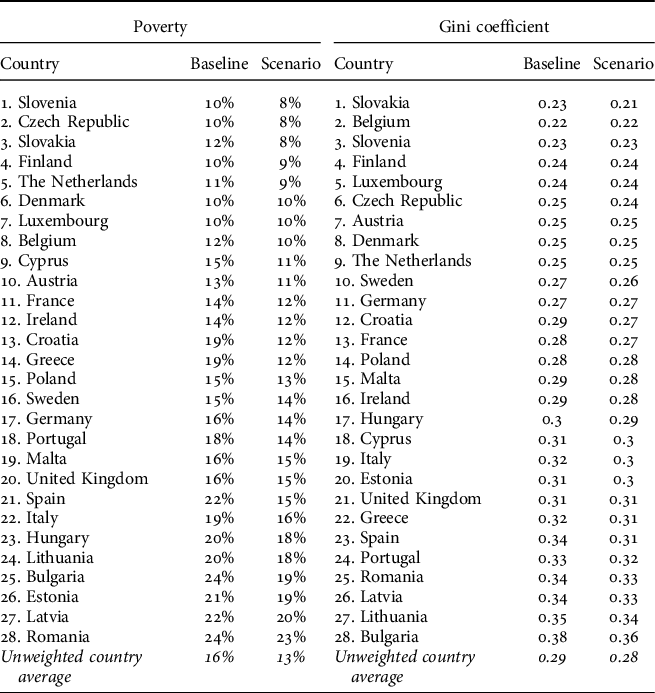
What is interesting about the data in Table 4 is that the positive impact of halved unemployment on poverty rates (-1pp – -7pp) is somewhat moderate, with the average difference to the baseline being -3pp. Above average impacts are observed only in Cyprus, Italy, Bulgaria, Portugal, Croatia, Greece, and Spain. As with poverty, the positive impact of halved unemployment is moderate in the light of inequality, with the average difference to the baseline being only -0.01. A more substantial impact can be observed in Bulgaria, Croatia, Greece, Italy, Portugal, and Spain – namely, the same countries in which poverty rates would also decrease the most as a result of reduced unemployment.
Conclusions and discussion
The aim of the present microsimulation study was to compare the socio-economic implications of a technological unemployment and an optimistic future employment scenario for the European Union member states and the UK. The most obvious finding to emerge from this study is that socio-economic resilience to technological unemployment varies considerably between the EU-28 countries. Several Eastern and Southern European welfare states would be confronted by serious socio-economic challenges should technological unemployment constitute a permanent problem. The results suggest that the Nordic and Benelux countries in particular, but also France, could tackle the most severe societal impacts of technological unemployment, while Romania, Portugal, Croatia, and Cyprus would perform more weakly than average in all key indicators.
This study has also shown that while a substantial decrease in unemployment would have major positive budgetary implications across the countries, combatting unemployment alone does not eradicate poverty or income inequality in countries that are currently performing weakly in the social indicators. This implies that tax-benefit system reforms and changes in labour conditions are also needed if the current weak performers wish to improve their social outcomes.
That said, there are a few countries that would derive both considerable social and economic benefits from reduced unemployment – particularly Croatia, Cyprus, Greece, Spain, and Bulgaria. Although these five countries have the most beneficial results in comparison to their baseline results, only Croatia alongside Slovenia, Belgium, and Finland perform better than average when it comes to total budgetary implication, poverty and inequality in the simulated scenario. As with the technological unemployment simulation, one can of course argue that budget balances should be emphasised when analysing the benefits of decreased unemployment. Furthermore, it should be noted that the microdata represent the year 2016 and relative differences in unemployment rates have changed since then. In Croatia, for instance, the situation is comparatively much more favourable now than it was in 2016.
Due to the aggregated occupational information from the utilised microdata and inaccuracies caused by the imputation method, we recognise the indicative nature of the presented results. Moreover, the approach cannot take into account plausible effects on wage levels or prices deriving from changes in employment. We also recognise that the specification of the optimistic scenario only represents one possible approach to illustrating technology-induced positive spillover effects. Notwithstanding the methodological limitations, the results of this study offer some insights into how occupational structures and social policy systems would affect the socio-economic implications in the event of permanent technological unemployment, and which welfare states are fit for purpose in optimistic scenarios.
From policy perspective, our results point to a paradox in the recent discussions concerning the future of work. While employment pessimists have repeatedly referred to Universal Basic Income (UBI) as the key measure to increase labour’s adaptability to the digital economy (see e.g. Pulkka, Reference Pulkka2017; Sloman, Reference Sloman2018), our simulations imply that the affordability problem – highlighted by Martinelli (Reference Martinelli2020) – would further deepen if technological unemployment posed a permanent problem. In other words, while the pessimists emphasise the urgency of new investments in social policy, economic implications of technological unemployment might paradoxically force European welfare states to implement harsh austerity measures – in particular in countries with major budget deficits in the baseline situation. Although it is premature to assess the long-term employment effects of the COVID-19 crisis, it is fair to note that the political implications of technological unemployment – or, on the other hand, improved employment – might be different from what our simulations based on pre-corona data suggest.
The present study represents the first microsimulation-based attempt to analyse the socio-economic implications in divergent digital economy employment scenarios. Evidently, further work is needed to fully understand between-country differences in socio-economic challenges and opportunities that European welfares states may encounter in the future. With this in mind, we wish to point out four issues concerning the implications of our study for further research work.
First, and perhaps most importantly, it is evident that microdata with less aggregated occupational information are needed: as a crucial precondition for establishing a greater degree of accuracy when simulating technological unemployment scenarios. This implies that more resources should be allocated to collecting comparative data that provide more accurate information on occupational structures at the European level. Given the current inadequate statistics concerning the technological transformation (Mitchell and Brynjolfsson, Reference Mitchell and Brynjolfsson2017), this would not only improve the quality of data used for microsimulations, but also facilitate comparing the ongoing transformation in a wider sense. Second, it is quite clear that developing a more analytical microsimulation approach for illustrating plausible optimistic employment scenarios is needed. Developing a novel digital economy employment theory utilising the ISCO-08 occupational structure was beyond the scope of this study, but this would naturally be a fruitful area for further work. Third, although we highlighted many features – occupational structures, the generosity of social benefits, level of income taxation, and conditions in the labour market – as explanatory factors behind the between-country differences, further explanatory analyses would be needed to understand country-level dynamics more specifically. Finally, it is important to point out that we did not consider any reforms that governments might implement to adapt to divergent scenarios. Therefore, further research should be undertaken to investigate plausible tax-benefit system reforms in divergent scenarios.
Supplementary material
Supplementary material for this article is available online https://doi.org/10.1017/S0047279421000295.
Acknowledgements
The authors are grateful to Holguer Xavier Jara Tamayo, Heikki Hiilamo, Olli Kangas, and the two anonymous reviewers for their valuable comments and suggestions.
EUROMOD is maintained, developed and managed by the Institute for Social and Economic Research (ISER) at the University of Essex, in collaboration with national teams from the EU member states. We are indebted to the many people who have contributed to EUROMOD’s development. The process of extending and updating EUROMOD is financially supported by the European Union Programme for Employment and Social Innovation – ‘Easi’ (2014–2020). We are grateful for access to microdata from the EU Statistics on Income and Living Conditions (EU-SILC), made available by Eurostat under contract RPP/151/2018-EU-SILC. The results and their interpretation are the authors’ responsibility.
The author(s) disclosed receipt of the following financial support for the research, authorship, and/or publication of this article:
Ville-Veikko Pulkka acknowledges the financial support provided by the European Union’s Horizon 2020 research and innovation programme under grant agreement No 822296 and the Finnish Cultural Foundation (Suomen Kulttuurirahasto) in the research, authorship, and publication of this article.
Competing interests
The authors declare none.
Appendix 1. Aggregation and matching of the automation risk estimates with the EUROMOD microdata
Appendix 2. Individual-level attributes imputed in the (un)employment transitions
Appendix 3. Ranking of the EU-28 by budget balance in the simulated scenarios


 Open access