The number of children and teenagers with obesity is predicted to rise to 254 million worldwide by 2030(Reference Lobstein and Brinsden1). Sugar-sweetened beverages (SSB) are implicated in this global obesity epidemic. Evidence links childhood consumption of SSB to weight gain and chronic disease later in life(Reference Scharf and DeBoer2–Reference Malik, Pan and Willett8), as well as more immediate problems like tooth decay(Reference Chi and Scott9) and poor sleep(Reference Sampasa-Kanyinga, Hamilton and Chaput10,Reference Scully, Morley and Niven11) .
WHO advises children’s and adults’ intake of free sugars to be <10 % of total energy intake(12). However, many young peoples’ sugar intake, especially for SSB, exceeds recommendations(Reference Fidler Mis, Braegger and Bronsky13–Reference Sim, Sohn and Choi15), including in Australia where this study was conducted(Reference Lei, Rangan and Flood16). Curbing young people’s SSB consumption offers one promising strategy for helping address childhood obesity and improve health outcomes(Reference Scharf and DeBoer2,Reference Hu17) . Experts have called for policies to reduce SSB consumption and encourage healthier alternatives like water(Reference Luger, Lafontan and Bes-Rastrollo3,Reference Mihrshahi, Gow and Baur18,Reference Muth, Dietz and Magge19) . Evidence for the efficacy of population-level interventions addressing SSB consumption is mixed and emerging(Reference Fidler Mis, Braegger and Bronsky13,Reference von Philipsborn, Stratil and Burns20) . Systematic reviews have called for research: testing interventions that can be scaled up; using non-US survey samples; ensuring adequate power; examining intended and unintended effects (e.g. substitution with artificially sweetened drinks); and considering how interventions interact with contextual factors that may influence effectiveness(Reference von Philipsborn, Stratil and Burns20,Reference Kirkpatrick, Raffoul and Maynard21) . This study extends this area of enquiry by testing a sample of Australian adolescents’ responses to a simulated, scalable point-of-sale (POS) signage intervention, involving two different nutrition labelling schemes for non-alcoholic drinks, and exploring whether responses to the POS intervention are affected by prior exposure to a public health campaign discouraging SSB consumption.
Well-designed public health mass media campaigns of sufficient intensity and duration can promote population-level improvements in health-related behaviour(Reference Wakefield, Loken and Hornik22). Following implementation in two separate Australian states of a healthy weight and lifestyle campaign (LiveLighter ®(23)) that graphically communicated negative health effects of SSB consumption, reduced SSB consumption was found among adults who were frequent consumers(Reference Morley, Niven and Dixon24,Reference Morley, Niven and Dixon25) . Adults previously exposed to a public health campaign about SSB, weight gain and increased cancer risk (13 Types of Cancer, herein referred to as 13 Cancers) showed reduced preferences for SSB, and exposure to POS signs about SSB also reduced SSB preferences(Reference Scully, Morley and Wakefield26). POS signs were most impactful for those not previously exposed to the campaign, suggesting that POS signs may complement mass media campaigns by reaching people not otherwise exposed to public health messaging about SSB.
Providing nutrition and health information at the POS can improve awareness and knowledge and encourage healthier food and drink purchases(Reference Liberato, Bailie and Brimblecombe27). A systematic review found that front-of-pack (FOP) labels and POS signs with health- or sugar-related messages were associated with improved knowledge, attitudes and beliefs, and reduced SSB purchases – with warnings about health consequences especially effective(Reference Gupta, Billich and George28). A meta-analysis of experimental studies found that SSB warnings can reduce SSB purchases and purchasing intentions, promote stronger emotional responses to SSB and increase perceptions that SSB contribute to disease(Reference Grummon and Hall29). Most research in this area has been with adults and tested FOP labels rather than POS signs. The authors called for research identifying the most impactful SSB warning designs and with priority population sub-groups.
Testing the effectiveness of SSB POS interventions with adolescents is warranted, as they are high consumers and often make independent purchases. Many teens have their own money, and higher weekly spending money is associated with high SSB consumption(Reference Scully, Morley and Niven11). An online experiment found text-based health warning labels on SSB helped US teens recognise the sugar content (SC) of SSB and reduced hypothetical SSB purchases(Reference VanEpps and Roberto30). An online experiment with New Zealand teenagers and young adults found text-based SC warning labels reduced preferences for and likelihood of purchasing SSB(Reference Bollard, Maubach and Walker31). Evidence from studies with adults suggests pictorial warnings on unhealthy foods may be more impactful than text-only warnings(Reference Rosenblatt, Dixon and Wakefield32,Reference Rosenblatt, Bode and Dixon33) . Research examining how adolescents respond to SSB POS interventions that include graphic elements is lacking. This is particularly relevant in Australia where a pictorial nutrition labelling scheme, the Health Star Rating (HSR)(34), has been voluntarily implemented on some foods and drinks since 2014, with plans to make this scheme mandatory.
The HSR is designed to provide consumers with a quick, easy pictorial reference for comparing similar packaged food and drink products(34). However, industry uptake of the HSR system has been slow; it currently only appears on some products and less commonly on products with low HSR, which restricts its utility(Reference Shahid, Neal and Jones35). There has also been contention that the algorithm used to compute the HSR may be misleading for certain products, which can attract a high HSR despite having high levels of sugar (e.g. fruit juice)(36). Investigation of timely, expedient methods for communicating nutrition information about drink products at the POS is warranted. Here, we test adolescents’ reactions to POS signs that provide summary pictorial nutrition information comparing various drink products alongside one another. Such POS signs could potentially be implemented either voluntarily (e.g. in school canteens seeking to promote healthy choices) or mandated at the state level, independent of FOP labelling.
The primary aim of this study was to test the effects of two different POS signage interventions on adolescents’ drink preferences and perceptions: (i) showing the HSR for various popular non-alcoholic drinks and (ii) showing SC as the number of teaspoons of sugar found in these drinks. A secondary research question was to examine whether responses to these POS signs differed based on recent exposure to the 13 Cancers campaign which urged people to avoid SSB.
Methods
Design and procedure
Using a similar approach to our analogous study with adults(Reference Scully, Morley and Wakefield26), a between-subjects online experiment was conducted during the final 4 weeks of a 6-week television-led public health campaign (13 Cancers) highlighting the link between SSB, weight gain and increased cancer risk, broadcast in Victoria, Australia(37). Participants were randomly assigned to one of three POS signage conditions: no signage (control), SC and HSR. Those in the SC or HSR condition were advised that they would be shown an information poster on the next screen and to take some time to read the whole poster as they would be asked some questions about it later in the survey. After viewing their assigned POS sign on screen alone (median duration = 15 s), participants were shown their POS sign alongside a display of generic non-alcoholic drink products and asked to select which drink they would choose to buy for themselves. Participants in the no signage condition were not shown any information poster and only saw the drink product display (without a POS sign) when making their selection. Next, perceptions and knowledge of drink products were assessed, and for those in the POS signage conditions, cognitive and emotional responses to the sign were assessed. Finally, participants were shown the 13 Cancers video advertisement to assess self-reported prior exposure to the campaign.
Participants
A sample of Australian adolescents who consume SSB at least monthly were recruited by contacting adults from Ipsos’s non-probability national online panel and two of their panel partners. Panellists are sourced using a variety of methods (e.g. telephone interviews, face-to-face surveys) and receive points for completing surveys that can be redeemed for rewards (e.g. shopping vouchers). Digital fingerprint technology was used to reduce the likelihood of duplicate participants across multiple panels. Upon clicking the survey link in the email invitation, panellists were screened to determine if they were the parent/guardian of a child aged 13–17 years. Those meeting this criterion were provided with information about the study and allowed to read through the questionnaire before consenting to their child’s participation. Where parent/guardian consent was obtained, panellists were instructed to have their child complete the survey independently by clicking to the next screen. Informed consent was obtained from adolescents before commencing the survey.
Participants answered questions to confirm eligibility criteria: aged 13–17 years, did not reside in Western Australia (due to this state’s exposure to the long-running LiveLighter ® healthy weight and lifestyle mass media campaign that included messaging about SSB(Reference Morley, Niven and Dixon24) which differed from the 13 Cancers campaign being considered here) and usually consumed at least one cup of SSB a month (included all non-diet varieties of soft drinks, flavoured mineral water, energy drinks, fruit drink, sports drink and cordial). No age, gender or location quotas were applied due to difficulties in recruiting adolescents through online panels. The maximum number of adolescents was recruited within the specified data collection period (21 October to 17 November 2019). To detect overall effects of the SC and HSR POS signs of a similar magnitude to those observed in our analogous experiment with adults(Reference Scully, Morley and Wakefield26), it was estimated that between 182 and 317 per condition would be required.
Interventions
Point-of-sale signs
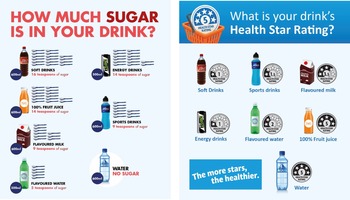
Full-colour digital POS signs, originally developed for our analogous experiment with adults(Reference Scully, Morley and Wakefield26), were used as the intervention stimuli (see Fig. 1). Both signs featured seven identical non-alcoholic drinks (soft drinks, 100 % fruit juice, flavoured milk, flavoured water, energy drinks, sports drinks, water). The SC sign displayed each drink with its corresponding number of teaspoons of sugar; the HSR sign showed each drink accompanied by an overall rating of its nutritional profile. The HSR scheme is a voluntary FOP nutrition labelling scheme in Australia whereby packaged products are assigned an interpretative rating ranging from ½ to 5 stars (more stars indicate a healthier choice) that takes into account positive and risk nutrients of the product per 100 g/100 ml(38). For each drink type, the amount of sugar and HSR were determined by the researchers referring to nutritional information for key branded products and an Accredited Practicing Dietitian reviewed them for accuracy. Based on their advice, the number of teaspoons of sugar in flavoured milk did not include the amount attributable to naturally occurring lactose; however, naturally occurring sugar present in 100 % fruit juice was included due to somewhat mixed evidence regarding health effects of 100 % fruit juice(Reference Auerbach, Dibey and Vallila-Buchman39).

Fig. 1 Point-of-sale signs (left to right): sugar content; Health Star Rating
Mass media campaign
The 13 Cancers mass media campaign graphically highlighted the link between SSB, weight gain and increased risk of 13 types of cancer, ending with the call to action to avoid sugary drinks. Initially launched in October 2018, the second wave of the 13 Cancers television-led campaign commenced in October 2019 and ran for 6 weeks (7 October–16 November). Data collection was timed to coincide with the last 4 weeks of the campaign, so naturalistic exposure could be assessed. The campaign’s primary target audience was Victorian adults aged 25–59 years, while secondary audiences included GP, parents and Victorians living in non-metropolitan areas, as well as Victorians aged 18–24 years who were targeted predominantly via digital media. We examined whether teenagers were also reached by this campaign and whether responses to the POS signage intervention varied as a function of prior campaign exposure.
Measures
Drink choice
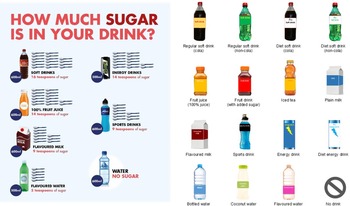
Using a hypothetical shopping scenario developed by Billich et al.(Reference Billich, Blake and Backholer40), participants were instructed to imagine they had gone into a convenience store or take-away café or kiosk or up to a vending machine with the intention to buy a pre-packaged drink (in a bottle, can or carton) to drink immediately themselves. They were then asked to select which drink, if any, they would choose in this situation from a display of fifteen generic non-alcoholic drink products. Participants in the intervention conditions viewed their assigned POS sign (SC or HSR) alongside the drinks display (see Fig. 2); participants in the control condition saw no signage when making their drink choice. Selections were subsequently collapsed into the following drink categories: SSB (regular soft drink (cola and non-cola), fruit drink (with added sugar), iced tea, sports drink, energy drink, flavoured water); diet drinks (diet soft drink (cola and non-cola), diet energy drink); high (≥4) HSR drinks containing sugars, e.g. fructose, lactose (fruit juice (100 % juice), plain milk, coconut water); high (≥4) HSR drinks with no sugar (bottled water); flavoured milk and no drink.

Fig. 2 Example of online drink choice task for the sugar content point-of-sale signage condition
Drink perceptions
Seven-point rating scales measured perceptions of how healthy (1 = ‘not healthy at all’ to 7 = ‘very healthy’) participants considered each of the fifteen drink types to be and how much sugar (1 = ‘no sugar’ to 7 = ‘high sugar content’) each contained. Responses were averaged to create summary indices of perceptions of healthiness and SC for each drink category.
Knowledge about sugar-sweetened beverages
An open-ended question prompted participants to provide their best guess as to how many teaspoons of sugar are in an average 600 ml bottle of soft drink. Responses within a 10 % margin of error of 16 teaspoons (i.e. 15–17) were classified correct.
Reactions to point-of-sale signs
Participants rated their allocated POS sign on cognitive and emotional measures using seven-point scales ranging from 1 = ‘strongly disagree’ to 7 = ‘strongly agree’ for the cognitive items and from 1 = ‘not at all’ to 7 = ‘extremely’ for the emotional items. Participants indicated their level of agreement that they felt motivated to reduce the amount of sugary drinks they currently drink while reading their assigned POS sign.
Self-reported prior campaign exposure
Participants were shown the 30 s 13 Cancers video advertisement. Those indicating they could clearly see and hear the advertisement (99 %; n 919) were asked whether they had previously seen it. Participants who responded ‘Yes’ (cf. ‘No’ or ‘Don’t know/can’t say’) were categorised as having self-reported prior exposure to the 13 Cancers campaign.
Demographics
Participants recorded their gender, age, residential postcode (to estimate area-based socio-economic position according to the Socio-Economic Indexes for Areas Index of Relative Socio-Economic Disadvantage(41)) and usual frequency of consuming water and SSB. Self-reported height and weight were collected to compute BMI (weight (kg)/height (m)2), which was classified into weight categories according to international standard cut-offs for children and adolescents(Reference Cole, Bellizzi and Flegal42).
Statistical analysis
Data were analysed using Stata MP version 16.1(43). Descriptive statistics were used to characterise the sample and report proportions for categorical outcomes (i.e. type of drink selected in choice task; knowledge of correct number of teaspoons of sugar in 600 ml bottle of soft drink) and means for continuous outcomes (i.e. perceived healthiness and SC of each drink category). A combination of logistic (for categorical outcomes) and linear (for continuous outcomes) regression analyses was conducted to test for differences by POS signage condition on each outcome. For each model, the overall main effect of POS signage condition was assessed using the testparm postestimation command in Stata. Where this global test was significant, this is reported in text and all pairwise comparisons subsequently examined (i.e. no signage v. SC POS sign; no signage v. HSR POS sign; SC v. HSR POS sign) with a Bonferroni adjustment applied to control for type 1 error rates. Pre-planned exploratory analyses were performed on the respective outcome measures, with an interaction term included in each model to test whether effects of POS signs varied based on prior exposure to the 13 Cancers campaign. Descriptive statistics (Mean, sd) and independent samples t tests were used to examine differences in cognitive and emotional reactions to the SC and HSR POS signs.
Results
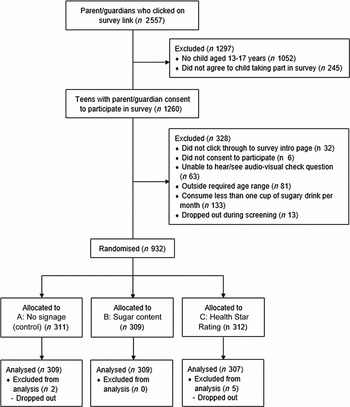
A total of 2557 panellists clicked on the survey link in the email invitation, of which 1260 were parent/guardians of a child aged 13–17 years and agreed to their child participating. Following exclusions, 932 eligible adolescents were randomised to conditions, with a final sample of 925 (n 307–309 per condition) available for analysis (see Fig. 3 for CONSORT flow diagram). The sample’s demographic profile is summarised in Table 1. Almost half (48 %) of the participants reported consuming four or more cups (equivalent to 1 litre) of SSB per week; around one in five (21 %) reported consuming SSB less than weekly.

Fig. 3 CONSORT flow diagram
Table 1 Sample characteristics by point-of-sale signage condition (n 925)

Percentages may not sum to 100 % due to rounding.
* Socio-economic position (SEP) was determined according to the Australian Bureau of Statistics’ Index of Relative Socio-Economic Disadvantage ranking for Australia using participant’s residential postcode. This index ranks areas on a continuum of disadvantage (from most disadvantaged to least disadvantaged) taking into consideration characteristics that may enhance or reduce socio-economic conditions of the area. SEP information is missing for two participants as they provided invalid residential postcodes.
† BMI information is missing for 227 participants as they either did not self-report their height and/or weight (n 214) or provided invalid height and/or weight responses (n 13).
‡ Campaign recognition information is missing for six participants who were unable to see and hear the advertisement clearly.
Drink choice
Over half of all participants (55 %) selected an SSB in the choice task; just under one-fifth (18 %) chose water. Less than one in ten participants selected a high HSR drink containing sugars (9 %), flavoured milk (9 %) or diet drinks (8 %), and only 1 % indicated they would buy no drink. There were no significant differences by POS signage condition in the proportion of participants selecting any of these drink types (see Table 2).
Table 2 Type of drink selected in hypothetical shopping scenario, and perceptions and knowledge regarding different drink types by point-of-sale signage condition

For each outcome where the test of main effect was significant (P < 0·05), pairwise differences were assessed with a Bonferroni correction applied.
a Significant difference compared with no signage (control) condition at P < 0·05. b Significant difference compared with Health Star Rating sign at P < 0·05.
* Rated on a seven-point scale ranging from 1 = ‘not healthy at all’ to 7 = ‘very healthy’.
† Rated on a seven-point scale ranging from 1 = ‘no sugar’ to 7 = ‘high sugar content’.
‡ Proportion of participants who nominated the correct number of teaspoons of sugar in an average 600 ml bottle of soft drink within a 10 % margin of error (i.e. 15–17 teaspoons).
Perceived healthiness and sugar content
Participants shown the SC sign rated SSB as less healthy than those who saw no signage (see Table 2). Participants shown the SC sign rated flavoured milk as significantly less healthy than participants shown the HSR sign. Those shown the SC sign also rated high HSR drinks containing sugars as significantly less healthy than those shown the HSR sign or no sign. Perceptions of the healthiness of diet drinks and water did not vary by condition.
Participants’ perceptions of the SC of each drink category were unaffected by exposure to POS signs (see Table 2).
Knowledge about sugar-sweetened beverages
For the measure asking participants to nominate the number of teaspoons of sugar in a 600 ml bottle of soft drink, there was a significant effect of POS signage condition; 39 % of participants who saw the SC sign nominated the correct number of teaspoons compared with just 6 % of participants who saw no sign and 4 % who saw the HSR sign (see Table 2).
Self-reported prior campaign exposure
Overall, 18 % of participants indicated they had previously seen the 13 Cancers video advertisement, with exposure more prevalent among those residing in Victoria (52 %) compared with other states (4 %; χ 2(1) = 305·72, P < 0·001). Exploratory analyses showed no significant interaction between prior exposure to the 13 Cancers campaign and POS signage condition for selection of each drink category in the choice task or perceptions of the healthiness and SC of each drink category (nor were there any significant main effects of campaign exposure). Sub-group analysis of the control condition (no POS sign) showed no difference in drink preference by campaign exposure.
Point-of-sale signage ratings
Table 3 shows participants’ mean cognitive and emotional responses to the POS signs. The SC sign was rated significantly higher than the HSR sign on most cognitive response measures including making participants feel concerned, teaching them something new, believing it made a strong argument and was effective, and being likely to prompt discussion with others. The SC sign provoked significantly stronger emotional responses for feelings of surprise, worry, disgust and anxiety. The HSR sign made participants feel significantly more reassured and bored than the SC sign. Both POS signs were rated favourably (above the mid-point of scale) for making participants feel motivated to reduce their own sugary drink consumption, and this did not differ significantly by condition.
Table 3 Participants’ cognitive and emotional responses to point-of-sale signs

Boldfaced figures highlight where a point-of-sale sign produced a stronger response among participants than the other sign. Differences were assessed using independent samples t tests. *P < 0·05; **P < 0.01; ***P < 0·001.
Discussion
This study testing adolescents’ reactions to POS signs about the nutritional content of SSB found that the SC sign generally performed better than the HSR sign in terms of emotional and cognitive responses; however, neither intervention influenced hypothetical drink purchasing preferences. There was no evidence that adolescents’ responses to the POS signs were affected by prior exposure to the 13 Cancers campaign.
Drink preferences
The majority of adolescents chose an SSB in the simulated purchase task, with only a minority choosing water. POS signs did not promote significant reductions in preference for SSB or an increase in preference for water among this sample of teens, most of whom were regular SSB consumers at baseline. The lack of impact of these POS interventions on adolescents’ drink preferences differs to previous Australian research testing HSR and SC POS signs with adults(Reference Scully, Morley and Wakefield26) and FOP labels with young adults(Reference Billich, Blake and Backholer40), where significant reductions in simulated purchase preference for SSB were found. Findings suggest that adolescents’ drink preferences may be less affected by such interventions than adults.
The two earlier studies further included graphic health warnings among the interventions tested. The study with young adults found graphic health warnings were most impactful on preferences, while the study with adults found strongest effects for SC over graphic health warnings and HSR. A recent meta-analysis of international research on SSB warnings (with predominantly adult participants) found health warnings (e.g. Beverages with added sugar contribute to obesity) tend to be more impactful than nutrient warnings highlighting nutrients of concern (e.g. High in sugar) in influencing SSB preferences(Reference Grummon and Hall29), with similar conclusions reached in a new systematic review of SSB POS signs and FOP labels(Reference Gupta, Billich and George28). However, the meta-analysis did not include nutrition labelling schemes that are designed to convey qualitative information about healthiness (i.e. summarising positive as well as negative nutritional attributes), such as the HSR. It may be that health warnings highlighting detrimental impacts of SSB consumption are required to promote substantial change in teens’ SSB purchasing beyond what can be achieved with nutrition warnings highlighting problematic ingredients (e.g. SC) or qualitative schemes summarising positive and negative nutritional attributes of products (e.g. HSR). Future research could test this hypothesis. Including adolescents, young adults and adults in one study could provide insights into age-related differences in responses. While implementing health warnings about SSB may prove to be the optimal strategy for effectively curbing SSB consumption, in the current food retail environment in Australia, it is more likely that POS nutrition information about SSB will be mandated ahead of health warnings; hence, our focus on testing these interventions in the present study.
Product perceptions and knowledge
The SC POS sign prompted teens to rate SSB as less healthy, with no such effect found for HSR. Whereas, in our analogous study with adults, both interventions promoted lower perceptions of healthiness for SSB, although effects were stronger for the SC sign(Reference Scully, Morley and Wakefield26). Teens who saw the SC sign also rated high HSR drinks containing sugars as less healthy than teens who saw the HSR sign or no sign; the SC sign also prompted teens to rate flavoured milk as less healthy compared with the HSR sign. In both the teen and adult study, SC signs prompted more accurate estimations of the number of teaspoons of sugar in regular soda, but no such effect was found for the HSR sign. The singular communication highlighting SC increased perceptions of product unhealthiness and improved accuracy in estimating SC more effectively than the global indicator of nutritional content, the HSR.
Reactions to point-of-sale signage
We assessed emotional and cognitive reactions to the POS signs using measures of perceived message effectiveness, predictive of health-related intention and behaviour change(Reference Brennan, Durkin and Wakefield44,Reference Davis, Nonnemaker and Duke45) . Cognitive responses were significantly more favourable for the SC sign than the HSR sign, with the former rated as more understandable, informative, convincing and effective as well as prompting greater feelings of concern, ‘stopping and thinking’ and being something teens would discuss with others. The SC sign also promoted stronger emotional responses than the HSR sign (e.g. surprise, disgust), except the HSR was rated as more reassuring (probably because the HSR is gain framed) and more boring (possibly because of prior familiarity with the HSR scheme or greater cognitive effort required to understand and interpret HSR). Results indicate SC signs are more attention grabbing and easier for teenagers to understand at a glance than HSR. These findings for teens echo those for adults, where SC signs tended to out-perform HSR signs on cognitive, emotional and motivational measures.
Effects of campaign exposure
Contrary to our study with adults, we did not find any evidence that teenagers’ reactions to the POS signs varied based on whether they had previously seen the 13 Cancers mass media campaign, nor were there main effects of prior campaign exposure on teens’ drink preferences and perceptions. Possible explanations for the lack of observed campaign effects for adolescents may relate to participants’ level of prior campaign exposure or to the content of the campaign advertisement. Australian teens have different media usage and advertising exposure patterns to adults(46). Because the television-led media buy targeted adults (aged 25–54 years), the teens in our study who recalled seeing the campaign may not have had a sufficient ‘dose’ of exposure to yield substantive impacts on their preferences for SSB. However, if ample exposure was achieved, an alternative explanation could be that the campaign advertisement itself did not engage and persuade teenagers sufficiently to influence their preferences. While the weight of evidence from research on POS communications about SSB indicates graphic health effects messaging to be especially impactful(Reference Gupta, Billich and George28,Reference Grummon and Hall29) and previous research testing reactions to different types of weight and lifestyle campaigns found graphic health effects advertisements to be the most persuasive with adults(Reference Dixon, Scully and Durkin47,Reference Dixon, Murphy and Scully48) , we cannot rule out the possibility that teens are less responsive to such interventions than adults. Nonetheless, there is evidence that public health campaigns employing graphic health effects can impact teenagers’ behaviour. A youth-targeted graphic health effects campaign on smoking that employed vivid, confronting imagery and achieved very high reach, was associated with more negative attitudes towards tobacco products and higher risk perceptions of smoking and reduced population level smoking initiation(Reference Duke, MacMonegle and Nonnemaker49,Reference Huang, Lazard and Pepper50) . A national survey of Australian secondary students found SSB consumption declined from 2009 to 2018, with steeper declines in Western Australia(Reference Gascoyne, Scully and Wakefield51), the only Australian state to have had a sustained, comprehensive obesity prevention mass media campaign within that period (LiveLighter ®(23,52) ), which included graphic health effects messaging and urged consumers to reduce their consumption of energy-dense nutrient-poor food and drinks including SSB. Findings are consistent with this graphic health effects campaign hastening declines in teens’ SSB consumption. Future research could test adolescents’ reactions to youth-targeted graphic health effect campaign messaging about SSB where reach and frequency of exposure can be established.
Limitations and future research
We acknowledge this study has limitations. We tested a hypothetical drink purchasing scenario after a single exposure, so cannot be certain how POS interventions would impact teens’ actual SSB purchasing or consumption. The screening question requiring participants to report their usual frequency of consuming SSB and water prior to being exposed to the experimental POS manipulation could have led to demand effects. Trialling such interventions in real-world settings that offer repeated exposure to signage and include longer follow-up of behavioural impacts should be a priority for future research(Reference Kirkpatrick, Raffoul and Maynard21,Reference Lane, Porter and Estabrooks53) . Our control condition consisted of no POS sign (rather than a control sign unrelated to SSB) to reflect the current retail environment in Australia, so it was not a truly equivalent control condition. Due to challenges in recruiting a sufficiently large sample of adolescents to have adequate power to detect intervention effects, we were constrained in the number of POS signage conditions we could test, so focused on those considered most feasible to implement in Australia’s ‘real world’ food retail environment. Given a recent meta-analysis(Reference Grummon and Hall29) and systematic review(Reference Gupta, Billich and George28) (published after this experiment was conducted) found health risks messaging tends to be more impactful than nutrient-related information in discouraging SSB purchasing preferences, future research should test graphic health risks POS messaging with adolescents.
As our study sought to explore impacts of the POS interventions on teens who consumed SSB at least monthly, we cannot be certain how less frequent consumers would respond. Compared with Australian adolescent population data, the sample comprised a slightly higher proportion of males(54) and was skewed towards higher BMI(55). The sample was broadly similar for area-based SEP compared with the general Australian population(41). Because adolescents tend to be more concerned with reward relative to risk than adults(Reference Albert, Chein and Steinberg56), their drink choices may be more motivated by immediate rewards (e.g. taste, affordability, social norms) than concerns about nutrition or long-term health risks. This could at least partly explain why we found that teenagers’ drink preferences were not impacted by the POS signs we tested, whereas two previous studies found that adults reduced their preference for SSB in response to similar interventions(Reference Scully, Morley and Wakefield26,Reference Billich, Blake and Backholer40) . Future research could examine teens’ responses to SSB health messaging that appeals to immediate, reward-related drivers of drink choices to test whether this is more impactful than messaging focused on health or nutrition information alone. Testing Australian teens’ responsiveness to price-related interventions (e.g. simulating an SSB tax) would also be useful, since data from countries with an SSB tax show such policy reduces sales and consumption of SSB, while increasing consumption of healthier alternatives(Reference Du, Tugendhaft and Erzse57). It would be useful to assess motives underlying drink choices following intervention exposure.
Conclusions and implications
This study tested adolescents’ responses to graphic POS signs summarising nutritional information about SSB, and whether prior exposure to a public health campaign about SSB influenced preferences. Of the POS signs tested, SC performed better than the HSR on most beliefs and perceptions, although neither promoted reduced preference for SSB in the simulated purchasing task. While SC messaging outperformed the HSR in promoting beneficial changes in beliefs and emotions known to underlie behaviour change, we could be more confident in the capacity of this message format to assist with teen-targeted obesity prevention efforts if behavioural effects were found. As evidenced by the international research on SSB health warnings and nutrient warnings(Reference Grummon and Hall29), this study further highlights the need for research testing effects of SSB POS interventions in ‘real world’ retail settings, where actual purchasing behaviour can be assessed. In contexts where such interventions have now been mandated, these data are beginning to emerge. For example, longitudinal evidence from Chilé demonstrated that purchases of SSB declined significantly following implementation of laws requiring FOP warning labels and restrictions on child-directed marketing for unhealthy foods and drinks(Reference Taillie, Reyes and Colchero58). However, in contexts where these interventions are absent, or inconsistently implemented (as is the case in Australia for the HSR), intervention impacts can only feasibly be assessed in smaller experimental trials. National surveys of Australian adults show strong public support for government action around SSB, with around 90 % of those surveyed supportive of text warning labels on drink containers and government campaigns warning of adverse health effects of SSB consumption(Reference Miller, Dono and Wakefield59). Available evidence suggests such interventions highlighting health harms of SSB at the POS may be more impactful than those that only highlight nutritional information. So long as Australian teenagers continue to be bombarded with SSB product marketing(Reference Chapman, Nicholas and Banovic60–Reference Haynes, Bayly and Dixon64), with no nationally mandated POS interventions providing them with salient, consistent health and nutrition information about SSB, it is likely their high consumption of these products will persist. Stronger public health action and intervention will be required to curb adolescents’ SSB consumption and realise the associated health benefits among this important population sub-group.
Acknowledgements
Acknowledgements: The authors thank Hannah Ngaei for designing and producing the two POS signs that were used as experimental stimuli in this research. Financial support: We gratefully acknowledge the Peter Griffin and Terry Swann Foundation for their funding support, which enabled us to conduct this research. Conflict of interest: All authors are employed by a non-profit organisation that conducts public health interventions, research and advocacy aimed at reducing the population’s cancer risk, including risks pertaining to diet and obesity. Authorship: H.D. designed the study, with input from all other authors. M.S. managed the data collection. H.D. and M.S. wrote the manuscript and analysed and interpreted the data, with critical input from M.W. and B.M. All authors have seen and approved the contents of the submitted manuscript. Ethics of human subject participation: This study was conducted according to the guidelines laid down in the Declaration of Helsinki, and all procedures involving human subjects were approved by Cancer Council Victoria’s Institutional Research Review Committee. Written consent was obtained from all subjects.