Reducing stunting in the first 5 years of life is the number-one goal of the WHO 2025 Global Nutrition Targets(1). In 2016, approximately 155 million children under 5 years of age were stunted globally, with the majority residing in Asia (87 million)(2). Indonesia has the fifth-highest burden of stunting in the world, with a prevalence of 36 % among children under 5 years(3). Stunting is associated with both short-term and long-term adverse consequences, including impairments in motor and neuro-cognitive development, poor educational achievement, and in adulthood, low wages and productivity(Reference de Onis and Branca4).
In low-income countries stunting arises from multiple causes, including suboptimal health conditions, poor caring practices and inadequate nutrition. At 6 months of age breast milk alone is no longer sufficient to support the optimal growth of full-term infants, so the nutritional adequacy of complementary foods becomes critical. Unfortunately, major deficits in micronutrient intakes have been reported in plant-based complementary foods commonly used in low-income countries(Reference Gibson, Ferguson and Lehrfeld5), some of which are potentially growth-limiting(Reference Gibson, Hotz, Martorell and Haschke6). In response to these concerns, the WHO developed a set of population-level complementary feeding indicators designed to predict both dietary quality and the adequacy of energy intake(7, 8). Of these, dietary diversity (DD) was developed as a proxy indicator of the adequacy of the micronutrient density of complementary diets(7), and reported to be an important predictor of stunting, based mainly on cross-sectional studies(Reference Arimond and Ruel9–Reference Menon, Bamezai and Subandoro11). However, the usefulness of DD as a proxy for micronutrient density adequacy and subsequent linear growth appears limited when fortified infant foods are consumed(Reference Mallard, Houghton and Filteau12, Reference Diana, Mallard and Haszard13). An additional factor complicating the interpretation of data on adequacy of micronutrient densities is the frequently reported low-energy content of Southeast Asian complementary diets(Reference Diana, Mallard and Haszard13–Reference Arsenault, Yakes and Islam18). Moreover, linking a single micronutrient to linear growth may also be inappropriate in view of the complex interrelationships that exist between metabolic pathways. Micronutrients occur in combination in complementary foods, and some are highly correlated(Reference Cespedes and Hu19), making it difficult to distinguish the independent contribution of a single micronutrient.
Principal component analysis (PCA) offers a method by which patterns of nutrient intake can be identified in the population of interest and scored according to their frequency of intake. While PCA is commonly used to identify dietary patterns using food intake data in adults(Reference Hu20), it has not been used before to derive nutrient pattern scores in infants, despite having the potential to assess the overall nutrient quality of the diet at an age when food intake is often low and of limited variety. Furthermore, as nutrients, unlike foods, are common to all diets, nutrient pattern scores can be used to assess the quality of the diet across many populations.
Therefore, in the present study we extend our earlier assessment of the complementary diets of Indonesian infants(Reference Diana, Mallard and Haszard13) to develop and validate nutrient quality scores using PCA at 6, 9 and 12 months of age. Subsequently, the association of nutrient quality scores with linear growth and stunting is determined both cross-sectionally and longitudinally.
Methods
Study population
Details of the collection of the data on complementary feeding practices and infant growth have been published earlier(Reference Diana, Mallard and Haszard13). Briefly, infants randomly selected from all thirty villages in three sub-districts of Sumedang District, West Java, were enrolled at 6 months and followed at 9 and 12 months of age. The present study was conducted according to the guidelines laid down in the Declaration of Helsinki, and all procedures involving human subjects/patients were approved by the Human Ethics Committees of Universitas Padjadjaran, Indonesia (132/UN6C2.1.2/ KEPK/PN/2014), and the University of Otago, New Zealand (H14/022). Informed written consent was provided by the parents or primary guardians of the children. A sample size of 200 healthy breastfed infants was required for the primary aim of the research which was to estimate the prevalence of stunting (length-for-age Z-score (LAZ) < –2 sd) with a 95 % CI precision of at most 7 %.
Socio-demographic, anthropometric and inflammation measurements
Pre-tested structured questionnaires were used to collect information on the socio-demographic status of the participants, as described previously(Reference Diana, Mallard and Haszard13). For assessing face validation of nutrient pattern scores, these measures were collapsed into binary variables. Maternal education was categorised as primary school or less and secondary school or higher, whereas the first two lowest quintiles and the last three highest quintiles of a wealth index were used to categorise low and high socio-economic status, respectively.
Weight and length were measured in infants at ages 6, 9 and 12 months using standard protocols(21). LAZ, weight-for-length Z-scores and weight-for-age Z-scores were calculated from anthropometric measurements using the WHO Child Growth Standards(22) and WHO AnthroPlus 3.2.2. LAZ were then categorised into stunted (LAZ < –2) and non-stunted (LAZ ≥ –2). Inflammation was assayed using serum C-reactive protein and α-1-acid glycoprotein(Reference Thurnham, McCabe and Haldar23), and measurements were categorised into inflammation (serum C-reactive protein > 5 mg/l and α-1-acid glycoprotein >1 g/l) and non-inflammation (serum C-reactive protein ≤ 5 mg/l and α-1-acid glycoprotein ≤ 1 g/l).
Assessment of intakes of complementary foods
Intakes of complementary foods were assessed via in-home weighed food records completed by trained community cadres on 2 non-consecutive days within 1 week, as described earlier(Reference Diana, Mallard and Haszard13). Energy and nutrient intakes were calculated on each of the 2 record days using an Indonesian food composition table compiled by the investigators(Reference Diana, Mallard and Haszard13). All wheat flour products were adjusted to reflect the mandatory nutrient fortification levels (thiamine 2·5 mg/kg, riboflavin 4 mg/kg, Fe 50 mg/kg, Zn 30 mg/kg and folic acid 2 mg/kg)(24). The Multiple Source Method programme used the 2 d of food record to calculate for each infant an estimate of their usual intake of each micronutrient from complementary foods(Reference Harttig, Haubrock and Knuppel25). Micronutrients assessed were vitamin A, ascorbic acid, thiamine, riboflavin, niacin, Ca, Fe and Zn, chosen on the basis of reliable data in our Indonesian food composition table and earlier reports of deficiencies of growth-limiting micronutrients in Indonesian infants(Reference Dijkhuizen, Wieringa and West26). Vitamin A intakes were calculated as retinol activity equivalents to take into account the recent bioequivalence factors for conversion of β-carotene to vitamin A(27).
Complementary food indicator variables
The individual weighed food record data were used to assess whether each infant met or did not meet (yes/no) the following indicators: minimum dietary diversity (MDD) and consumption of five selected sentinel (i.e. nutrient-dense) foods or food groups. MDD was defined as the consumption of at least four of the seven WHO food groups consumed at least once during the 2 d of food records at each age(Reference Diana, Mallard and Haszard13). The seven food groups used with no minimum quantity of consumption defined were: (1) grains, roots and tubers; (2) legumes and nuts; (3) dairy products (milk, yogurt, cheese; infant formula); (4) eggs; (5) flesh foods (meat, fish, poultry and liver/organ meats); (6) vitamin A-rich fruits and vegetables; and (7) other fruits and vegetables(28, 29). Significant ingredients in mixed dishes were allocated to food groups separately. The five sentinel foods or food groups comprised Fe-rich foods (i.e. flesh foods, Fe-fortified foods specially designed for infants and young children), flesh foods (i.e. fish, meat, poultry and organ meat), eggs, animal-source foods (i.e. dairy products, flesh foods and eggs) and infant fortified foods, each defined as being consumed at least once out of the 2 record days(Reference Diana, Mallard and Haszard13). The fortified infant foods comprised infant formulae, fortified infant cereals and rusks.
Statistical analysis
As micronutrient intakes tended to be right-skewed for at least one of the time points, all nutrient intakes were log-transformed. To allow all micronutrients to be considered on the same scale, log-transformed intakes were then standardised. PCA was used to determine nutrient patterns using all eight micronutrients (vitamin A, ascorbic acid, thiamine, riboflavin, niacin, Ca, Fe and Zn) at each age (6, 9 and 12 months). A scree plot determined that there was only one nutrient pattern present at all ages. The resulting nutrient quality scores were calculated by multiplying the log-transformed standardised micronutrient intakes by the factor loading generated by the PCA and summing for all eight micronutrients. These scores effectively rank participants on their intake of micronutrients – infants with a high score will have high intakes of all micronutrients; infants with a low score will have low intakes of all micronutrients; and infants with scores in the middle will have varying intakes of micronutrients. The proportion of total variance explained by the nutrient pattern was calculated at each age, along with Cronbach’s α to assess the internal consistency of the score.
To test the face validity of the nutrient quality scores, means and standard deviations were calculated, stratified by socio-economic status, maternal education, inflammation and complementary food intake indicators (MDD, Fe-rich foods, flesh foods, eggs, animal-source foods and infant fortified foods). The hypotheses were that nutrient quality would be higher in infants with mothers of higher socio-economic status and maternal education, and higher in infants with a lower level of inflammation, and who met the complementary food indicators. To assess how nutrient quality scores tracked from 6 to 9 months and 9 to 12 months, pair-wise correlations were undertaken.
The cross-sectional and longitudinal associations between nutrient quality scores and LAZ were assessed using linear regression. There were three models generated for each time point: an unadjusted model between nutrient quality and LAZ (outcome variable); an energy-adjusted model, which adjusted for energy intake; and a fully adjusted model which further adjusted for wealth index quintile, maternal education, maternal height and inflammation. Regression coefficients, 95 % CI and P values were calculated for each model. The same approach was taken to assess the association between nutrient quality and stunting but using logistic regression. To assess the fit of the multivariate models, residuals were plotted for linear regression models and visually assessed for homogeneity of variance and normality, and the Hosmer–Lemeshow test, with groups of ten, carried out for the logistic regression models. A significant level of P<0·05 was used. All data were analysed using Stata® 15.1 (StataCorp LP).
Results
Baseline maternal, socio-demographic status and neonatal characteristics have been published earlier(Reference Diana, Mallard and Haszard13). Of the 230 infants enrolled (53·5 % female), 190 completed the study (completion rate, 82·6 %), of whom most (217/218, 99·5 %) had consumed complementary food at age 6 months(Reference Diana, Mallard and Haszard13). Mean maternal age was 27·5 (sd 7·2) years. Mean LAZ declined with increasing age, and the prevalence of stunting increased from 15·7 (95 % CI 11·3, 20·9) % at 6 months to 22·6 (95 % CI 17·6, 29·8) % at 12 months.
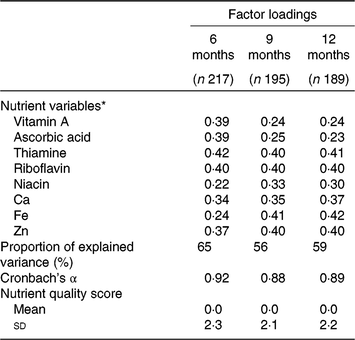
Table 1 shows the factor loadings for the nutrient patterns. The higher the loading, the greater influence on the nutrient quality score. All micronutrients included in this analysis contributed positively to the one nutrient pattern seen at each age with loadings between 0·22 and 0·42, suggesting that the scores represent a diet high in nutrient quality. Thus, we refer to the scores as ‘nutrient quality’ scores hereafter. The proportion of total variance explained by the micronutrients was reasonably high, at 65, 56 and 59 % at 6, 9 and 12 months, respectively. Internal consistency was also high, indicating strong correlations between micronutrient intakes. Scores ranged from –13·6 to 4·5 at age 6 months; –6·8 to 4·2 at age 9 months; and –6·4 to 5·5 at age 12 months.
Table 1. Factor loadings, explained variance and internal reliability of nutrient quality scores from principal components analysis of micronutrient intakes at age 6, 9 and 12 months

* Nutrient variables are from 2-d weighed diet records, adjusted for usual intake at the individual level, log-transformed and standardised.
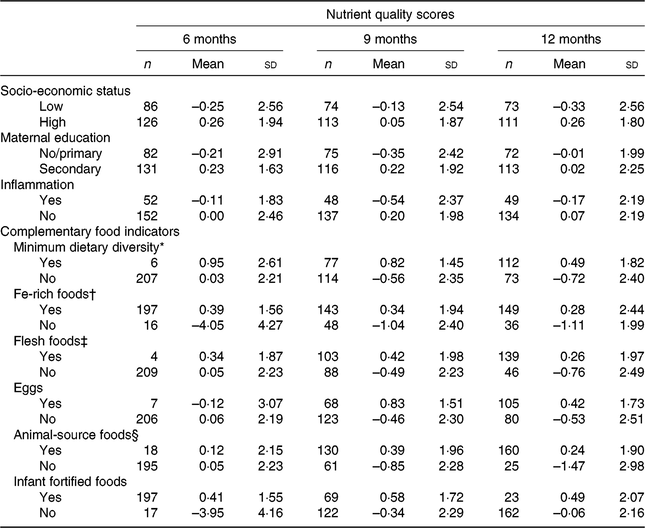
The nutrient quality scores at each age agreed with the pre-specified hypotheses, with higher scores in infants of mothers with higher socio-economic status and higher education, and those infants with no evidence of inflammation and complementary diets that met the following indicators: MDD and consumption of the five sentinel foods or food groups at least once during the 2 record days (Table 2). These results provide face validation for the nutrient quality scores generated and confirm they are likely to be measuring the concept of a diet high in nutrient quality. Nutrient quality scores did not track strongly across infant ages – the correlations between 6 months and 9 months, and between 9 and 12 months were 0·07 (P = 0·36) and 0·17 (P = 0·020), respectively.
Table 2. Face validity of nutrient quality scores with baseline demographic, inflammation and complementary food indicator variables at 6, 9 and 12 months
(Mean values and standard deviations)

* Minimum dietary diversity: consumption of four or more food groups at least once during the 2 record days.
† Fe-rich foods: flesh foods, Fe-fortified foods specially designed for infants and young children.
‡ Flesh foods: fish, meat, poultry and organ meat.
§ Animal-source foods: dairy products, flesh foods and eggs.
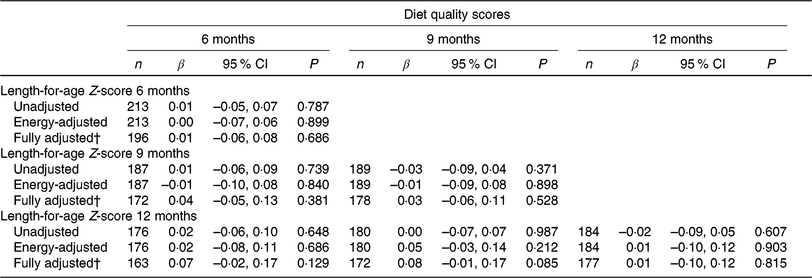
The association between nutrient quality score and LAZ is presented in Table 3. Three models were generated for each time point: an unadjusted model, an energy-adjusted model and a fully adjusted model. Nutrient quality score showed a consistent positive trend with LAZ in the fully adjusted models at 6, 9 and 12 months, although none was statistically significant. The regression coefficients (β) were greater when diet quality score at younger ages (6 and 9 months) were used to predict later LAZ.
Table 3. Cross-sectional and longitudinal associations between nutrient quality score and length-for-age Z-scores at 6, 9 and 12 months
(β Coefficients* and 95 % confidence intervals)

* Regression coefficient with length-for-age Z-score as the outcome variable and diet quality score as the exposure variable.
† Fully adjusted model adjusted for energy intake, wealth index quintile, maternal education, maternal height and inflammation.
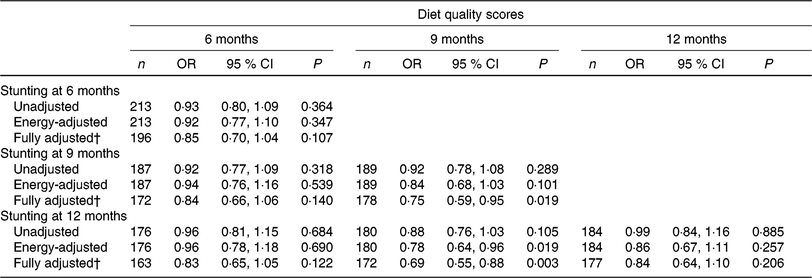
Both cross-sectional and longitudinal associations between nutrient quality score and stunting were explored with logistic regression analysis; and the results showed a protective trend (Table 4). OR are presented for each point higher in nutrient quality score. The odds of being stunted at 9 and 12 months of age was 25 and 31 % lower for children with a higher nutrient quality score at 9 months (OR 0·75, 95 % CI 0·59, 0·95 and OR 0·69, 95 % CI 0·55, 0·88, for the fully adjusted models), respectively.
Table 4. Cross-sectional and longitudinal associations between nutrient quality score and odds of stunting at 6, 9 and 12 months*
(Odds ratios and 95 % confidence intervals)

* Logistic regression was used to explore associations between diet quality score and stunting; and OR were estimated from these equations.
† Fully adjusted model adjusted for energy intake, wealth index quintile, maternal education, maternal height and inflammation.
Discussion
To our knowledge this is the first study to develop and validate a nutrient quality score using PCA and to examine its relationship with linear growth and stunting during infancy. Our nutrient quality score was higher in those infants whose mothers had a higher socio-economic status and higher education, and in those infants with lower levels of inflammation, and whose complementary diets met our selected complementary food indicators (Table 2). Furthermore, cross-sectional and longitudinal associations between our nutrient quality score and both LAZ and stunting suggest positive and protective effects of a diet high in micronutrient quality at each age.
The increasing practice of consuming supplements and fortified foods has led to the concept that ‘people have come to eat nutrients as nutrients’ rather than foods(Reference Solomons and Vossenaar30). Unlike foods, nutrients are largely universal and involved in the complex interactions in the body with cumulative effects that cannot be captured by studying the effects of a limited number of food groups or a single nutrient or dietary component. Here we used PCA to summarise eight correlated nutrients into a single independent principal component that explained about 60 % of the total variability in nutrient intakes at each age. The pattern found was characterised by positive loadings of micronutrients that tend to be correlated at the individual level with animal-source foods (e.g. Fe, Zn and Ca) and that reflect biological mechanisms associated with linear growth. Hence it was not unexpected that our nutrient quality score based on this nutrient pattern had positive and protective effects with both LAZ and stunting at each age.
Our nutrient quality score has several advantages compared with other dietary indicators. For example, the indicator DD or MDD used extensively to assess dietary quality does not include an assessment of amount of each food group consumed. This can be a major disadvantage in settings such as Asia where even very small amounts of specific food groups in mixed dishes (often soup-like) are counted when compiling the DD indicator, resulting in overestimates of DD and MDD. A second emerging limitation of the DD indicator is associated with the increased consumption of micronutrient-fortified foods by infants and young children in Asia(Reference Dewey and Adu-Afarwuah31–Reference Jack, Ou and Chea33), which results in a reduction in DD as noted earlier(Reference Mallard, Houghton and Filteau12, Reference Diana, Mallard and Haszard13). In contrast, the nutrient quality score used standardised micronutrient intakes from weighed food records in the calculation of the scores, so that infants who consumed lower amounts had a lower score.
We showed that a diet rich in those nutrients commonly found in animal products and fortified foods was related to a decreased risk of stunting. This relationship was particularly strong with diets at 9 months of age, with a trend suggesting the diets at younger ages affected later linear growth. After adjustment for demographic factors and inflammation, diet remained a strong predictor of stunting, reinforcing the need to investigate further the dietary interventions that best prevent health outcomes such as stunted growth.
Limitations also arise when applying the mean adequacy ratio (MAR) as an overall measure of dietary quality. MAR was developed as a proxy indicator of the adequacy of micronutrient intakes relative to the recommended intakes(Reference Kant34) and has been examined in relation to suboptimal linear growth(Reference Sanin, Islam and Mahfuz35). In the calculation of the MAR, each micronutrient is assigned the same importance, and the score is not weighted, and thus fails to identify the micronutrients which are not consumed in adequate amounts or correct for differences in bioavailability. As a result, a MAR of 1 (meaning requirements of all nutrients are met) does not guarantee adequacy and an MAR below 1 does not necessarily represent suboptimal intakes so it is not surprising that only weak or no relationships with linear growth(Reference Sanin, Islam and Mahfuz35) have been observed. By contrast, our nutrient quality score does not rely on adequacy cut-offs and therefore results in a score that represents, on a continuous scale, the nutrient quality of the diet consumed by the infant. Given the limitations of the current measures used to assess the relationship between diet and growth, the nutrient quality score developed here offers a more robust measure to determine the strength of association between diet quality and growth outcomes in infants.
PCA is a data-driven approach that will yield different results in different samples, making it difficult to compare scores across studies. However, it creates a measure that is more relevant to the sample under investigation and can more appropriately answer questions related to nutrient quality and health outcomes than the current measures of dietary intake that are commonly used. While PCA is frequently used with food group intakes to determine dietary patterns, in a sample that is exposed to fortification and has limited dietary variety, dietary patterns may be less useful for the identification of dietary risk factors than a nutrient quality pattern. Furthermore, nutrient quality patterns have the capacity to be more comparable across countries than dietary patterns.
Strengths and limitations
We identified a pattern that was characterised by positive loadings of micronutrients that tend to be correlated at the individual level with animal-source foods (e.g. Fe, Zn and Ca) and that reflect biological mechanisms associated with linear growth. Furthermore, we accounted for the role of mandatory wheat flour fortification in the nutrient composition values used to calculate nutrient intakes which were subsequently adjusted to estimate ‘usual intakes’ of each infant using the Multiple Source Method programme, strengthening the accuracy of the nutrient intake data. Nevertheless, despite measuring infant diet comprehensively with 2 non-consecutive days of in-home weighed food intakes, our study is limited by the number of nutrients included in the analysis, using only nutrients with reliable information in the Indonesian food composition table and for which deficiencies had been reported earlier among Indonesian infants(Reference Dijkhuizen, Wieringa and West26). Furthermore, the accuracy of our estimate of usual intake is limited by the collection of only 2 d of food record.
More recently, other exploratory methods besides PCA have been proposed to derive dietary and nutrient patterns, such as reduced rank regression and partial least-squares regression(Reference Hoffmann, Schulze and Schienkiewitz36–Reference Weikert and Schulze38), each with its own strengths and limitations, the choice depending on the study objectives(Reference DiBello, Kraft and McGarvey37–Reference Ocke39). We selected PCA, however, because of its flexibility to derive nutrient patterns, which are unconstrained by the choice of the response variables(Reference Hoffmann, Schulze and Schienkiewitz36, Reference DiBello, Kraft and McGarvey37).
In conclusion, through PCA we have identified a nutrient quality score that was associated with stunting in Indonesian infants. Our approach could be applied in other populations to obtain population-specific nutrient quality scores which also relate to linear growth. However, the aetiology of impaired linear growth is complex. To broaden our understanding of the multiple factors influencing linear growth, population-specific nutrient quality scores should be investigated simultaneously with other modifiable non-nutritional growth-limiting factors to identify multiple synergistic strategies to overcome the burden of stunting.
Acknowledgements
Special thanks to Anna Alisjahbana, Frontiers for Health, the people of the communities and our team of dedicated research assistants.
This work was supported by the Meat and Livestock Australia (L. H., R. S. G.) and University of Otago Research Grant (R. S. G.). The Meat and Livestock Australia and University of Otago research grant had no role in the design, analysis, or writing of this article.
The authors’ responsibilities were as follows – J. J. H., A. D., L. A. H. and R. S. G. designed the research; J. J. H., A. D. and L. D. analysed the data and interpreted the data with input from R. S. G. and L. A. H.; J. J. H., A. D., L. D. and R. S. G. wrote the manuscript; and all authors contributed to editing the manuscript and read and approved the final manuscript.
There are no conflicts of interest.


