


Likert-type items (Likert, Reference Likert1932) are one of the most widely-used multiple-response question formats for assessing no cognitive variables. In this type of item, the participant selects an option from a group of alternatives ordered by the level of agreement with the item statement. Positive forms of items (also called direct or non-reversed items) give high scores when the participant has a high level in the assessed trait. Negative forms of items (reversed) give low scores when the participant has a high level in the trait. Items can be reversed either by adding a negation to the item statement, a technique known as reverse orientation (e.g., from “I consider myself a good person” to “I do not consider myself a good person”) or by using reverse wording using antonyms (e.g., from “I consider myself a good person” to “I consider myself a bad person”; Suárez-Álvarez et al., Reference Suárez-Álvarez, Pedrosa, Lozano, García-Cueto, Cuesta and Muñiz2018; van Sonderen et al., Reference van Sonderen, Sanderman and Coyne2013). In applied research, one question to ask when constructing a scale is whether the scale should include reversed items.
Reversed items aim to control one of the main response biases in self-report measures: Acquiescence (Navarro-González et al., Reference Navarro-González, Lorenzo-Seva and Vigil-Colet2016). Acquiescence is defined as the tendency to agree with an item statement, disregarding its content (Paulhus & Vazire, Reference Paulhus, Vazire, Robins, Fraley and Krueger2005). It is not a response set bias (like social desirability) but a response style bias (like inattention; van Sonderen et al., Reference van Sonderen, Sanderman and Coyne2013). Despite widespread use, psychometric research generally does not advise this practice (Podsakoff et al., Reference Podsakoff, MacKenzie and Podsakoff2012; Vigil-Colet et al., Reference Vigil-Colet, Navarro-González and Morales-Vives2020), although some authors do defend it, declaring that a small number of negative items may cause slower, more careful reading of items (Józsa & Morgan, Reference Józsa and Morgan2017).
Reversed items complicate cognitive processing of item statements (Marsh, Reference Marsh1986; Suárez-Álvarez et al., Reference Suárez-Álvarez, Pedrosa, Lozano, García-Cueto, Cuesta and Muñiz2018; van Sonderen et al., Reference van Sonderen, Sanderman and Coyne2013), hence they are not considered advisable (Irwing, Reference Irwing, Booth and Hughes2018; Lane et al., Reference Lane, Raymond and Haladyma2016; Moreno et al., Reference Moreno, Martínez and Muñiz2015; Muñiz & Fonseca-Pedrero, Reference Muñiz and Fonseca-Pedrero2019). Furthermore, reversed items have a differential effect on participants depending on their cultures (Wong et al., Reference Wong, Rindfleisch and Burroughs2003), personality traits (DiStefano & Motl, Reference DiStefano and Motl2009), intelligence, and linguistic performance (Suárez-Álvarez et al., Reference Suárez-Álvarez, Pedrosa, Lozano, García-Cueto, Cuesta and Muñiz2018). In addition, reversed items complicate inter-item correlation estimations (Navarro-González et al., Reference Navarro-González, Lorenzo-Seva and Vigil-Colet2016), diminish items’ discriminatory power (Chiavaroli, Reference Chiavaroli2017; Józsa & Morgan, Reference Józsa and Morgan2017), reduce scale reliability (Carlson et al., Reference Carlson, Wilcox, Chou, Chang, Yang, Blanchard, Marterella, Kuo and Clark2011), and produce different scores in positive and negative items. With regard to the latter, inverted items usually lead to higher scores once their scores are redirected (Suárez-Álvarez et al., Reference Suárez-Álvarez, Pedrosa, Lozano, García-Cueto, Cuesta and Muñiz2018; Vigil-Colet, Reference Vigil-Colet, Navarro-González and Morales-Vives2020), as people tend to disagree more with negative items than with direct ones (i.e., people may doubt whether they “finish every task they start”, but will probably disagree with the idea of “not finishing every task they start”). However, Solís Salazar (Reference Solís Salazar2015) found higher scores for positive items, even when negative items are redirected.
Another problem caused by the use of reversed items is having worse dimensionality indexes in essentially-unidimensional constructs. In fact, a psychological construct could even move from being unidimensional to having two method factors when positive and negative items are mixed—one factor for positive and another for negative items—(Essau et al., Reference Essau, Olaya, Anastassiou-Hadjicharalambous, Pauli, Gilvarry, Bray, O’Callaghan and Ollendick2012; Horan et al., Reference Horan, DiStefano and Motl2003; van Sonderen et al., Reference van Sonderen, Sanderman and Coyne2013; Woods, Reference Woods2006). The grit construct is an example of this issue. Grit is a trait based on perseverance combined with passion for accomplishing long-term goals (Duckworth, Reference Duckworth2016; Duckworth & Quinn, Reference Duckworth and Quinn2009). The best-known scale for grit assessment is Grit-S (Duckworth & Quinn, Reference Duckworth and Quinn2009), which is supposed to assess two dimensions (perseverance of effort and consistency of interest). Here, negative items make up the first factor, while the second is made up of positive ones. Recent research has shown that grit has a unidimensional structure, with the bidimensional model being caused by reversed items (Areepattamannil & Khine, Reference Areepattamannil and Khine2018; Gonzalez et al., Reference Gonzalez, Canning, Smyth and MacKinnon2020; Morell et al., Reference Morell, Yang, Gladstone, Turci Faust, Ponnock, Lim and Wigfield2021; Postigo et al., Reference Postigo, Cuesta, García-Cueto, Menéndez-Aller, González-Nuevo and Muñiz2021; Vazsonyi et al., Reference Vazsonyi, Ksinan, Ksinan Jiskrova, Mikuška, Javakhishvili and Cui2019). Therefore, some grit scales have been developed following the unidimensional hypothesis, such as the Oviedo Grit Scale (EGO; Postigo et al., Reference Postigo, Cuesta, García-Cueto, Menéndez-Aller, González-Nuevo and Muñiz2021).
Research on item redirection usually uses unidimensional scales to show the effects of inverse items (Solís Salazar, Reference Solís Salazar2015; Suárez-Álvarez et al., Reference Suárez-Álvarez, Pedrosa, Lozano, García-Cueto, Cuesta and Muñiz2018; Vigil-Colet, Reference Vigil-Colet, Navarro-González and Morales-Vives2020). However, reversed items in the Grit-S scale produced a method factor that had serious consequences in terms of the substantive conceptualization of the construct. Given this, we believe that demonstrating what effects reversed items have on the Grit-s scale may be interesting for grit researchers. Applied researchers may also benefit from a clear example of how item reversal may affect scales in terms of item properties, total scores, factor structures, and reliability. It is important to analyze all of these differences, because although some properties may not vary between groups, this does not mean that the remaining properties will behave in the same way.
Another interesting point is the effect that reversed items might have when the scale is related to other variables. Although there is much research about how item reversal affects internal consistency, reliability, and even total scores (as previously explained), we have not found any studies mentioning the effects negative items can have in correlations with other psychological constructs. Previous research on grit has reported that high levels of grit are related to low levels of neurotic disorders, such as anxiety or depression (Datu et al., Reference Datu, King, Valdez and Eala2019; Musumari et al., Reference Musumari, Tangmunkongvorakul, Srithanaviboonchai, Techasrivichien, Suguimoto, Ono-Kihara and Kihara2018). It would be interesting to see how this relationship (grit-neuroticism) may be affected by item reversal.
The present study examines whether item reversal in Likert response format items influences the psychometric properties of a grit scale (Grit-S) and the relationship with another variable (Neuroticism).
First, we aim to determine how item reversal affects the factorial structure of the scale. As a consequence of the methodological artifact, we would expect scales that mix both types of items to have a bidimensional structure (caused by a methodological artifact), and the positive and negative versions to have a unidimensional structure. The second objective is to analyze possible changes in the total score due to using reversed items. If negative items tend to have higher scores, the more negative items in a scale, the higher the total scores. Thus, we would expect the negative version to have higher total scores than the mixed or original versions, which would both also have higher scores than the positive version. Third, we aim to show how reliability is affected by item reversal. As negative items usually correlate between each other more than positive ones (Solís Salazar, Reference Solís Salazar2015), and because the Cronbach’s alpha (α) coefficient is based on these correlations, negative scales should have higher reliability coefficients than positive scales. In addition, mixing the two types of items can force a scale from being unidimensional to being bidimensional. This would worsen the reliability coefficients, which are conceived to be estimated on unidimensional scales. Finally, the fourth objective is to analyze how correlations with another variable are affected by the use of reversed items. As explained above, grit has an inverse relation with Neuroticism, so negative correlations with the Neuroticism subscale of the NEO Five Factor Inventory (NEO-FFI) are expected, and this relationship should be stronger for the more reliable scales.
Method
Participants
The study sample comprised 991 Spaniards who completed an online questionnaire. 103 participants were excluded because they demonstrated suspicious response behavior (i.e., taking too much or too little time to answer the questionnaire or leaving some items unanswered). This sample was complemented by another 531 participants from the same population who took part in a previous study where Grit-S scales were applied.
The final sample consisted of 1,419 participants divided into five groups (Table 1). As the table shows, the different groups had similar mean ages, sex ratios, and levels of educational qualifications. Most of the sample had completed university (66.8%), followed by those who finished high school (19.0%), vocational training (10.2%), and secondary/primary school (4.0%).
Table 1. Sample Groups Regarding the Answered Scale
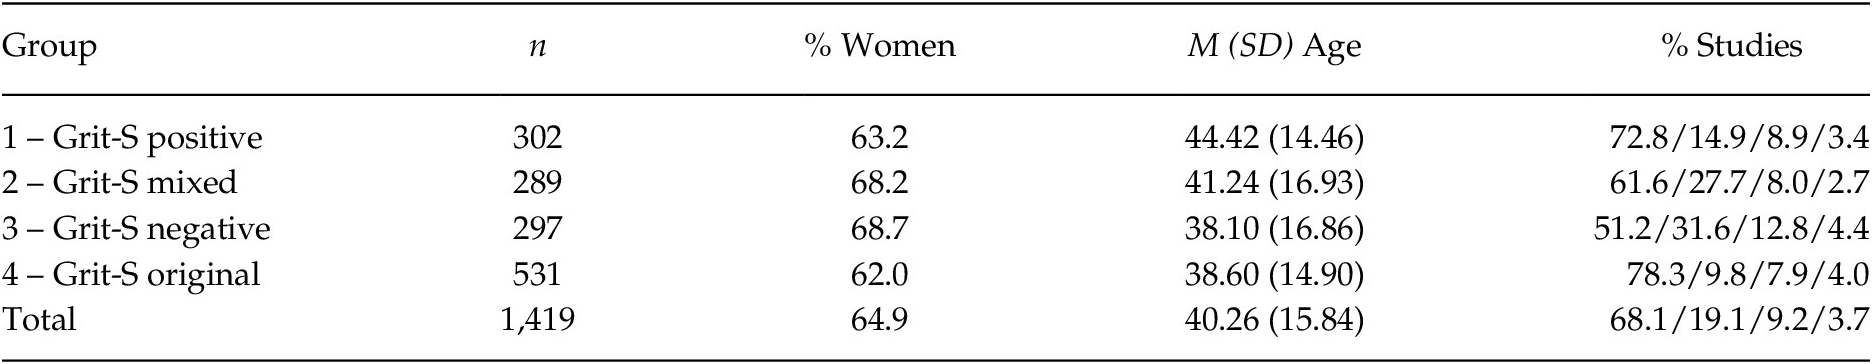
Note. M = mean; SD = standard deviation; % studies = university studies/high school/vocational training/secondary or primary studies.
The sample size is adequate for Exploratory Factor Analysis as each group contains over 200 participants and the scales have no more than 10 five-point Likert items (Ferrando & Anguiano-Carrasco, Reference Ferrando and Anguiano-Carrasco2010).
Instruments
Grit-S. Grit-S (Duckworth & Quinn, Reference Duckworth and Quinn2009) is a scale with eight items assessing two dimensions (four items for each dimension): Perseverance of effort and consistency of interest. The items use a five-point Likert response format. We used the Spanish version by Arco-Tirado et al. (Reference Arco-Tirado, Fernández-Martín and Hoyle2018), in which Cronbach’s alpha = .77 for the consistency of interest dimension, Cronbach’s alpha = .48 for the perseverance of effort dimension and Cronbach’s alpha = .75 for the total score. This version of the scale has five inverted items (the original English scale has four), four of which are in the consistency of interest dimension. Another three versions of the scale were developed (positive, negative, and mixed—explained below). The reversal process was as follows: a group of seven experts in Psychometrics and Psychological Assessment created several alternative versions for each original item (positives or negatives depending on the original item) using the reversed wording technique. The main reason for using reversed wording instead of reversed orientation is that the second one is not recommended by previous research (Haladyma & Rodríguez, Reference Haladyma and Rodríguez2013; Irwing, Reference Irwing, Booth and Hughes2018; Muñiz & Fonseca-Pedrero, Reference Muñiz and Fonseca-Pedrero2019). Afterwards, the representativeness of each alternative version was discussed. The versions with a minimum consensus of six out of seven (86%) experts were selected for developing the different scale versions. Hence, we created the Grit-S positive (all items in direct form), Grit-S negative (all items reversed) and Grit-S mixed (half of the items were randomly selected and inverted, disregarding their dimension). Although the original Grit-S scale is already a mixed scale, the reversed items in the Grit-S mixed version were randomly selected, and the consistency of interest dimension contains more than solely reversed items.
The four Grit-S scale versions are shown in Table A1 (see Appendix). The structure of each scale is given in Table A2 (see Appendix).
Neuroticism subscale, NEO-FFI test. The NEO-FFI test (Costa & McCrae, Reference Costa and McCrae1985) is an inventory for assessing personality following the Big Five personality model. The Neuroticism subscale is composed of 12 Likert-type items with five response categories from completely disagree to completely agree. It was adapted to Spanish by Cordero et al., (Reference Cordero, Pamos and Seisdedos2008). The original Cronbach’s alpha coefficient for the scale was .90. In this study, we found a Cronbach’s alpha coefficient of .86.
Procedure
Each group completed one scale in an online survey platform. The participants were found through non-probabilistic convenience sampling. Data collection lasted 5 months. Participants completed the scale anonymously and voluntarily without any compensation. All participants gave their informed consent, and their anonymity was ensured according to Spanish data protection legislation, Organic Law 3/2018, de 5th December, on Individual Data Protection and the Guarantee of Digital Rights (Ley Orgánica 3/2018, de 5 de diciembre, de Protección de Datos Personales y garantía de los derechos digitales).
Data Analysis
Dimensionality
Several Exploratory Factor Analyses (EFA) were conducted in order to assess the dimensionality of the scales. When items have five or more response alternatives, and skewness and kurtosis are less than one, a Pearson correlation matrix is advised for factorial analysis (Lloret-Segura et al., Reference Lloret-Segura, Ferreres-Traver, Hernández-Baeza and Tomás-Marco2014). The suitability of the matrix for factorial analysis was assessed using the Kaiser-Meyer-Olkin (KMO) and the Bartlett statistic. KMO should be greater than .80 to ensure a feasible analysis (Kaiser & Rice, Reference Kaiser and Rice1974). Robust Unweighted Least Squares (RULS) was used as an estimation method. To decide on the number of extracted factors, we used an optimal implementation of Parallel Analysis (PA; Timmerman & Lorenzo-Seva, Reference Timmerman and Lorenzo-Seva2011). The feasibility of the factorial structure was assessed using total explained variance and the Comparative Fit Index (CFI). More precisely, to assess the suitability of the unidimensional structure, we estimated Explained Common Variance (ECV; Ferrando & Lorenzo-Seva, Reference Ferrando and Lorenzo-Seva2017). CFI should be greater than .95 (Hu & Bentler, Reference Hu and Bentler1999), and ECV greater than .80 (Calderón Garrido et al., Reference Calderón Garrido, Navarro González, Lorenzo Seva and Ferrando Piera2019). The factor loadings of the different versions were compared using the Wrigley and Neuhous congruence coefficient (García-Cueto, Reference García-Cueto1994).
Descriptive Statistics, Item Analysis and Differences in Scores
We calculated descriptive statistics (mean, standard deviation, skewness, kurtosis and discrimination index) for each item in each grit scale. The discrimination index should be higher than .20 to consider an item a good measure of the trait (Muñiz & Fonseca-Pedrero, Reference Muñiz and Fonseca-Pedrero2019). To verify if reversed items had significantly affected the total Grit-S scores, ANOVA between scale versions (original, positive, negative, mixed) was performed.
Reliability
Scale reliability was assessed using Cronbach’s alpha. We computed Feldt’s w statistic (Feldt, Reference Feldt1969) to assess whether there were significant differences between the reliability of the scales.
Descriptive statistics, ANOVA and the t-test were estimated using IBM SPSS Statistics (Version 24). Reliability and EFAs were assessed using FACTOR 12.01.01 (Lorenzo-Seva & Ferrando, Reference Lorenzo-Seva and Ferrando2013).
Correlations with Other Variables
Three versions of the Grit-S scale (positive, negative, mixed) were correlated with the Emotional Stability score of the NEO-FFI test. We could not estimate the correlation for the original version of the Grit-s as this sample did not complete the Emotional Stability scale.
Results
Dimensionality
A total of four EFAs were conducted, one for each version of the scale. Optimal Implementation of Parallel Analysis recommended one dimension in all versions of the scale (see Figure 1). Table 2 shows the KMO, Bartlett significance level, percentage of total explained variance, ECV and CFI for each version of the scale. Table 3 shows the comparisons between factorial loadings of the four Grit-S scales.

Figure 1. Results of the Optimal Implementation of Parallel Analysis
Table 2. Fit Indices of Exploratory Factor Analysis for Grit Scale Versions

Note. KMO = Kaiser-Meyer-Olkin statistic. ECV = Explained Common Variance. CFI = Comparative Fix Index. α = Cronbach’s α.
Table 3. Factorial Loadings Comparison of Grit Scale Versions

Note. (−) = negative; (+) = positive; (M) = mixed; (O) = original; rc = Congruence coefficient.
The Grit-S negative version gave the best fit, followed by the positive, original, and mixed versions. The original and mixed versions did not reach the requirement established for KMO and ECV, thus indicating a bad fit to a unidimensional structure.
Descriptive Statistics, Item Analysis and Differences in Scores
Descriptive statistics for the items are shown in Table 4. The items from the versions of the Grit-S scale had means between 2.58–4.26 and standard deviations between 0.79–1.27. Apart from the kurtosis value for Item 2 (–1.00) and the skewness value for Item 5 (–1.28)—both from the negative Grit-S scale—all skewness and kurtosis indexes were between ±1.
Table 4. Descriptive Statistics of the Items
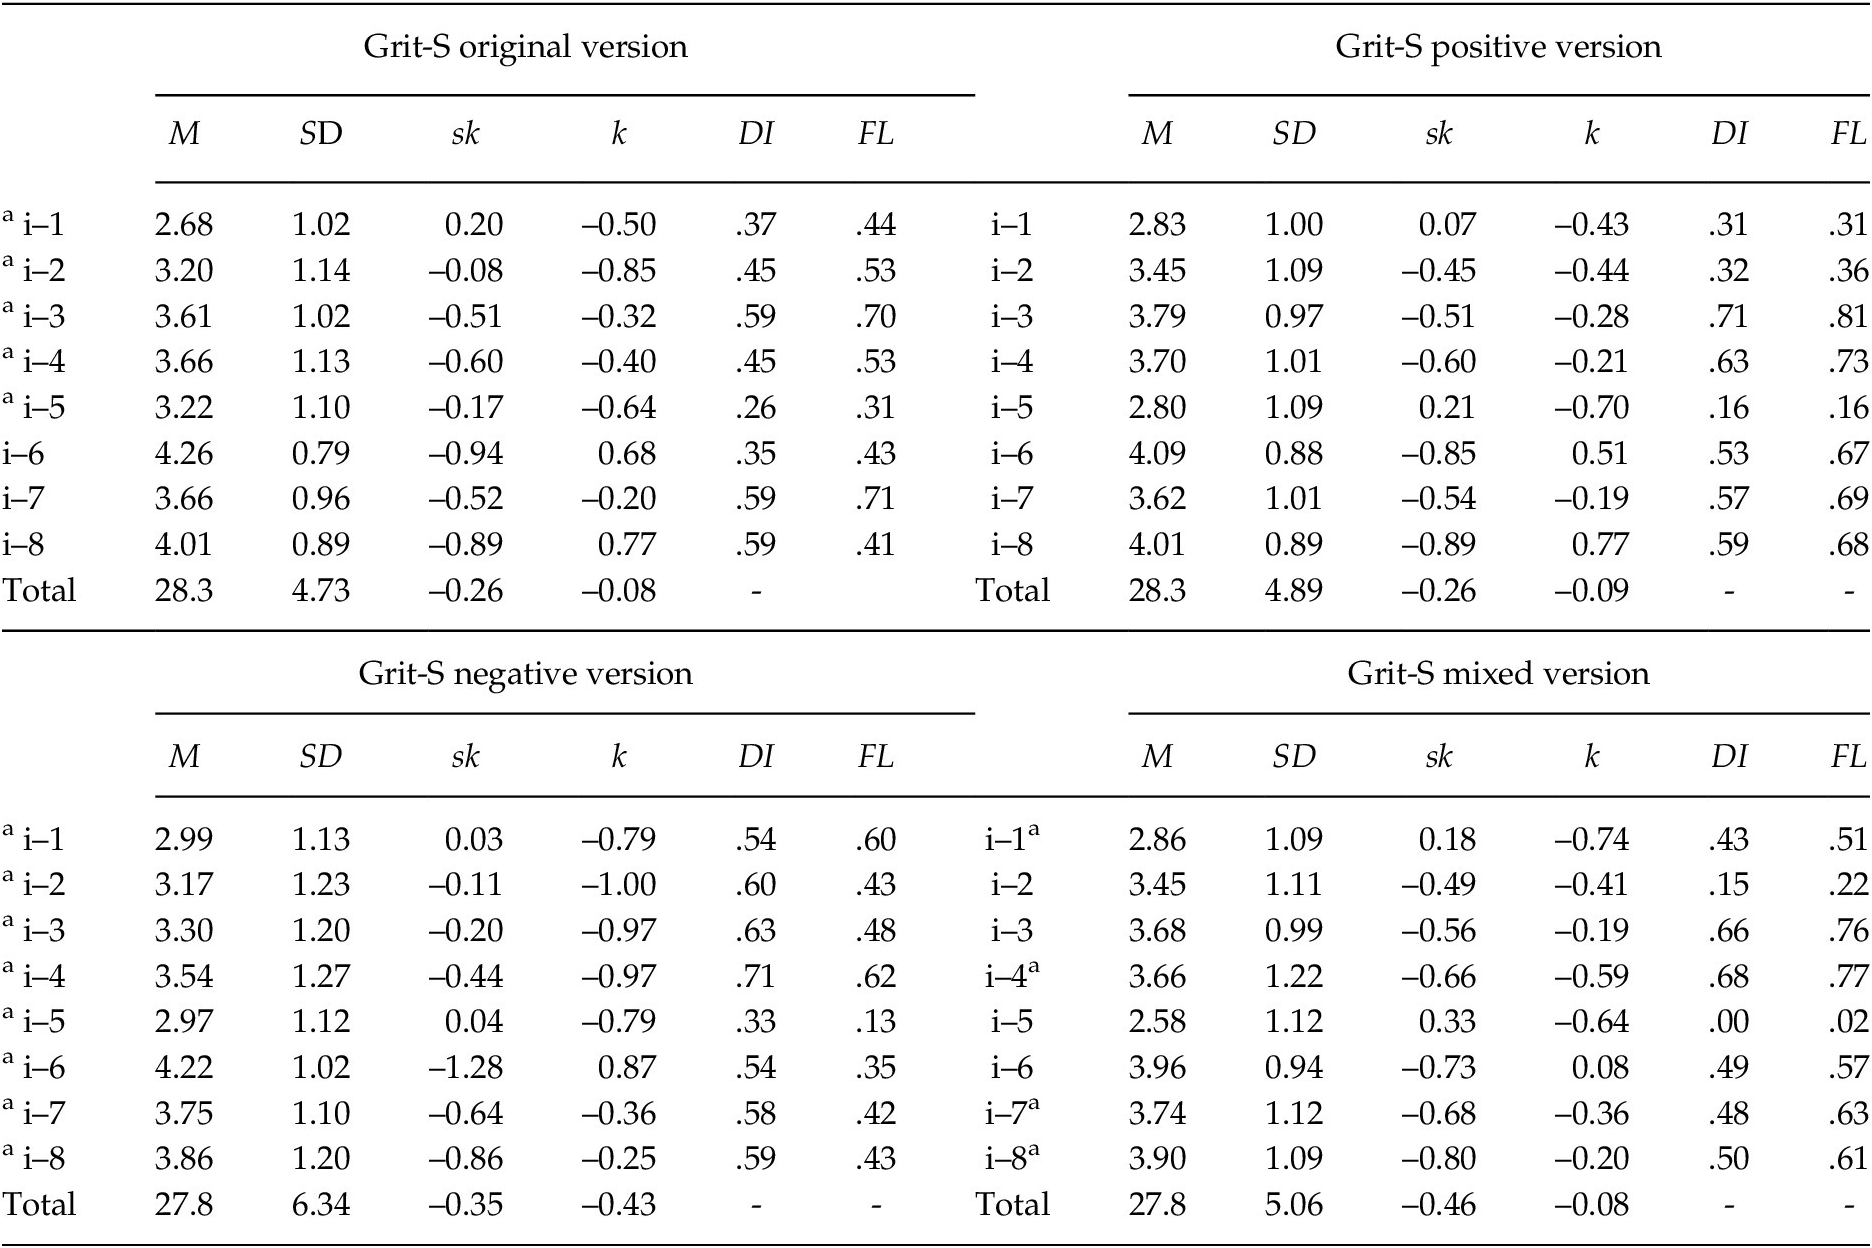
Note. M = mean; SD = standard deviation; sk = skewness; k= kurtosis; DI = Discrimination Index; FL = Factorial Loading; a = negative items.
Discrimination indexes were generally lower in the mixed versions and higher in the negative versions than the positive versions. Item 5 of the Grit-S scale demonstrated no discriminatory power (.00)
The ANOVA for the four versions of the Grit-S scale showed no significant differences between the total scores for the original, mixed, positive, and negative versions (F = 0.972; df = 3; p = .405).
Reliability
The reliability for each version of the scale is shown in Table 2. The original and mixed versions demonstrated the worst reliability. Reliability comparisons are shown in Table 5. The negative version of the Grit-S negative version had significantly better reliability than the other versions, and the positive version had better reliability than the original or mixed versions.
Table 5. Reliability Comparison of Grit Scale Versions
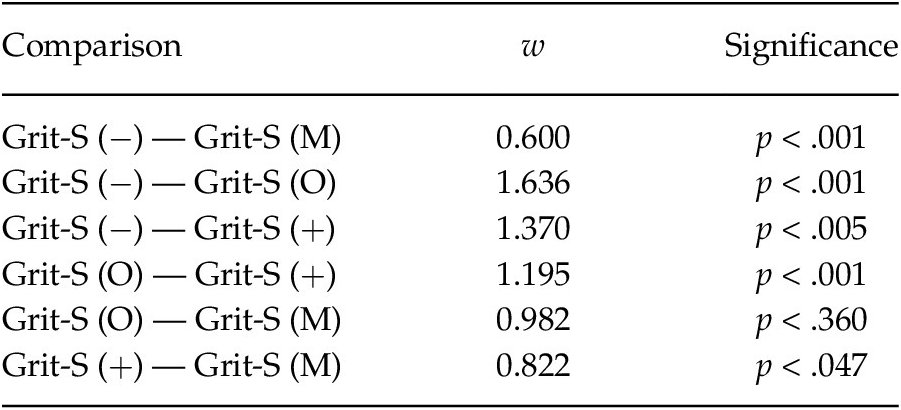
Note. (−) = negative; (+) = positive; (M) = mixed; (O) = original
Correlations with Other Variables
The Pearson correlations between Neuroticism and the grit scales were –.26 for the positive version, –.38 for the mixed version and –.53 for the negative version.
Discussion
Reversed items have been questioned by previous research for various reasons (Carlson et al., Reference Carlson, Wilcox, Chou, Chang, Yang, Blanchard, Marterella, Kuo and Clark2011; Chiavaroli, Reference Chiavaroli2017; Essau et al., Reference Essau, Olaya, Anastassiou-Hadjicharalambous, Pauli, Gilvarry, Bray, O’Callaghan and Ollendick2012; Navarro-González et al., Reference Navarro-González, Lorenzo-Seva and Vigil-Colet2016). The present study examined the effect of item reversion on a grit scale, as well as any potential consequences of that when relating the scale to other variables.
Looking at the dimensionality of the versions of the scale, EFA points to a unidimensional structure, similar to previous results (Areepattamannil & Khine, Reference Areepattamannil and Khine2018; Gonzalez et al., Reference Gonzalez, Canning, Smyth and MacKinnon2020; Postigo et al., Reference Postigo, Cuesta, García-Cueto, Menéndez-Aller, González-Nuevo and Muñiz2021), meaning that the hypothesis of a two-factor structure for mixed versions is refuted. However, the best fit indexes were found for the negative and positive versions, while the mixed versions (both mixed and original Grit-S scales) exhibited the worst unidimensional fit. In other words, the use of both positive and negative items promotes the multidimensionality of the scale (Essau et al., Reference Essau, Olaya, Anastassiou-Hadjicharalambous, Pauli, Gilvarry, Bray, O’Callaghan and Ollendick2012; Horan et al., Reference Horan, DiStefano and Motl2003; Woods, Reference Woods2006). This is not only a problem for the scale’s internal consistency, but can have serious consequences for the theoretical framework that researchers are developing, for example, conceptualizing more factors than necessary because of the method factor that negative items may produce. Continuing with factorial structure, the items’ factor loadings did not exhibit statistically significant differences between versions. This indicates that the factorial structure did not differ due to the use of reversed items, although this structure is less clear when using mixed scales (as they had worse fit indexes).
In the Grit-S scale, the negative version demonstrated greater reliability (α = .83) than the positive version (α = .77). This can be explained as due to the higher correlations between the negative items than between the positive items (Solís Salazar, Reference Solís Salazar2015). The positive version exhibited a higher reliability coefficient than the mixed and original versions. Finally, there were no statistically significant differences in reliability between the mixed and original versions, which was expected as both of these scales mix positive and negative items. This confirms previous findings about the reduced reliability coefficients when using mixed scales (Carlson et al., Reference Carlson, Wilcox, Chou, Chang, Yang, Blanchard, Marterella, Kuo and Clark2011).
There were no statistically significant differences between the versions with regard to the total scores. This refutes our second hypothesis, as our data did not replicate the results of previous findings (Suárez-Álvarez et al., Reference Suárez-Álvarez, Pedrosa, Lozano, García-Cueto, Cuesta and Muñiz2018; Vigil-Colet, Reference Vigil-Colet, Navarro-González and Morales-Vives2020). This could be seen as the grit scale being a “special case” due to its items (people tend to agree or disagree in the same way with negative and positive items when asked about their grit levels) or the length of the questionnaire, as previous research has shown these differences with questionnaires that are at least twice as long as the Grit-S scale. One might think that the scales could be used interchangeably, given that there were no mean differences between versions. We advise against this interpretation, as having the same mean does not imply that an individual would have the same score in both versions. As we mentioned previously, the quality of factorial scores worsens with mixed versions, as do the reliability coefficients, and these differences are statistically significant.
Another example of what might be masked by similar total mean scores is the change in the correlation coefficients with Neuroticism. By redirecting just half of the items, the correlation goes from –.26 to –.38 (a difference of 7.6 in the percentage of explained variance). If all items are redirected, that produces a correlation of –.53 (the percentage of explained variance grows by 21 points). This proves that redirecting items can have a powerful effect on the relationship with other variables. We believe that the reason for this difference is the increase in the variance of the total scores produced by negative items, which affects the correlation coefficient (Amón Hortelano, Reference Amón Hortelano1990). This may vary depending on the psychological construct being assessed (positive items may exhibit more variance than negative items for a different variable).
The results of this study should be assessed in light of some limitations. First, using a cross-sectional design, with different samples responding to each scale, could have biased the results, although the groups did have similar sociodemographic characteristics. In this regard, future studies should apply longitudinal designs. Secondly, the possibility of developing a “perfect-inverted item” is unclear, given semantic, grammatical and/or expressive issues. Some reversed expressions may sound ‘weird’ to a native speaker, leading to grammatical changes that make the sentence clearer but further from being a precise reversed version of the original item. This is not only a limitation for the present study, but also another argument against the use of reversed items in scale development.
Applied researchers should avoid developing mixed scales. Note that the problems with negative items come when they are included in a scale along with positive items (i.e., mixed scales). Having an entirely negative scale—with properly constructed items—cannot be considered bad practice, as this study shows. Thus, researchers should select which form (positive or negative) they prefer considering the theoretical framework of the construct. It is also important to note that having the same mean total scores does not mean that the compared scales are equivalent, as the factorial structure, reliability, and the relationship with other variables may differ significantly.
Appendix
Table A1. Positive and Negative Items for Grit-s Scales

Note. a = original Grits-S item.
Table A2. Item Direction (Positive or Negative in Each Scale Versions)

Note. (O) = original version; (M) = mixed version; (+) = positive version; (–) = negative version.


 Open access