


1. Introduction
Despite the global trend of crop intensification and upscaling of crop monocultures, traditional multiple cropping (MC) systems are still in vogue in traditional farms in the global South, primarily maintained by small and medium farmers (IAASTD, 2009; La Via Campesina, 2010; Panneerselvam et al., Reference Panneerselvam, Hermansen and Halberg2011; Singh et al., Reference Singh, Kumar and Woodhead2002). Traditional MC systems are common in countries with high extent of subsistence agriculture and low degree of agricultural mechanization (Brooker et al., Reference Brooker, Bennett, Cong, Daniell, George, Hallett, Hawes, Iannetta, Jones, Karley, Li, McKenzie, Pakeman, Paterson, Schöb, Shen, Squire, Watson, Zhang and Zhang White2015; Ngwira et al., Reference Ngwira, Aune and Mkwinda2012). The species heterogeneity and the complexity of community interactions in MC systems can provide pest control benefits, weed control advantages, reduced wind erosion, improved water infiltration, and enhance crop productivity (Francis & Porter, Reference Francis, Porter, Thomas, Murray and Murphy2017; Gliessman, Reference Gliessman2015; Malézieux et al., Reference Malézieux, Crozat, Dupraz, Laurans, Makowski, Ozier-Lafontaine, Rapidel, de Tourdonnet and Valantin-Morison2009).
A general agroecological understanding of superior yield potential of MC systems notwithstanding (Gliessman, Reference Gliessman2015; Huang et al., Reference Huang, Liu, Heerink, Stomph, Li, Liu, Zhang, Wang, Li, Zhang, van der Werf and Zhang2015; Liu et al., Reference Liu, Liua, Rahmana, Song, Yang, Sua, Cuia, Bua and Yang2018; Raza et al., Reference Raza, Khalid, Zhang, Feng, Khan, Hassan, Ahmed, Ansar, Chen, Fan, Yang and Yang2019), there exist very few published studies to examine crop productivity in MC systems compared to monocultures of the same crops in the tropics (e.g. Runkulatile et al., Reference Runkulatile, Homma, Horie, Kurusu and Inamura1998; Morales-Rosales & Franco-Mora, Reference Morales-Rosales and Franco-Mora2009; Hamzei & Seyedi, Reference Hamzei and Seyedi2015), and none of the published studies have examined MC systems involving more than 2 crops. The present study is an attempt to fill this lacuna.
2. Objective
To examine the agronomic performance of traditional MC farms growing 7 crops, compared to monocultures of the same crop species, planted in the same edapho-climatic condition within the same geographic location.
3. Study sites and methods
Four farms in the village of Beradangpadar (19° 28′ 28.16′‘N, 83° 34’ 43.54″ E) and four in the village of Leningpadar (19° 30′ 40.78′‘N, 83° 34’ 41.23″ E) in the District of Rayagada of Odisha, India were selected for study in 2019 during the kharif season (June–December). All these 8 farms are owned by indigenous farmers, who traditionally grow 6–8 crop species on their farms every season.
3.1. Monocrop or sole-crop (SC) plot design:
From the local farmers’ crop repertoire, we chose 7 species representing fruit crops, leafy vegetables and cereals in this study. Two fruit crops (okra Abelmoschus esculentum and brinjal Solanum nigricum), 3 cereal crops (rice Oryza sativa ssp. indica, little millet Panicum sumatrense and finger millet Eleusine coracana), and two leaf crops (red amaranth Amaranthus cruentus and green amaranth Amaranthus viridis) were planted in separate SC plots. The same cropping design was replicated in all the 8 farms. The SC plots were of the same size, with 240 cm (7 rows) x 520 cm (14 columns) for brinjal, and 150 cm x 325 cm for all other crops. .
3.2. Multiple cropping (MC) plot designs:
All the 7 crop species were planted in the multiple cropping (MC) farms. In each farm, three test plots (designated A, B, and C) were demarcated, composed of 21 x 21 cells, measuring ca. 28 m2, to accommodate 3 sets of rows and columns, as shown in Fig. 1.
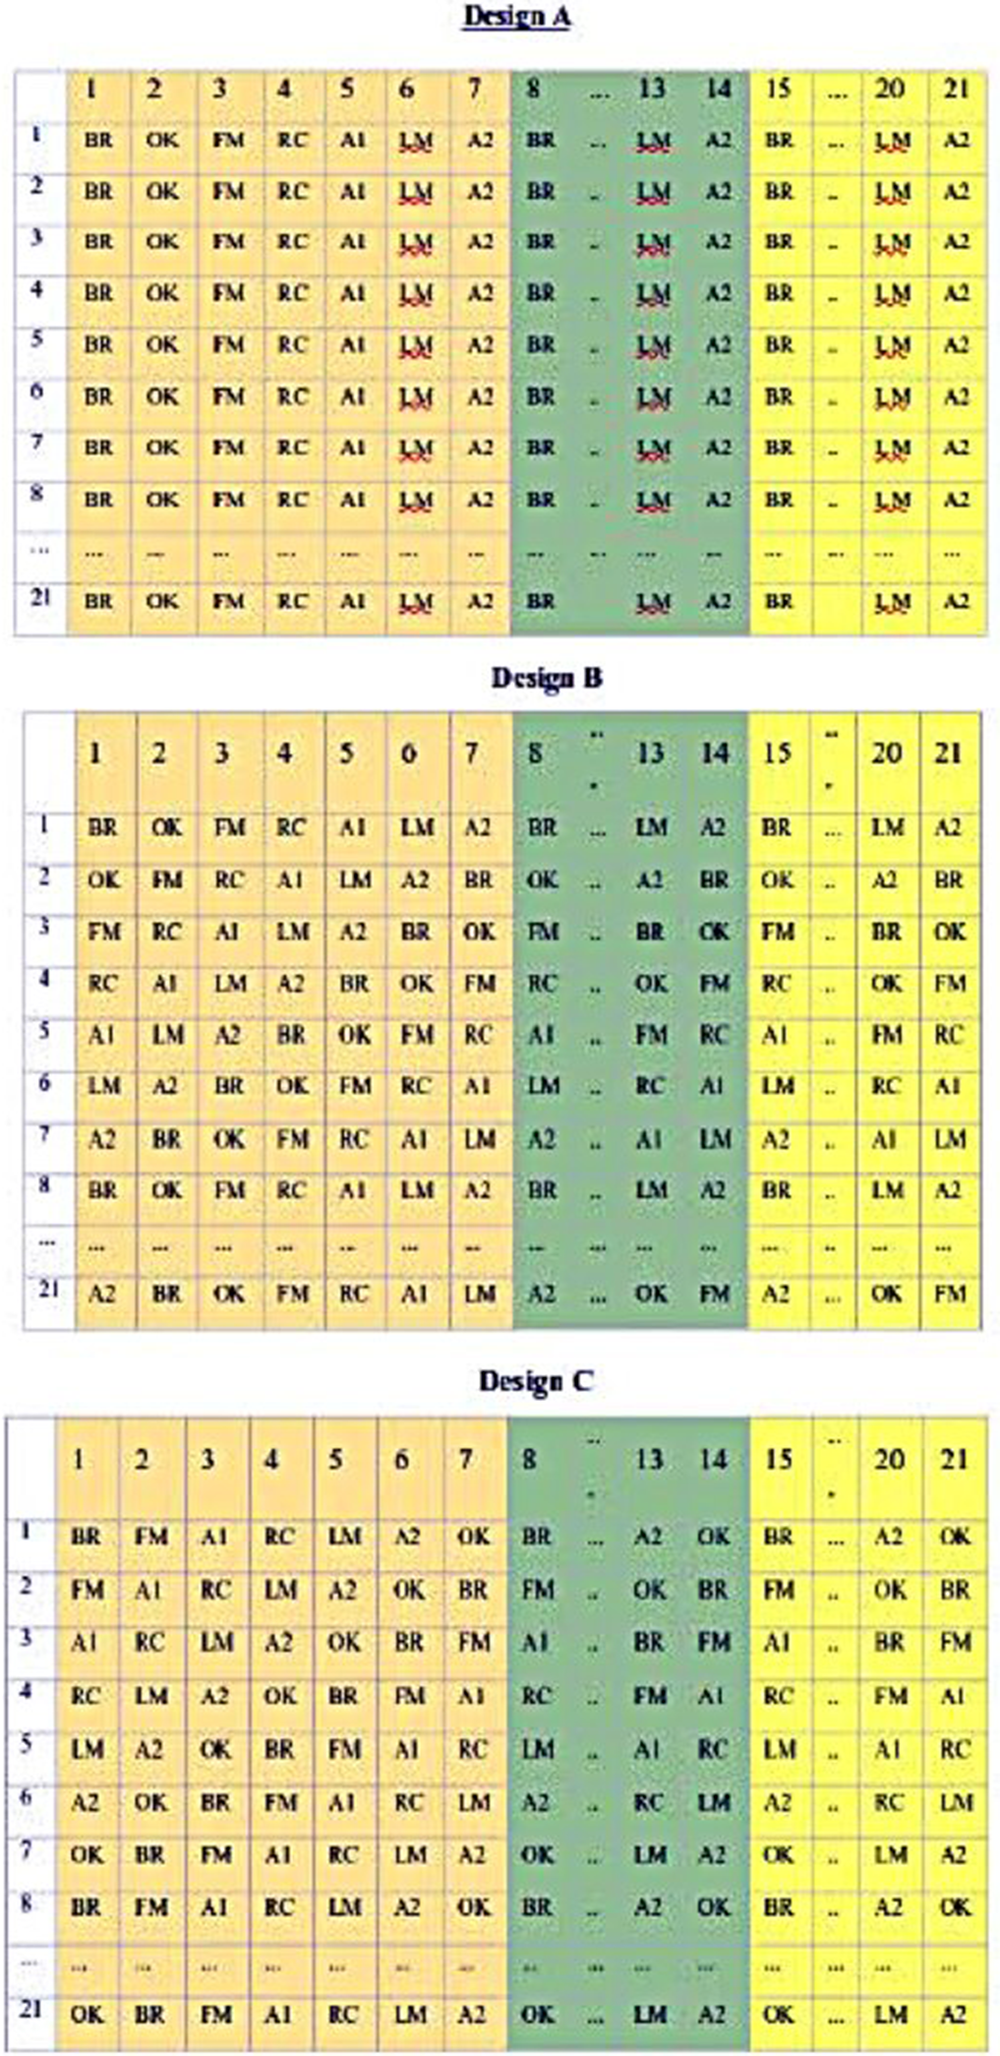
Fig. 1. The Planting Designs A (row cropping), B and C (mixed cropping) for 7 Crop Species.
Design A, consisting of row intercropping, was planted to all 7 species identically arranged in 7 successive rows, repeated 3 times over, row-wise and column-wise.
Design B was non-random mixed cropping, where 7 crop species were planted in a fixed order, with each cell diagonally matching the species in the previous row and column. Thus, each row and each column differed in crop combination, although the order remained the same, repeated 3 times over.
Design C was a different design of non-random mixed cropping. The order of crops was different from that of design B, yet each cell repeated the crops diagonally matching the previous row and column.
On all plots, crop plants were planted, following customary practice, at a uniform spacing of 40 cm x 40 cm, with a planting density of 6.25 m−2 for brinjal (Solanum nigricum) saplings, and at 25 cm x 25 cm (or 16 m−2 density) for all other crops.
3.3. Quantification of crop production:
The edible parts of each crop were harvested after maturity, and the fresh weight of the edible biomass harvested from each row and column was separately measured using a spring balance. Crop productivity per plant was measured as:
 $$ {\mathrm{Y}}_{ij}={\mathrm{P}}_{ij}/{\mathrm{N}}_i $$
where Ni is the number of crop i = 1,2,3, … 7 and Pij is the total edible biomass output of crop i from the plot j.
3.4. Statistical analyses:
Yield efficiency was measured by land equivalent ratio (LER), following Gliessman (Reference Gliessman2015):
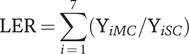 $$ \mathrm{LER}=\sum \limits_{i\hskip.2em =\hskip.2em 1}^7\left({\mathrm{Y}}_{iMC}/{\mathrm{Y}}_{iSC}\right) $$
where YiMC is the per-plant yield (in kg) of the i th crop in the multiple cropping (MC) system, and YiSC is the yield of the same crop in monoculture or sole crop (SC) plots. The total number of crops grown in the poly-crop farm plots, Σi = 7. The confidence interval of the LER estimates was measured at p = 95%.
4. Results and discussion
Plot-wise crop yield data from SC farms are presented in Table S-1. Yield data from MC farms of Design A, B, and C are given in Table S-2, S-3, and S-4, respectively. Among the row cropped MC plots (Design A), brinjal fruit biomass in plots A2 and A8 was entirely lost due to severe pest attack. However, all other plots yielded considerable edible biomass, though the quantity was variable. A summary of the mean crop yields from the SC and MC farms is given in Figure 2. Crop yield was variable in the 8 replicates of monoculture farms, owing to different environmental factors. It appears that the productivity per plant is considerably improved in design B and Design C, compared to the row cropping system in design A.
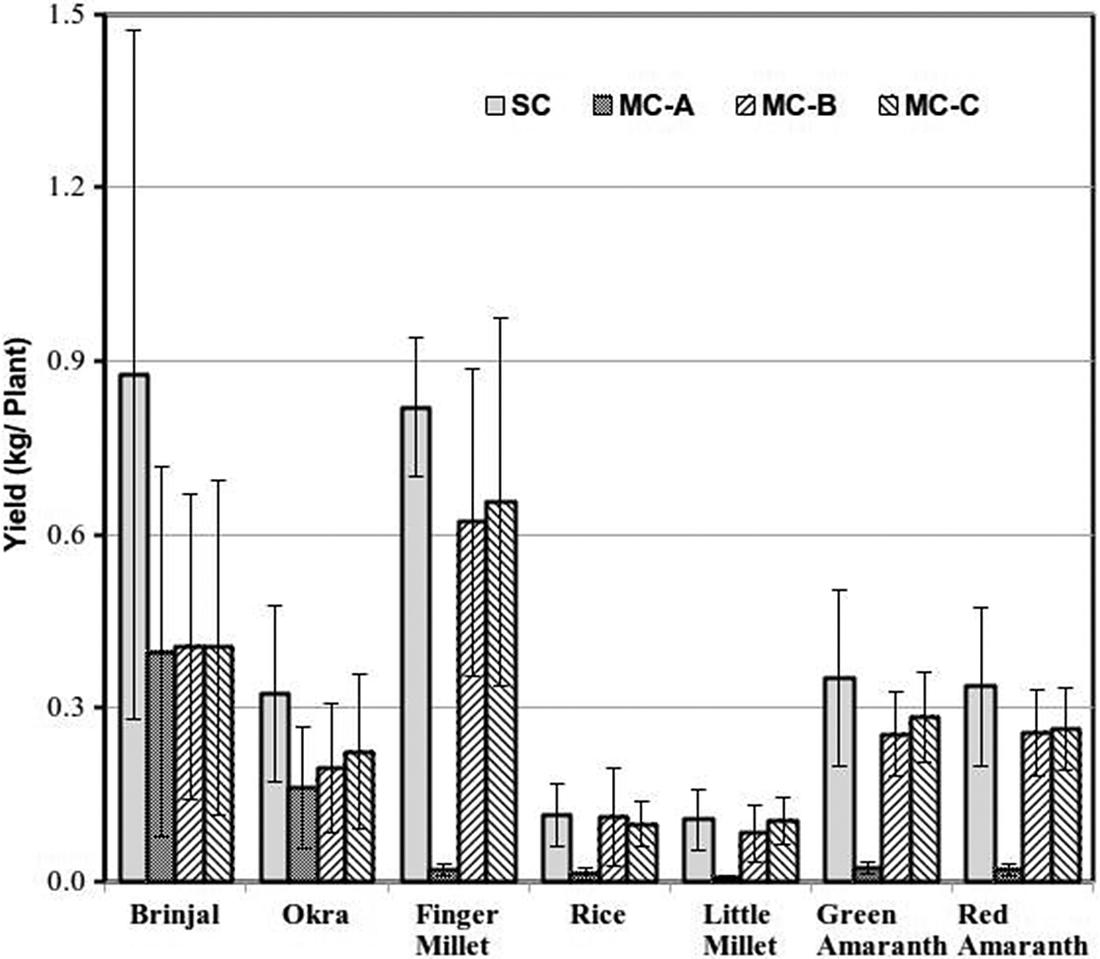
Fig. 2. Mean Yield of Crops in SC plots compared to MC plots, planted in designs A, B and C. Vertical bars show standard deviations of the mean.
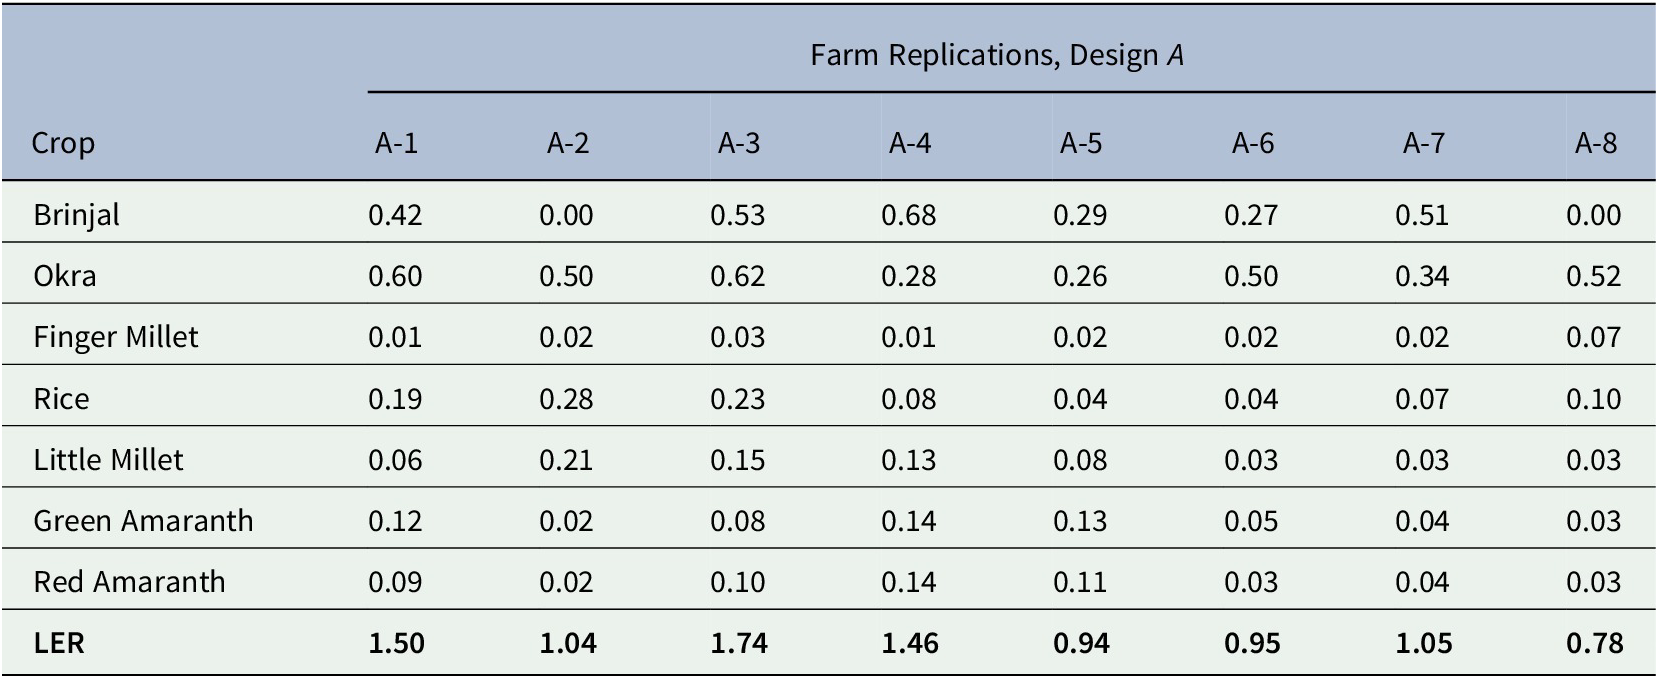
Data presented in Tables S1 to S4 and Figure 2 show that crop output per plant of each of the 7 crops in the MC farms is distinctly less than that cultivated in the SC farms. However, the LER analyses of the replicated MC farms draw a different picture. When different species are planted in alternate rows (design A), the combined yield of the 7 crops is marginally less in MC farms A-5, A-6 and A-8, while the LER exceeds 1 for all other replications of design A, implying no significant difference in yield efficiency from monocultures of the same crops (Table 1). The mean LER for all MC farms in design A is 1.18, with a 95% confidence interval (0.9, 1.46). Considering the severe crop damage in two replications of the row cropped farms (Design A), we eliminated the brinjal crop and recalculated the LER for these plots, which showed no appreciable difference between the two means (t = 0.42, p > 0.1). This indicates that whether 6 or 7 crops are grown in row cropping, the overall crop productivity scarcely exceeds that of monocultures, and therefore, LER is not appreciably greater than 1.
Table 1. LER Values of Multiple Crops Planted in Design A (Row Cropping). (Values corresponding to each crop is its Partial LER in each replicate)
The species count in each column (alpha diversity) of all the replicate plots in design A (Table S-1) is no more than 1, although the overall species count of all the farms (beta diversity) is 7. Thus, the alpha diversity in the rows of MC farm of design A is identical to monoculture farms. In contrast, the alpha and the beta diversity in Designs B and C is 7, and therefore these MC systems are likely to significantly enhance the synergistic effect on crop productivity.
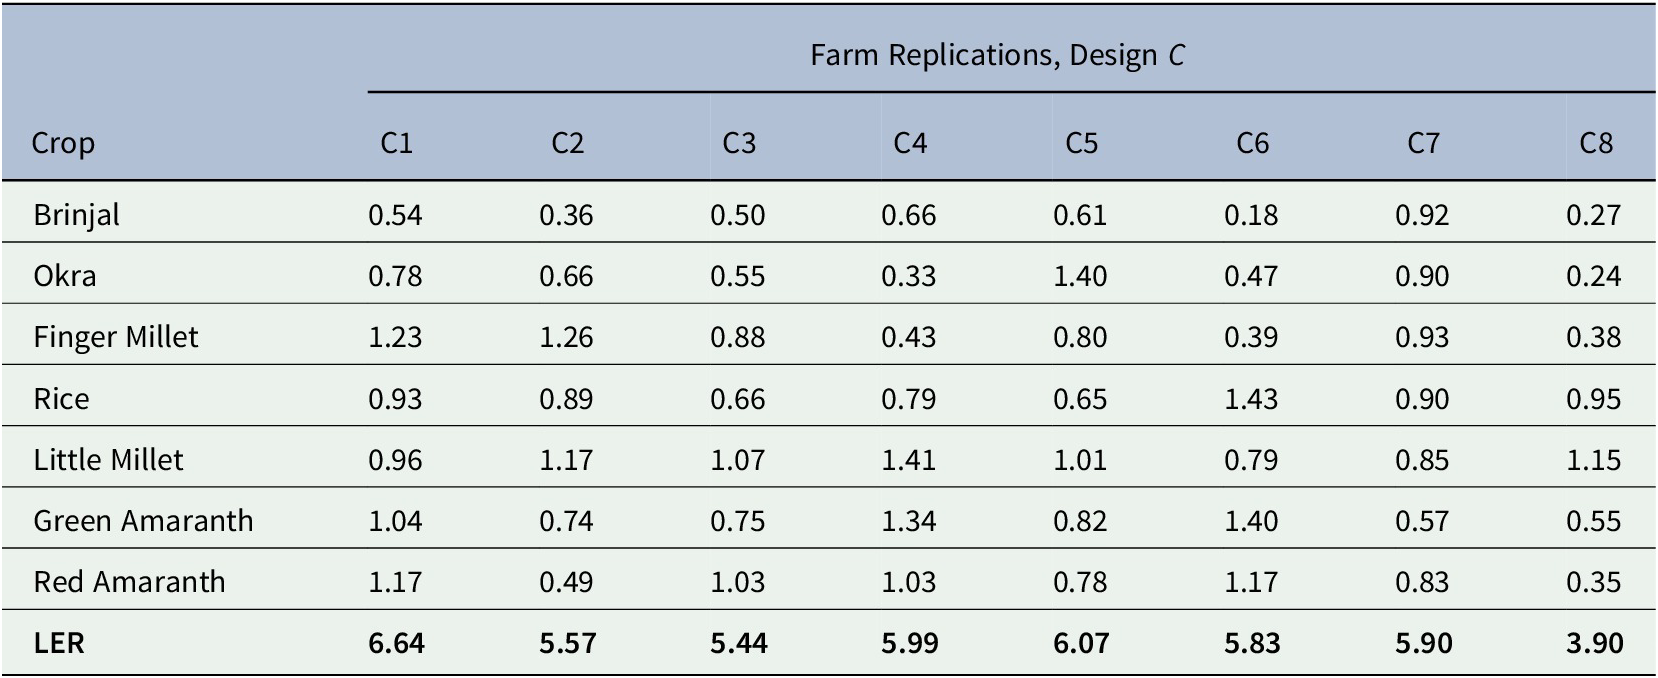
The LER for the 8 MC farms planted in design B ranges from 4.07 to 6.16 (Table 2), with a mean of 5.15, with a 95% confidence interval of (4.6, 5.7). Similarly, the LER for the 8 MC farms in design C ranges from 3.9 to 6.64, as shown in Table 3. The mean LER for this design is 5.67, with a 95% confidence interval of (5.0, 6.3). The agroecological implication is that in mixed cropping systems, the crop species would require >5 times land area in monocultures to equal the mean productivity of the same crops in the MC farms, planted in either Design B or C.
Table 2. LER Values of Mixed Crop Farns Planted in Design B. (Values corresponding to each crop is its Partial LER in each replicate)
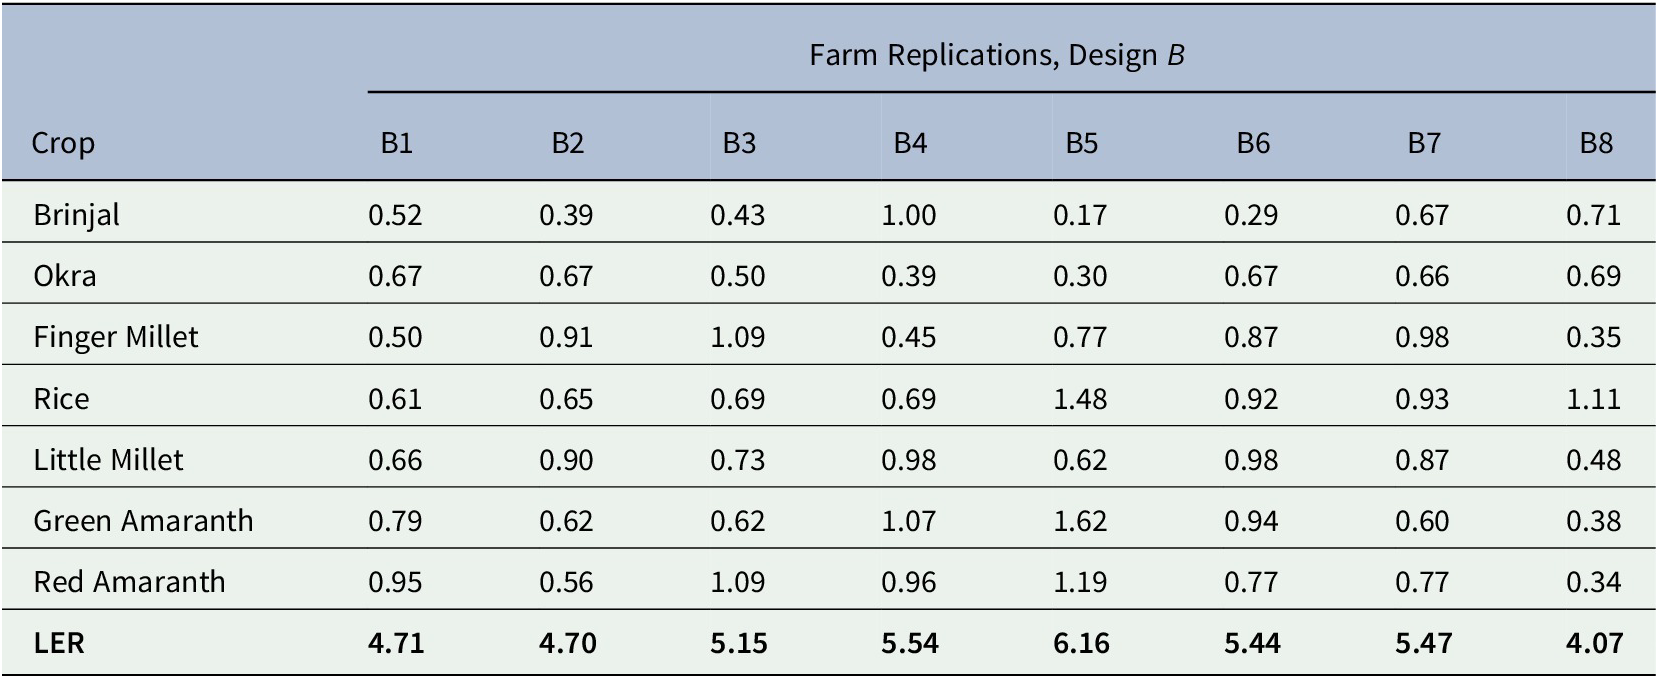
Table 3. LER Values of Mixed Crop Farms Planted in Design C. (Values corresponding to each crop is its Partial LER in each replicate)
5. Conclusion and recommendation
The results of this study is in conformity with previous, albeit limited, number of experimental productivity studies with multiple cropping systems (e.g. Picasso et al., Reference Picasso, Brummer, Liebman, Dixon and Wilsey2008). The salient findings of this study may be described as follows.
Measured by LER, MC farms are more productive than SC farms. However, not all MC farms are equally productive; rather, their relative productive efficiency depends on the specific crop combination and planting design. Row intercropping is scarcely more productive than monocultures.
In contrast, either a semi-randomly or uniformly heterogenous plantation of multiple crops in each row and column is obviously more diverse in composition, and hence the impact of diversity on productivity is likely to be more pronounced. This is exactly evidenced in our results of MC farms of Design B and C, in which the overall per plant productivity of the crops is more than five times higher than that of SC farms. Figure 3 prominently shows the difference between the mean LER of farms of design A and that of mixed cropping Design B and Design C. Drawing on these findings, agroecology practitioners, researchers and policy makers may confidently promote mixed cropping and discontinue monoculture, to enhance agrobiodiversity and food security.

Fig. 3. Mean LER Values for MC farms, planted in designs A, B and C. Horizontal bars show standard deviations of the mean.
Acknowledgements
All field data were meticulously collected by Ms Mahasweta Sahoo, Sri Pradeep Patra and Sri Sachin Panigrahi. I am grateful to Mr Debjeet Sarangi of Living Farms, Bhubaneswar for providing all logistic support to this study.
Conflict of Interest
The author declares none.
Data Availability Statement
The data that support the findings of this study are openly available upon request.
Supplementary Materials
To view supplementary material for this article, please visit http://dx.doi.org/10.1017/exp.2021.7.


 Open access
Comments
Comments to the Author: It is an excellent and timely article. Carry out the minor corrections suggested