


1. Introduction
For commercial producers whose primary occupation is farming, maximizing profit for their farm business in a time of fierce competition is incredibly difficult (McBride and Johnson, Reference McBride and Johnson2006; Nivens, Kastens, and Dhuyvetter, Reference Nivens, Kastens and Dhuyvetter2002). Because of this, the relative importance of the farmer’s decisions on the success of the business has increased dramatically. Farmers have to choose and prioritize management factors that directly affect their farm’s performance (Kastens, Dhuyvetter, and Nivens, Reference Kastens, Dhuyvetter and Nivens2002). Which factors do farmers give priority to in order to increase the success of their farm business? Is it managing people, managing production, managing cost, managing output prices, or managing assets (land, equipment, and facilities)? Are farmers homogeneous in their business strategies, or are there heterogeneous patterns of producers pursuing different strategies for success? Are the management success strategies of livestock and crop producers similar or different? Understanding the heterogeneity of farmer priorities for management factors will allow those who serve farmers to consider tailoring offerings according to the farmer’s preferred strategy.
The importance of key management factors in the success of farm businesses has previously received research attention (Holland et al., Reference Holland, Widmar, Widmar, Ortega and Gunderson2014; Lai et al., Reference Lai, Widmar, Gunderson, Widmar and Ortega2018), but these studies did not consider the similarities and differences between management strategies based on farmers’ primary production activity. Holland et al. (Reference Holland, Widmar, Widmar, Ortega and Gunderson2014) used choice-based data from the 2013 edition of the Large Commercial Producer Survey to identify the most important predetermined management factors as controlling costs and managing production. They also used a mixed logit model to identify that managing production, and controlling costs are strongly negatively correlated. However, they did not expound the potential differences and similarities between farmers in terms of their success strategies. Lai et al. (Reference Lai, Widmar, Gunderson, Widmar and Ortega2018) used the same data as Holland et al. (Reference Holland, Widmar, Widmar, Ortega and Gunderson2014) but employed a latent class model approach to find that farmers can be categorized based on their management strategies. They grouped farmers into production purists, cost control through people, production management through people, and commodity marketing-focused farmers. They noted that each of these groups perceive farm management priorities differently. Our analysis extends the work of Lai et al. (Reference Lai, Widmar, Gunderson, Widmar and Ortega2018) in two important ways. First, our survey of producers asks them to rank the five basic management factors. The forced ranking provides a succinct way to gather producer opinions on the importance of these factors. However, it also makes it more difficult to find groups of producers with similar strategies. In this paper, we compute a weighted rank coefficient for each producer. This allows us to then use hierarchical clustering techniques to identify unique groups of farmer strategies that can be compared to the findings from the previous studies. Second, we explore the differences in management strategy clusters for crop farmers compared to livestock farmers to explore differences in the heterogeneity of management strategies across the two primary farm enterprise types.
This study uses data from the 2017 edition of the Purdue University Center for Food and Agricultural Business Large Commercial Producer Survey and a clustering analysis method. Our aim for conducting the cluster analysis is to understand the heterogeneity of managerial priorities of each farmer group based on their primary production activity. This is especially important because farm businesses differ in scale and type, and thus the managerial approaches of respective farmers might also differ. We found five groups of farmers: two farmer groups that consider managing cost as the most important activity, two groups that prioritize people management, and one group that prioritizes managing production. Furthermore, we found five clusters of farmers based on farm type—livestock or crop production. Each of these groups prioritizes either managing costs, managing output prices, managing people, managing production, or managing assets. However, the groups are heterogeneous regarding the relative importance of these management factors. Our findings provide evidence of the similarities and differences between farmers’ management success strategies, which could be insightful for inputs and service providers, policy makers, and academics who provide managerial educational programs to farmers.
2. Data
The Center for Food and Agricultural Business at Purdue University conducts the Large Commercial Producers Survey every 5 years to elicit farmers’ success strategies, buying behavior, risk perceptions, marketing segments, demographics, and other pertinent information. The data used in this study are from the 2017 edition of the survey. Numerous publications use data from previous editions of the survey (Gloy and Akridge, Reference Gloy and Akridge1999, Reference Gloy and Akridge2000; Gloy, Akridge, and Whipker, Reference Gloy, Akridge and Whipker2000; Ringelberg, Gunderson, and Widmar, Reference Ringelberg, Gunderson and Widmar2016). For example, Hooper (Reference Hooper1994) used data from the 1993 survey edition to segment the market for agricultural inputs using a nested approach. Gloy and Akridge (Reference Gloy and Akridge1999) used a similar approach with the 1998 version of the survey to find four distinct segments of commercial producers: convenience buyers, balance buyers, price buyers, and performance buyers. Using data from both the 1998 and 2003 versions of the survey, Alexander, Wilson, and Foley (Reference Alexander, Wilson and Foley2005) investigated if there are differences in producer market segments over time. This investigation was made possible because 76% of the questions in the 1998 survey were repeated in 2003. Alexander, Wilson, and Foley (Reference Alexander, Wilson and Foley2005) found an increase in the service, price, and performance market segments and a decrease in the convenience market segment. Borchers et al. (Reference Borchers, Roucan-Kane, Alexander, Boehlje, Downey and Gray2012) used the 2008 version of the survey to explore how large commercial producers choose their input suppliers, segmenting the market in line with previous studies. The differences in market segments found by these studies over the years have important marketing implications for input suppliers and farmers. This study builds on this precedent, specifically on the works of Lai et al. (Reference Lai, Widmar, Gunderson, Widmar and Ortega2018) and Holland et al. (Reference Holland, Widmar, Widmar, Ortega and Gunderson2014), who used data from the 2013 version of the survey to examine farmers’ success strategies.
In April 2017, the survey was mailed to farmers—15,300 were sent via U.S. mail. A marketing services provider, Infogroup, was recruited to contact farmers who did not complete the survey after multiple reminders. The response rate is as follows: 1,640 surveys were completed for a response rate of approximately 10.7% from the initial mailing. From the 1,640 surveys that were completed and returned, we used the listwise elimination method to exclude surveys that either did not complete the ranking or ranked the responses illogically. This reduced the final survey amount used in this study to 991, which comprises farmers who ranked their strategies and responded to several other questions, including their farm and demographic characteristics. The response rates in previous years of the survey were 7.5% in 2013 and 29% in 2008 (Alexander et al., Reference Alexander, Boehlje, Downey, Gray, Gunderson and Roucan-Kane2009; Lai et al., Reference Lai, Widmar, Gunderson, Widmar and Ortega2018).
The main question of interest asks farmers to rank the most important management activity to the success of their farm business from one to five, one being the most important and five being the least important. Their options are managing people; managing production; managing/controlling costs; managing output prices; and managing land, equipment, and facilities. Although these options are predetermined, they are a result of an extensive review of the literature and consultation with agribusiness leaders (Lai et al., Reference Lai, Widmar, Gunderson, Widmar and Ortega2018). For example, traditionally, the successful farmer is defined as someone who is hardworking, self-reliant, and religious, and someone who strives to preserve their farm for his family and community (Walter, Reference Walter1995, Reference Walter1996, Reference Walter1997). However, with the rise in commercial agriculture and industrialization, the attributes of a successful farmer have been transformed into business-oriented, maximum production, technical efficiency, and innovation (Walter, Reference Walter1996), but individual farmers may define success differently based on their on their personal goals for their farms, family, and community. Some farmers may define success based on how society perceives the ideal farmer—maybe through measures of wealth, profit, continuity of ownership, farm management, and farm living. Indeed, Walter (Reference Walter1996) suggested that farm magazines associate farm success stories with commercial values. However, because of the array of ways to define farm success, we did not specify any definition of success in the survey. Rather, we allowed the farmers to interpret success from their own perspective. Furthermore, we did not provide the farmers with any specific definitions of the five management factors that we asked them to consider. For example, we asked them to rank managing production as a factor in their success. There is no further definition of this factor, so respondents were left to interpret this on their own. Our interpretation of this factor is that it focuses on crop yields, milk production, and/or meat production.
The survey also asked farmers to identify their primary activity, either crop or livestock production. This question allows us to examine the management strategies of crop and livestock farmers separately. Other questions that are of interest elicit farm characteristics. We are able to determine farm size—midsize, commercial, or large—and the gross revenue of the farm based on these questions. We estimated the gross revenue based on the acres, crops, and number of livestock reported by farmers using the price of these products in 2016. We then categorized each farm business following Vilsack and Reilly (Reference Vilsack and Reilly2012): US$150,000–US$999,000 (midsize), US$1,000,000–US$4,999,999 (commercial), and above US$5,000,000 (large). Only farm businesses with estimated gross sales of at least US$150,000 were included in this study to reduce the likelihood of contacting farmers whose primary source of livelihood is not farming. Other questions elicit the farmer’s demographics such as age, educational level (from less than high school to doctorate), gender (male or female), and location. Figures 1 and 2 indicate the location of the primary state where each respondent’s crop or livestock operation is located. The exact question prompts used in this study are provided in Appendix A. About 60% of the farmers who responded logically to all of the managerial strategy questions are crop producers, while 40% are livestock producers. Most (92%) of them are male, have at least a 2-year college degree (68%), and are above 40 years old (90%). The size of their farm business varied: 48% recorded US$1 million and above in sales in 2016, while 49% recorded between US$100 and US$500 thousand in sales in the same year. These variables are consistent, but as expected, slightly different from the previous editions of the Large Commercial Producer Survey. We present a comprehensive summary of these variables in Table 1 for all farmers, crop producers, and livestock producers, respectively.
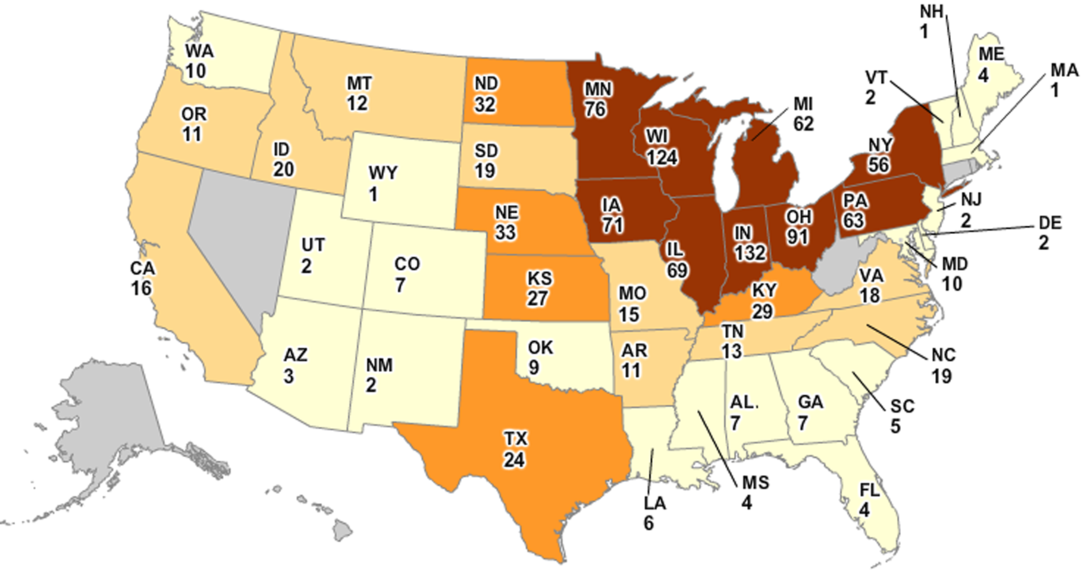
Figure 1. Geographic location of crop farmers in the survey.
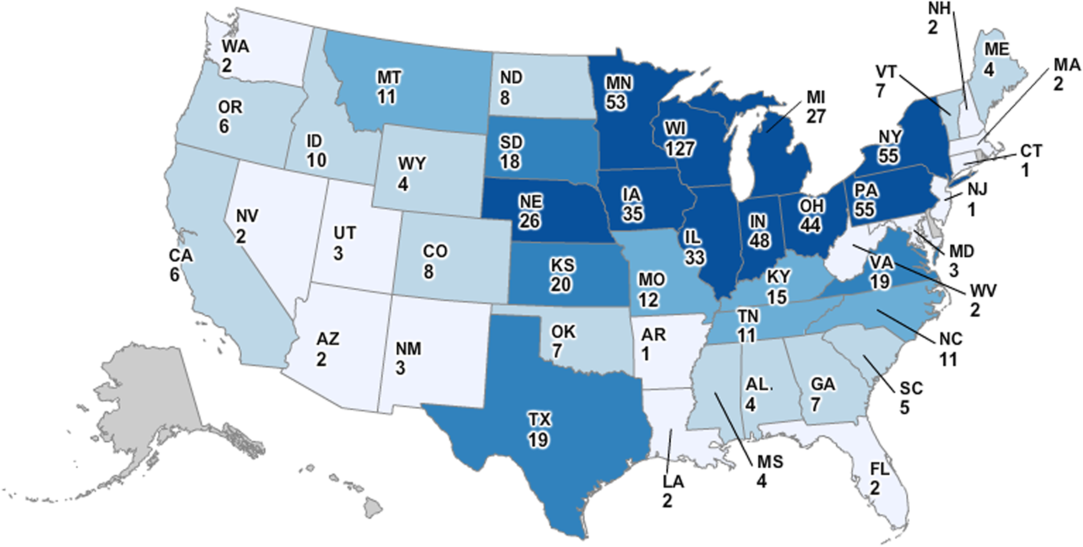
Figure 2. Geographic location of livestock farmers in the survey.
Table 1. Summary of demographic and farm characteristics of the sample

a Number of farmers in the category.
b Percentage of farmers.
3. Methods
Our focus is on the types of strategies producers use to pursue success. That is, are there groups of producers who rank the success factors question in a similar manner? The ranking question makes it difficult to identify distinct groups of producers who answer similarly because of the correlation among the ranked factors. To overcome this difficulty, we use an agglomerative hierarchical clustering method, following the approach of Brentari, Dancelli, and Manisera (Reference Brentari, Dancelli and Manisera2016). An agglomerative hierarchical clustering method builds a hierarchy of clusters from bottom-up, grouping subjects, or elements that are most similar first, and then the nearest initial clusters until the hierarchy is completed (Kaufman and Rousseeuw, Reference Kaufman and Rousseeuw2009). The ranked nature of our data suits this type of cluster analysis. We use a weighted rank correlation coefficient to emphasize the order of ranks in the clusters. Brentari, Dancelli, and Manisera (Reference Brentari, Dancelli and Manisera2016) suggest that using the weighted rank coefficient ensures that groups are based on the most important management strategies of farmers. Based on the consistency of the findings of previous studies, we use the following weighted rank coefficient developed by Salama and Quade (Tarsitano et al., Reference Tarsitano2009):
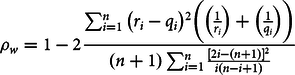 $${\rho _w} = 1 - 2{{\sum\nolimits_{i = 1}^n {{{\left( {{r_i} - {q_i}} \right)}^2}} \left( {\left( {{1 \over {{r_i}}}} \right){\rm{ + }}\left( {{1 \over {{q_i}}}} \right)} \right)} \over {\left( {n + 1} \right)\sum\nolimits_{i = 1}^n {{{{{\left[ {2i - \left( {n + 1} \right)} \right]}^2}} \over {i\left( {n - i + 1} \right)}}} }}$$
where  $i = 1, \ldots ,\;n$ is the number of success factors, and $R:{r_1},{r_2},\; \ldots ,\;{r_i},\; \ldots ,\;{r_n}$ and $Q:{q_1},\;{q_2},\; \ldots ,\;{q_i},\; \ldots ,\;{q_n}$ are the two rankings. Equation 1 only holds when there are no ties in the rankings. Recall that we removed responses whose rankings were either missing or illogical from the data for this analysis. The value of ρw varies from −1 to +1 because the denominator of equation 1 is the maximum of the numerator reached when there is zero correlation between the ranks (Brentari, Dancelli, and Manisera, Reference Brentari, Dancelli and Manisera2016). Therefore, we transform the weighted rank correlation coefficient $\left( {{\rho _w}} \right)$ into a dissimilarity measure $\left( d \right)$, which ranges from 0 to 1. There are several ways to do this transformation (Kaufman and Rousseeuw, Reference Kaufman and Rousseeuw2009), but we follow the method used by Brentari, Dancelli, and Manisera (Reference Brentari, Dancelli and Manisera2016): $d = \left( {1 - {\rho _w}} \right)/2$. This produces an m × m dissimilarity matrix that is used in the agglomerative hierarchical clustering.
The choice of a clustering method depends on several factors. We chose the hierarchical method in this study because it appears to generate clusters that are useful and meaningful in the explanation of heterogeneity in farmers’ success management strategies. It also has the advantage of being simple, requiring only the generation of the matrix described above to be implemented. Furthermore, there is no need to predetermine the number of clusters, which is required by other clustering techniques, although there may be a difficulty (which we did not have in this study) in deciding on the final clusters. There are two types of hierarchical clustering algorithms: agglomerative and divisive. We chose the agglomerative clustering (bottom-up), which starts with the individual cluster of objects and then merges the closest pair of clusters with the least inter-object dissimilarity until a single cluster is achieved. The definition of inter-cluster dissimilarity generates different methods of agglomerative hierarchical clustering such as single (nearest neighbor) linkage, average linkage, and complete (furthest neighbor) linked. As noted above, we use the complete linkage method in this study. The complete linkage method establishes groups based on the largest dissimilarity between the two individual objects to be clustered. Formally, we can represent the complete linkage function—the largest dissimilarity (D(A,B)) between two management clusters A and B—as follows (Kaufman and Rousseeuw, Reference Kaufman and Rousseeuw2009):
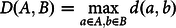 $$D\left( {A,B} \right) = \mathop {\max }\limits_{a \in A,b \in B} d\left( {a,b} \right)$$
where d(a, b) is the distance between elements a ∈ A and b ∈ B, and A and B are two sets of clusters. We used the R package to perform the complete linkage cluster analysis. However, deciding on the resulting number of clusters raises questions because there is not a systematically agreed way to make the decision (Brentari, Dancelli, and Manisera, Reference Brentari, Dancelli and Manisera2016).
4. Results and discussion
Figure 3 shows that 36% of the farmers ranked managing costs as the most important management factor, closely followed by managing production (34%), then managing people (19%), managing assets (19%), and managing output prices (9%). Conversely, the farmers consider managing people (39%) and managing output prices (29%) as the least important management factors to the success of a farm business. These results seem intuitive. For instance, given that there are many factors that influence output prices other than the farmers’ decisions such as global demand and supply of agricultural produce, international trade, weather conditions, and events in other sectors of the economy that directly affect agricultural prices, most farmers consciously considered managing output prices as the least important strategic management factor. Equally, as expected, it appears that the farmers focus on managing their costs and production to boost their profits.
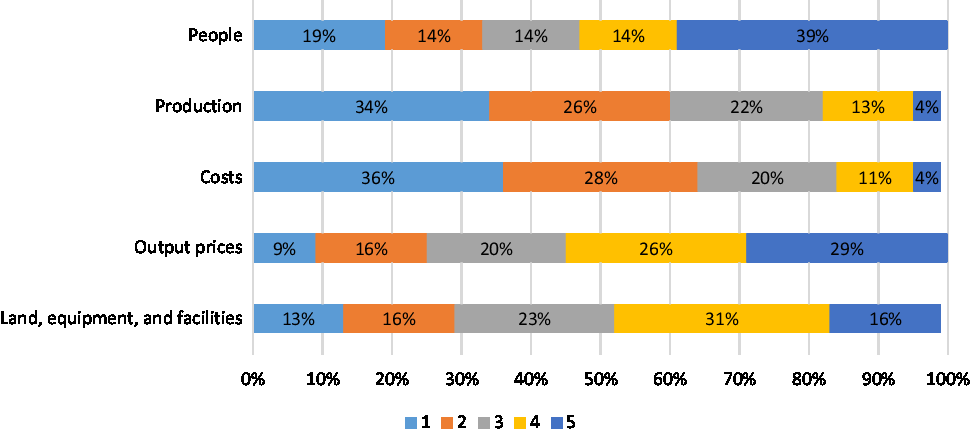
Figure 3. Importance of management factors to farmers’ success for all farmers.
We disaggregate the sample into livestock and crop producers in line with our objective of understanding the differences and similarities between the groups when compared to the entire sample. On one hand, there are 592 crop farmers in the sample. To these farmers, managing costs (37%), closely followed by managing production (32%), and then managing people (16%) are the principal management factors to their success, while managing people (45%) and managing output prices (22%) appear to be the least important management factors to them (Figure 4). On the other hand, 399 farmers in the sample primarily raise livestock. Among these farmers, 38%, 36%, and 24% rank managing production, managing costs, and managing people as the most important management factors, respectively (Figure 5). Among the same group of farmers, 40% and 32% consider managing output prices and managing people the least important management factors. However, the results of the clustering analysis presented below highlight heterogeneity among the farmers.
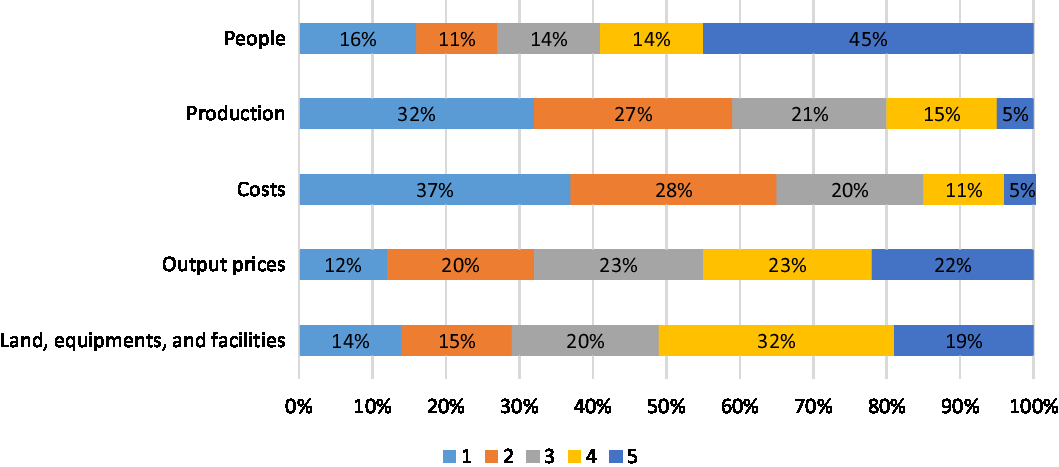
Figure 4. Importance of management factors to farmers’ success for crop armers.
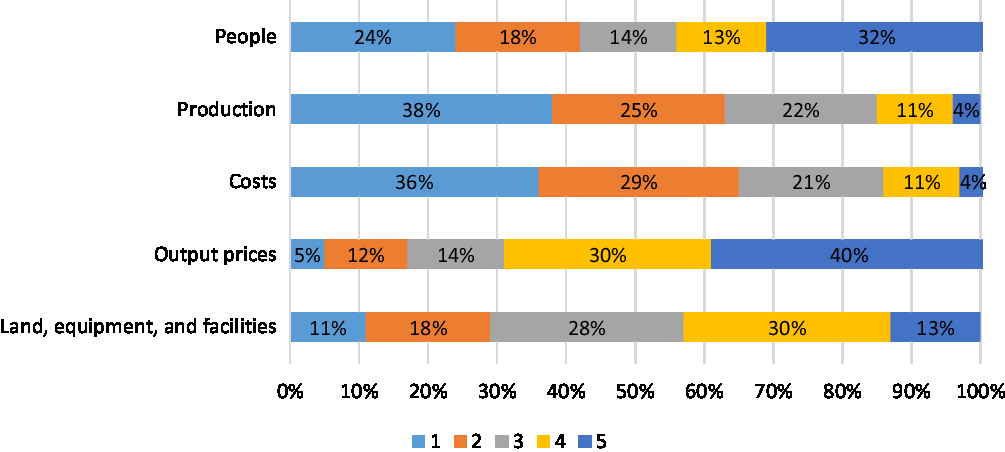
Figure 5. Importance of management factors to farmers’ success for livestock farmers.
Table 2 examines the question of which management factors farmers prioritize by presenting a relative ranking of the management factors based on their means. The results indicate that, from most to least important, the management factors important for farmers’ success are managing costs, managing production, and managing assets, whereas managing output prices and managing people interchange positions. In addition, Table 2 compares the relative rankings of the management factors for farmers’ success based on farmers’ primary activity. Among the management factors, only managing people and managing output prices have statistically different means of relative ranking for the comparisons between the entire sample and crop/livestock farmers, and between crop and livestock farmers. However, the mean relative ranking of managing people for crop farmers (3.78) is higher (meaning less important) than the mean of managing people for livestock farmers (3.31). Conversely, the mean relative ranking of managing output prices for crop farmers (3.55) is lower than the mean relative ranking of managing output prices for livestock farmers (3.97). One possible explanation for the results on managing people might be the differences in labor requirement for livestock and crop farms. Moreover, as farms become more mechanized, the size and composition of farm labor continue to change, and there appears to be marked differences in these changes across farm types. Likewise, the differences in the relative ranking of managing output prices can be attributed to how crops and livestock are marketed and sold. Although there are diverse agricultural marketing strategies, commodity crops such as wheat, corn, and soybeans and livestock such as hogs and cattle are often marketed through commodity markets. Direct marketing contracts between grocery retailers and farmers of fresh fruits and vegetable do exist, as well as local farmers markets and auction sales. Therefore, the level of control farmers have regarding output prices varies according to the product type, as well as their marketing strategies.
Table 2. Comparison of management factors by farmer demographics
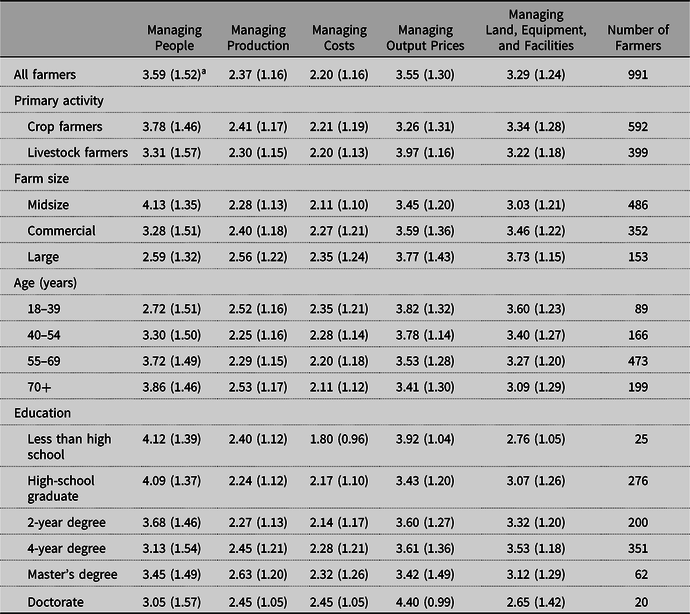
a Note that 1 represents “most important” and 5 represents “least important.” Standard deviation is in bracket.
Table 2 also reports the results of the relative ranking of management factors based on the size of their farm operation. The key question addressed is whether the management factors prioritized by midsize, commercial, and large farmers are the same or different for each of these groups. We find that midsize, commercial, and large farmers all prioritize managing costs and managing production, while large farmers also emphasize people management. However, based on an analysis of variance test, we find that there is a significant difference across the three farm size groups. Midsize farmers prioritize managing costs and managing production more than commercial farmers and then large farmers. Other management factors are also statistically different across the three farm size groups. We obtained similar results in terms of the age of the farmers and their education. All the results presented in Table 2 indicate heterogeneity in how farmers prioritize management factors based on their specific demographics.
We also examine the heterogeneity of farmer priorities of the management factors using cluster analysis. Table 3 summarizes the results. Recall that the clustering strategy adopted in this study draws from how the producers ranked the five factors. Thus, when a producer ranks a particular factor higher, another factor must rank lower. Our clustering methodology recognizes this correlation. In addition, although there are 120 possible ways to rank the five management factors, the clustering methodology allows us to identify five distinct groups of farmers who prioritize the five management strategies similarly. Therefore, the clusters presented below represent particular orderings of the five factors. That is, the rank of each factor in the cluster matters relative to the rank in the other clusters.
Table 3. Prioritization of management factors by identified clusters of farmer rankings
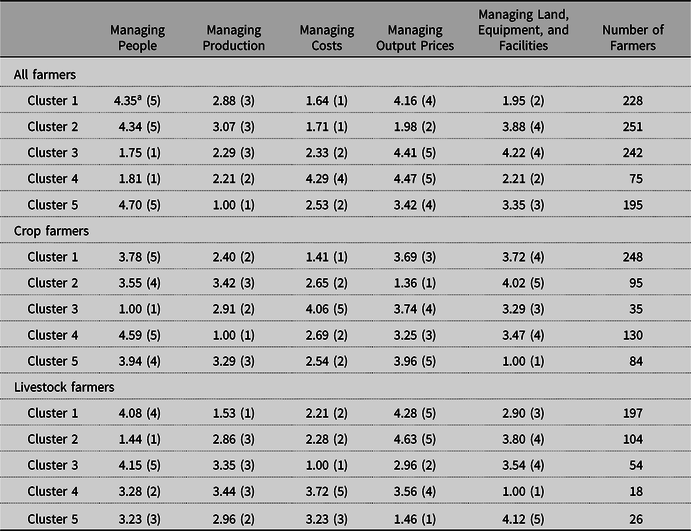
a Note that 1 represents “most important” and 5 represents “least important”; the predicted rank for each cluster is in parentheses.
For example, in the “all farmers” segment (crop and livestock producers combined) in Table 3, Cluster 1 has 228 farmers who are predicted to identify managing costs and managing land and buildings as the top two management factors. Cluster 2 farmers, in contrast, are predicted to prioritize managing costs and managing output prices as the top two factors. Clusters 3 and 4 are similar in ranking people management as the top management factor, but Cluster 3 identifies cost management as the second most important factor while Cluster 4 identifies production management as the second most important factor. Cluster 5, meanwhile, prioritizes managing production and managing costs as the top two management success factors.
When disaggregating crop and livestock farmer data sets before conducting the clustering algorithm, we see a different pattern of prioritization (see Table 3). For crop farmers, Cluster 1 farmers prioritize managing costs; Cluster 2 farmers prioritize managing output prices; Cluster 3 farmers prioritize managing people; Cluster 4 farmers prioritize managing production; and Cluster 5 farmers prioritize managing assets. Similarly, for the livestock farmers, each cluster of farmers prioritizes a particular management factor. Even though prioritizing managing costs suggests that yields are being sacrificed, the results of the cluster analysis for all farmers based on their farm type demonstrate considerable heterogeneity among farmers with regard to their prioritized management factors.
Overall, we found that the farmers ranked cost management and production management as the most important success factors. We believe that the key message is the combination of managing output and costs such that the cost per unit produced is minimized. This addresses the issue of cutting costs in ways that are detrimental to productivity. In fact, the majority of farmers in both the crop and livestock segments (64% and 49%, respectively) rank managing production and managing costs as the first and second most important strategies. We believe this to mean that the majority of farmers believe that their core strategic discipline is operational excellence in the vernacular of Treacy and Wiersma (Reference Treacy and Wiersma1993). Even in the livestock group, the second largest cluster of producers (24%) still focused on managing factors of production as the top three strategies where people management was first, followed by costs, and then production. Again, this would seem to be in line with the concept of operational excellence as the key success strategy of most farms.
Another key finding in our study is that most of the farmers did not rank managing output prices as important as managing costs or managing production. This raises a question of whether the farmers use consultants to manage their marketing. We address this question in Table 4. Table 4 presents the results of a survey question that elicits how the farmers carry out their marketing. Table 4 also disaggregates the findings by farm types and farm clusters. For the all farmers category, we found that 81% of the farmers said that they do marketing themselves, while 5%, 8%, and 6% said that it is done by a farm employee, they do not do marketing, or it is done by a contractor, respectively. This result persists even when the sample is disaggregated into livestock farmers and crop farmers; 86% of crop farmers and 74% of livestock farmers said that they do marketing themselves. We believe that the success strategies ranking is a recognition amongst most producers that they have very little control over long-term prices, and while managing short-run volatility of prices is important, it would be difficult to strategically position the farm for success based on a strategy of achieving premium prices. As such, their strategies are focused on things they can control (productivity and costs) that allow them to survive whatever long-term price impacts they may face. Furthermore, although the 2013 survey was conducted during a period of record high prices and near-record U.S. net farm income while the 2017 survey captures the adjustment from record profit to a more normal level of profitability, Lai et al. (Reference Lai, Widmar, Gunderson, Widmar and Ortega2018) and Holland et al. (Reference Holland, Widmar, Widmar, Ortega and Gunderson2014) found essentially the same groupings that we found when they used the 2013 data. This supports our notion that price management is not the long-term success strategy used by most producers since the same success strategies were pursued in both 2013 and 2017.
Table 4. Primary marketing responsibilities segmented by farmer clusters
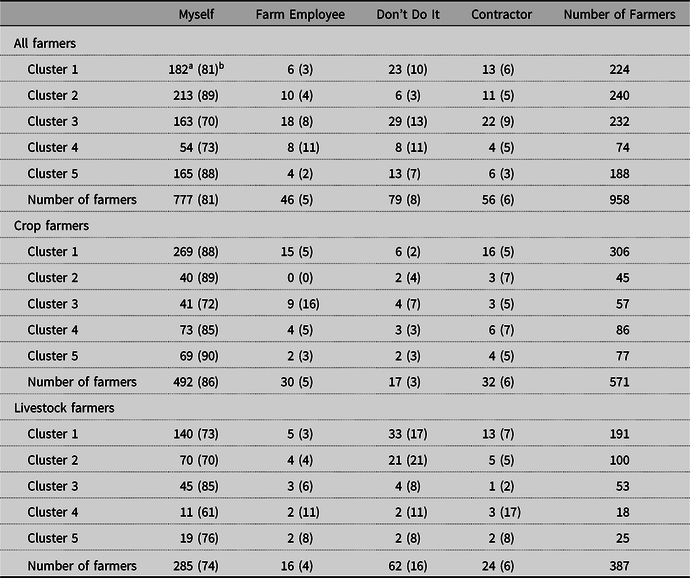
a Number of farmers in the category.
b Percentage of farmers.
Note: Note that the sample size of the clusters here is a bit different due to missing responses to the marketing questions.
Table 5 presents the demographics of each of the clusters for all farmers. For the five clusters in this group, 58% of farmers in Cluster 1 are crop farmers, 76% of farmers in Cluster 2 are crop farmers, 46% in Cluster 3, 44% in Cluster 4, and 63% in Cluster 5. In terms of farm size, a majority of farmers in Cluster 1 (64%), Cluster 2 (51%), and Cluster 5 (63%) are midsize, while a majority of farmers in Cluster 3 (74%) and Cluster 4 (64%) are categorized as commercial or large. Cluster 5 has the highest percentage of farmers above 55 years of age (78%) within the cluster, while Clusters 3 and 4 show the highest percentage of producers less than 55 years of age with 40% and 34%, respectively. Clusters 3 and 4 have the highest percentage of college-educated producers at 58% and 51%, respectively.
Table 5. Demographic and farm characteristics for all farmers by clusters
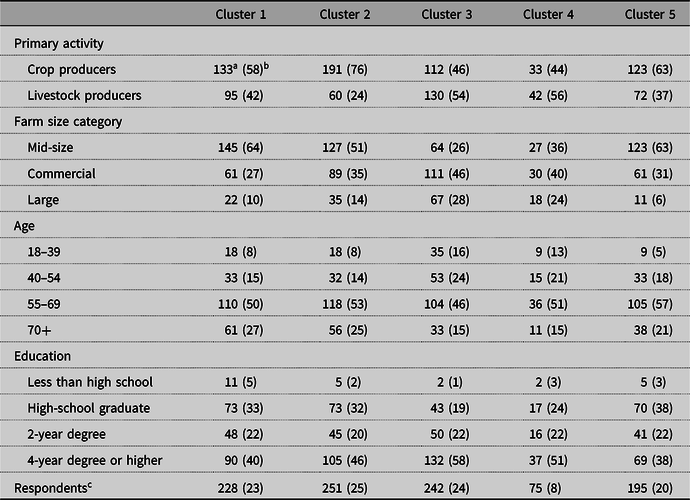
a Number of farmers.
b Percentage of farmers within the cluster.
c “Respondents” only. The number in parentheses is the percentage of the total sample.
Table 6 highlights the demographics of the crop farm clusters. A majority of farmers in Cluster 1 (45%), Cluster 4 (55%), and Cluster 5 (56%) are categorized as midsize, while a majority of crop farmers in Cluster 2 (66%) and Cluster 3 (63%) are categorized as commercial or large. Crop farm Cluster 4 has the highest percentage of crop farmers greater than 55 years old (79%), while crop farm Cluster 2 is the youngest with 31% below age 55. Crop farm Clusters 2 and 3 have the highest percentage of college-educated producers at 62% and 66%, respectively.
Table 6. Demographic and farm characteristics for crop farmers by clusters
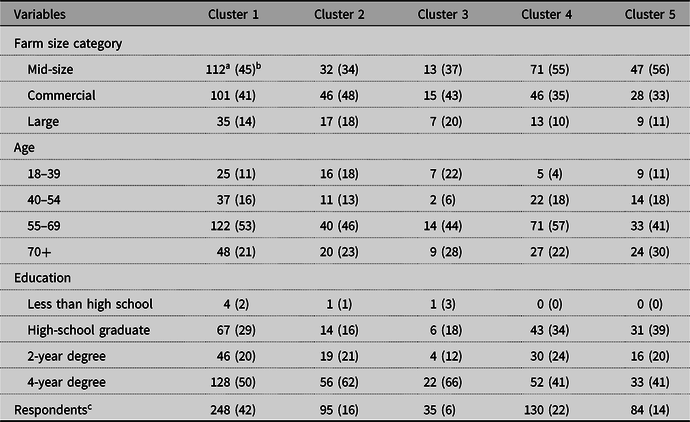
a Number of farmers.
b Percentage of farmers within the cluster.
c “Respondents” only. The number in parentheses is the percentage of the total sample.
Table 7 highlights the demographics of the livestock farm clusters. For the five clusters of livestock farmers, a majority of farmers in Cluster 2 (78%) and Cluster 5 (58%) are categorized as commercial or large, while the other three clusters have the majority of farmers categorized as midsize. Livestock farm Cluster 3 (80%) has the highest percentage of livestock farmers greater than 55 years old. Cluster 2 has the highest percentage below 55 years old at 33%. Finally, livestock farm Clusters 2 and 5 have the highest percentage of college-educated producers at 51% and 54%, respectively.
Table 7. Demographic and farm characteristics for livestock farm clusters

a Number of farmers.
b Percentage of farmers within the cluster.
c “Respondents” only. The number in parentheses is the percentage of the total sample.
5. Conclusion
Our goal in this paper is to better understand farmer priorities for management factors that they believe influence the success of their farm business. To achieve this goal, we examined farmers’ management priorities using a hierarchical clustering technique that allows emphasis to be placed on the highest-ranked management factors. The management factors were ranked from the most (1) to the least (5) important by the farmers. We obtained a dissimilarity matrix through a weighted rank coefficient and used it to cluster the sample of farmers. We then compared the groups resulting from the clustering to the entire sample and to the disaggregated samples of crop and livestock producers.
Our analysis of the resulting clusters is primarily based on a comparison of the ranked management factors, as well as the demographic characteristics of the farmers. The general result of the ranking of management factors indicates that farmers prioritized managing costs and production, which holds up even in the disaggregated samples of crop and livestock producers. However, the results of the cluster analysis revealed significant heterogeneity among the prioritized management strategies and the combined sample and disaggregated sample of crop and livestock farmers. The results of the clustering indicate that there are distinct groups of farmers who put more emphasis on different management factors. Although managing costs and production still represent a large proportion of farmers, managing people, managing assets, and managing output prices were selected by unique groups of farmers as the topmost management factors for the success of their farm business. Overall, it appears that the farmers generally considered managing output prices as the least important management factor for success. This result is perhaps intuitive since output prices appear to be the factor that is least under the control of the farmers. This interpretation is corroborated by the survey question that focuses on how the farmers carry out marketing, which shows that more than three quarters of the farmers said that they do not do marketing.
The demographic characteristics of each cluster reveal some interesting features for the groups. For the overall sample, farmers in Clusters 3 and 4 are generally larger, younger, and more educated. These two clusters combined represent 32% of all farmers (24% for Cluster 3 and 8% for Cluster 4). These two clusters prioritize people management as the most important management factor with Cluster 3 prioritizing cost and production as second and third most important, while Cluster 4 prioritizes production and asset management as the next most important factors. From the perspective of agribusinesses serving these segments, recognition of the importance of people management to the business and the role of productivity will be important in the value proposition.
For the crop farm sample, Cluster 2 is generally larger, younger, and more educated than the other clusters. This cluster prioritizes product prices and costs as the top two management factors, suggesting margin management as a key success factor. This group represents 16% of crop farmers. However, the largest cluster, Cluster 1, represents 42% of all crop producers. This cluster of crop farmers prioritizes cost and production as the top two factors. The demographics suggest that this group is somewhat larger than most of the other clusters (excluding Cluster 2), but with respect to age and education, the cluster does not appear to stand out from the other clusters. This suggests that crop farmers, relative to the combined sample, are a more homogeneous group in general. Input and service providers should recognize that cost and production management are the critical factors for crop farmers, suggesting cost per unit of output or productivity is the driving decision factor for a large proportion of crop farms.
For the livestock farm sample, Clusters 2 and 5 are generally larger, younger, and more educated. These two clusters represent 33% of all livestock producers in the sample. Cluster 2 is the more important group from the standpoint of cluster size with 26% of the sample in this cluster. Cluster 2 prioritizes people management, cost management, and production management, respectively. Cluster 1 is the largest livestock cluster with 49% of the sample. Compared to Cluster 2, Cluster 1 consists of farms that are smaller, older, and less educated. Cluster 1 prioritizes production management, cost management, and asset management, respectively. But the key differentiator between Cluster 2 and Cluster 1’s success strategies is the role of people management, likely reflective of their size differences. For Cluster 2, it seems clear that while cost and production management are decision priorities similar to Cluster 1, input and service providers would do well to understand the organizational and decision structure of the farms in this group because they are likely to be more complicated and sophisticated in their decision structure.
Overall, the results of this study are consistent with other research that has examined farmer business strategies. However, our results have illustrated the heterogeneity that exists in farmer priorities of the various management strategies. The results indicate that crop and livestock farmers differ in important ways in management priorities. In each sector, there are distinct clusters of farmers who prioritize different management factors, and in some cases, these distinct clusters have demographic features that stand out from the larger groups. Nonetheless, in both crop and livestock sectors, there is a large cluster of producers that remain relatively homogenous. Further research could examine the dynamic transition of these clusters. Are those in the largest, most homogeneous cluster slowly dividing into the other clusters, or are farmers becoming more homogeneous over time? It would be interesting to explore algorithms that could predict individual farmers into a particular management strategy profile (cluster). Given the demographics in our clusters are similar across many of the clusters, future research should look at other demographic and psychographic factors that might improve the classification of individual farmers. This additional research would help input and service providers tailor offerings to meet the needs of farmers in different strategy profiles.
Appendix A. Survey instrument
1. Are you primarily a livestock or a crop producer?
— Livestock
— Crop
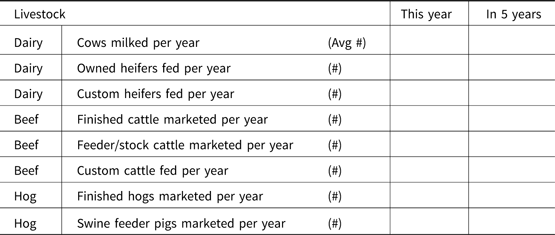
2. For livestock producers:
How large is your farming operation?
How large do you expect it to be in 5 years (complete appropriate boxes below)?
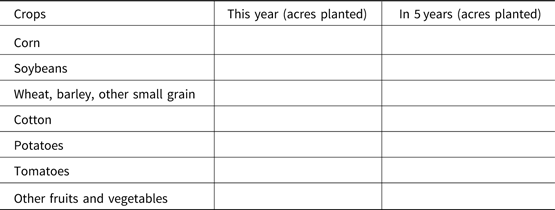
3. For crop producers:
How large is your farming operation?
How large do you expect it to be in 5 years (complete appropriate boxes below)?
4. When managing your farm business, which of the following activities is the most important to your SUCCESS as a farmer? Please rank your responses from 1 to 5, where 1 is “the most important” and 5 is “the least important.”
— Managing people
— Managing production
— Managing/controlling costs
— Managing output prices
— Managing land, equipment, and facilities
5. What is the highest level of education you have completed?
— Less than high school
— High-school graduate
— 2-year degree
— 4-year degree
— Master’s degree
— Doctorate
6. What is your gender?
— Male
— Female
7. What year were you born? ——————
8. Who is primarily responsible for doing the following tasks (check appropriate box)?

9. In which states is your farm business located (use state abbreviations)? —————————


 Open access