

This chapter introduces the major collective actors involved in education politics during the postwar reform period, with a focus on their structural and social base and power resources, such as election results, government participation, membership numbers, and financial resources. This is motivated by the insight that cleavages have structural and organizational dimensions, which develop historically and, at any given time, limit actors’ scope of action to some extent. In the present chapter, these structural and organizational dimensions are explored.
The analysis shows that party systems and teachers’ organizational structures were shaped by additional cleavages besides the class cleavage. Rural and Christian interests were represented in different ways. In Germany, the state-church cleavage was expressed organizationally by splits among primary schoolteachers’ organizations. In Norway, primary schoolteachers were comparatively more united, especially after 1966. Furthermore, the distribution of power resources between the left and the right in the two countries was somewhat different, though not so different as to preclude alternative outcomes in education politics. The failure of Norwegian conservatives and of German social democrats to shape education politics more decisively cannot be explained by a lack of financial resources or insufficient membership numbers. Moreover, analyzing the distribution and development of power resources alone cannot tell us how Norwegian social democrats and German Christian democrats managed to build strong and stable alliances. To understand outcomes in school policy it is therefore necessary to also examine the ideological expressions of cleavages and how actors navigated cleavage structures with respect to potential coalitions in education politics. This is done in Chapters 4 and 5.
The Norwegian Playing Field
Political Parties
In Norway, the Labor Party was the strongest political force during the postwar decades. In terms of election results, the Conservative Party posed no serious competition until the late 1970s (Figure 3.1). Among the Labor Party’s voters were many workers, large sections of the urban middle class, including public but also private employees, fishermen and farmers in rural areas – especially in northern Norway – and a proportion of the self-employed (Reference SvåsandSvåsand, 1985, 182ff; Reference ValenValen, 1981, 104ff). The Labor Party was equally successful among women as among men but more successful among those with shorter educations than among those with longer educations (Reference SvåsandSvåsand, 1985, 181, 188; Reference ValenValen, 1981, 28f, 119). In 1977, the Labor Party’s voters had on average 8.8 years of education – less than the average education of the voters of all other parties (Reference ValenValen, 1981, 119). The party did well in municipal elections, including in rural areas. For example, in 1963, 242 of 525 Norwegian mayors were members of the Labor Party, compared to 31 conservative mayors, 58 liberal mayors, 87 mayors belonging to the Center Party and 20 mayors belonging to the Christian Democrats (Reference Svåsand, Katz and MairSvåsand, 1992, 742). The Labor Party was affiliated with the Norwegian trade unions that represented many workers and later also white-collar employees (Reference SassSass, 2012, 2014). In 1954, around 43 percent of wage earners were members of trade unions belonging to the social-democratic Federation of Trade Unions (Landsorganisasjonen). By 1980, the number had decreased to around 38 percent (Reference StokkeStokke, 2000, 17). Eight percent of wage earners were members of other trade unions in 1950 and this number grew continually in the following decades (Reference StokkeStokke, 2000, 17). Among these non–social democratic trade unions were the largest teachers’ unions, discussed in more detail below.
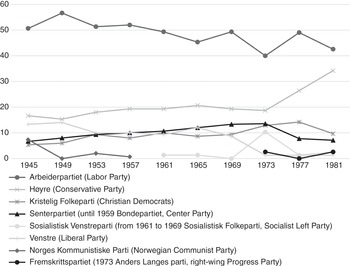
Figure 3.1 Parties’ percentage of seats in the Norwegian parliament, 1945–81.
The Norwegian Conservative Party (Høyre) had its roots in the conservative state bureaucracy and the economic, urban upper class (Reference Kaartvedt and SejerstedKaartvedt, 1984, 392; Reference Svåsand and VeenSvåsand, 1994b, 169ff). After the Second World War, it represented primarily urban middle- and upper-class voters working in the private sector and self-employed people. The share of workers among its voters was 5–6 percent until 1973. This grew from the late 1970s onward, mostly among non-unionized workers with roots in middle-class families (Reference Svåsand and VeenSvåsand, 1994b, 215f). As illustrated by the low number of mayors referred to above, the Conservative Party was weak in rural areas. It did poorly in municipal elections compared to national elections, partly because its party organization was weak (Reference Svåsand and VeenSvåsand, 1994b, 145). Men were more likely to vote for the Conservative Party than women and those with long educations were more likely to vote for the Conservative Party than those with short ones (Reference SvåsandSvåsand, 1985, 188; Reference Svåsand and VeenSvåsand, 1994b, 215). On average, the Conservative Party’s voters had 10.8 years of education in 1977. Its voters were the most educated of all parties, apart from the Socialist Left Party (Reference ValenValen, 1981, 119). Around two-thirds of the parliamentary representatives had completed a university education during the period examined here (Reference Svåsand and VeenSvåsand, 1994b, 166). The Conservative Party was successful among those with high incomes. In 1977, 48 percent of those with a yearly income above 100 000 kroner voted Conservative (Reference ValenValen, 1981, 114). From the 1970s, the Conservative Party managed at least temporarily to attract voters from the middle and lower classes by projecting “an image of expanding the role of the welfare state” (Reference Svåsand, Katz and MairSvåsand, 1992, 733).
The political center, consisting of the Liberal Party (Venstre), the Christian Democrats (Kristelig Folkeparti), and the Center Party (Senterpartiet), played an important role, as the Labor minority governments needed the center’s support. The center parties were also the only potential coalition parties for the Conservative Party. Voters and members of the Christian Democrats and the Center Party were similar. Both parties were strong in the rural periphery (Reference SvåsandSvåsand, 1985, 80ff, 122ff). The average incomes and the average lengths of education of the two parties’ voters were low (Reference ValenValen, 1981, 114ff). The Christian Democrats received votes from all social classes, including a share of the working class and the farmers’ votes. Women were more likely to vote for them than men. Voters who belonged to the language movement or the teetotal movement and regular churchgoers were likely to vote for the Christian Democrats (Reference Svåsand and VeenSvåsand, 1994b, 223f). The Center Party was supported by many farmers and fishermen and received small but stable percentages of the votes of other social classes (Reference SvåsandSvåsand, 1985, 182ff).
The early Liberal Party organized farmers and members of the urban and rural middle class but also had a radical current which cooperated with unions (Reference MjeldheimMjeldheim, 1978, 271ff; Reference MjeldheimMjeldheim, 1984, 358ff). During the postwar period, the party had lost much of its early importance and it was weakened further due to the struggle over membership of the European Community. It received votes from various social classes and had its roots in the periphery; on average, however, its voter base was more highly educated and had a higher income than that of the other center parties (Reference SvåsandSvåsand, 1985, 84ff; Reference ValenValen, 1981, 114ff).
On the left of the Labor Party stood the Socialist People’s Party (Sosialistisk Folkeparti), founded in 1961 and later called Socialist Electoral Alliance (Sosialistisk Valgallianse) and Socialist Left Party (Sosialistisk Venstreparti). This party was opposed to the Labor Party in foreign politics. In 1977, the voters of the Socialist Left Party had the highest average education (11.2 years) but also the lowest average income of all Norwegian parties. Both these findings are partly because a high percentage of the Socialist Left Party’s voters were under thirty years old (Reference SvåsandSvåsand, 1985, 180, 187f; Reference ValenValen, 1981, 119).
The Communist Party (Norges Kommunistiske Parti) did not play a significant role after the 1950s. Similarly, the Red Party (Rød Valgallianse, today Rødt), has been small most of the time, despite recent electoral successes. The Red Party’s predecessor, the Workers’ Communist Party (Arbeidernes Kommunistparti, AKP), was not represented in parliament but played a role in education politics through its members’ activities in teachers unions. This party was founded in 1973 and resulted from a split between the Socialist People’s Party and its youth organization in 1969. Finally, the Progress Party (Fremskrittspartiet, called Anders Lange’s Party until 1977) was founded in 1973 and became a voice of the far right. However, it had no influence on the school reforms begun in 1954 and does not feature in the rest of this book.
Regarding government participation, the Labor Party was the most dominant party. Until 1961, it had an absolute majority. Most ministers of education were members of the Labor Party (Table 3.1). The only relevant exceptions were the period from 1965 to 1971, when Kjell Bondevik from the Christian Democrats was minister of education in a coalition of the center parties and the Conservative Party, and the period 1972–3 during a short-lived government of center parties. Only in 1981 did the Conservative Party form a minority government for the first time. To understand the necessity of coalition-building in Norwegian politics, it should be added that most Norwegian governments after 1961 were minority governments, except for the government of the Conservative Party and center parties in 1965–71.
Table 3.1 Composition of Norwegian governments and ministers of education, 1951–83
| Years | Composition of government | Minister of education |
|---|---|---|
| 1951–5 | Labor Party | Lars Magnus Moen (1951–3), Birger M. Bergersen (1953–5), both Labor Party |
| 1955–63 | Labor Party | Birger M. Bergersen (1955–60), Helge Sivertsen (1960–3), both Labor Party |
| Aug. 28–Sept. 25, 1963 | Conservative Party (held post of prime minister), Liberal Party, Center Party, Christian Democrats | Olav Kortner, Liberal Party |
| 1963–5 | Labor Party | Helge Sivertsen, Labor Party |
| 1965–71 | Center Party (held post of prime minister), Conservative Party, Christian Democrats, Liberal Party | Kjell Bondevik, Christian Democrats |
| 1971–2 | Labor Party | Bjartmar Alv Gjerde, Labor Party |
| 1972–3 | Christian Democrats (held post of prime minister), Liberal Party, Center Party | Anton Skulberg, Center Party |
| 1973–6 | Labor Party | Bjartmar Alv Gjerde, Labor Party |
| 1976–81 | Labor Party | Kjølv Egeland (1976–9), Einar Førde (1979–81), both Labor Party |
| 1981–3 | Conservative Party | Tore Austad, Conservative Party |
The Labor Party had most members at the beginning of the reform period, but membership of the Conservative Party and the Christian Democrats grew during the 1970s (Table 3.2). In 1961, 7.04 percent of the electorate were members of the Labor Party, 4.17 percent were members of the Conservative Party, 2.61 percent were members of the Center Party, 1.3 percent were members of the Christian Democrats, and 0.43 percent were members of the Liberal Party. By 1981, a slightly higher percentage of the electorate were members of the Conservative Party than of the Labor Party (Reference Katz, Mair, Bardi, Bille, Deschouwer, Farrell, Koole, Morlino, Müller, Pierre, Poguntke, Sundberg, Svasand, van de Velde, Webb and WidfeldtKatz et al., 1992, 343).
Table 3.2 Party membership in Norway over time
| Year | Labor Party | Conservative Party | Liberal Party | Center Party | Christian Democrats | Socialist People’s Party/Socialist Left Party | Progress Party |
|---|---|---|---|---|---|---|---|
| 1960 | 165 096 | 96 931 | 61 000a | 30 346a | |||
| 1970 | 155 254 | 110 241 | 13 220b | 70 000 | 41 137b | ||
| 1980 | 153 507 | 152 185 | 12 007 | 53 517 | 69 697 | 10 000c | 10 000c |
a Figure for 1961. b Figure for 1972. c Figure for 1979.
The Conservative Party employed a higher number of paid staff (Table 3.3). This is related to the Conservative Party’s finances. Before 1970, parties received no state subvention, so their main income consisted of membership fees, donations, and lotteries (Reference Svåsand, Katz and MairSvåsand, 1994a, 324). As implied by the column labeled ‘Other’ in Table 3.4, the Conservative Party received higher donations than any other party. The Labor Party depended on state subventions to a higher degree (Reference Svåsand, Katz and MairSvåsand, 1994a, 324). Despite the electoral successes of the Labor Party, the Conservative Party was an important political player with considerable power resources.
Table 3.3 Numbers of paid staff of Norwegian parties over time
| Years | Labor Party | Conservative Party | Liberal Party | Center Party | Christian Democrats | Socialist People’s Party/Socialist Left Party | Progress Party |
|---|---|---|---|---|---|---|---|
| 1961–5 | 53 | 74 | 12 | ||||
| 1969–73 | 55 | 113 | 10 | 26 | 38 | ||
| 1977–81 | 92 | 131 | 9 | 36 | 55 | 20 | 1 |
Note: Numbers include paid staff in the central organization, the subnational organization, the parliamentary group, youth organizations and women’s organizations of the parties.
| Labor Party | Conservative Partya | |||||
|---|---|---|---|---|---|---|
| Income from members and branches | State subvention | Other | Income from members and branches | State subvention | Other | |
| 1961–4 | 416 164 | 1 518 798 | 2 700 328 | |||
| 1969–72 | 624 211 | 4 034 333 | 2 394 296 | 1 696 933 | 3 787 058 | |
| 1977–80 | 852 147 | 8 425 274 | 3 697 211 | 4 786 782 | 7 693 671 | |
| Liberal Party | Center Party | |||||
|---|---|---|---|---|---|---|
| Income from members and branches | State subvention | Other | Income from members and branches | State subvention | Other | |
| 1961–4 | 29 839 | 298 680 | ||||
| 1969–72 | 136 605 | 727 725 | 427 228 | |||
| 1977–80 | 90 220 | 635 180 | 544 863 | 1 354 925 | 1 885 856 | 3 578 016 |
| Christian Democrats | Socialist People’s Party/Socialist Left Party | |||||
|---|---|---|---|---|---|---|
| Income from members and branches | State subvention | Other | Income from members and branches | State subvention | Other | |
| 1961–4 | ||||||
| 1969–72 | 125 275 | 754 993 | 399 898 | |||
| 1977–80 | 283 850 | 2 559 530 | 1 070 861 | 291 458 | 1 099 067 | 868 035 |
a Conservative membership fees are divided between municipal and provincial branches, so the central organization does not receive any share of them.
Teachers’ Organizations
There were three major teachers’ organizations in Norway during the postwar reform period. The Norwegian Teachers’ Association had been founded by primary schoolteachers as Norges lærerforening in 1892 and had been renamed Norges lærerlag in 1912. Female primary schoolteachers organized in the Female Teachers’ Organization (Norges Lærerinneforening) from 1912 to 1966. They did not feel that they received enough support from their male colleagues in their struggle for equal wages and career opportunities (Reference HagemannHagemann, 1992, 135ff; Reference TønnessenTønnessen, 2011, 37). Most of them had urban upper- or middle-class backgrounds, whereas the male primary schoolteachers more often stemmed from the rural lower- and middle-class population – a difference which persisted well into the postwar period (Reference HagemannHagemann, 1992, 145ff, 242). In 1966, female primary schoolteachers again joined the Norwegian Teachers’ Association, which was renamed Norsk Lærerlag, thereby overcoming the gendered, geographical, and class-based division of primary schoolteachers (Reference MediåsMediås, 2010, 58f). From 1939, framhaldsskole teachers organized in Framhaldsskolelærerlaget, but this organization was much smaller, with 426 members in 1955 (Reference HagemannHagemann, 1992, 296). It joined the Norwegian Teachers’ Association in 1961.
The Association of Norwegian Secondary Schoolteachers was founded in 1892 as Filologenes og realistenes landsforening. The secondary schoolteachers belonged to the upper class of civil servants, were highly educated, and were paid well (Reference Grove, Michelsen, Slagstad and MesselGrove/Michelsen, 2014, 312ff). In 1939, they renamed their organization Norsk Lektorlag (Reference MediåsMediås, 2010, 41). From 1947, this association opened up to all teachers teaching at secondary schools, independent of education – a pragmatic decision related to the competition with primary schoolteachers, who were taking over more of lower secondary education (Reference Grove, Michelsen, Slagstad and MesselGrove/Michelsen, 2014, 316ff; Reference SeipSeip, 1990; Reference SlagstadSlagstad, 2000, 56f).
In terms of membership numbers, the Norwegian Teachers’ Organization was the most important teachers’ organization (Table 3.5). In the course of the educational expansion, the organizations of both primary and secondary schoolteachers grew, but the primary schoolteachers consolidated their leading position.
Table 3.5 Membership numbers of the main Norwegian teachers’ organizations
| Year | Norwegian Teachers’ Association (Norges Lærerlag; Norsk Lærerlag from 1966) | Association of Norwegian Secondary Schoolteachers (Norsk Lektorlag) | Female Teachers’ Association (Norges Lærerinneforbund) |
|---|---|---|---|
| 1955 | 9 511 | 2 580 | 2 099 |
| 1960 | 11 650 | 3 430 | 2 996 |
| 1964 | 14 188 | 3 798 | 2 687 |
| 1966 | 15 962 | 4 281 | 2 564 |
| 1967 | 19 313 | 4 443 | |
| 1970 | 23 519 | 5 264 | |
| 1974 | 31 711 | 6 764 | |
| 1979 | 43 803 | 10 934 |
The Norwegian Teachers’ Association also had the largest financial resources (Table 3.6). Besides its income from membership fees, it had funds, such as the Fondet til særlige tiltak (the fund for special measures), which was used for legal assistance for members and lent much of its capital to the organization’s credit bank. In 1965, the fund’s capital stood at 2 422 490 NOK. The Norwegian Teachers’ Association ran a press office that published journals and had income from these. The Female Teachers’ Association’s funds were small compared to the other organizations.
Table 3.6 Total size of budget of teachers’ organizations and amount of membership fees over time, rounded figures (in Norwegian kroner)
| Year | Norwegian Teachers’ Association (Norges Lærerlag; Norsk Lærerlag from 1966) | Association of Norwegian Secondary Schoolteachers (Norsk Lektorlag) | Female Teachers’ Association (Norges Lærerinneforbund) | |||
|---|---|---|---|---|---|---|
| Total budget | Membership fees | Total budget | Membership fees | Total budget | Membership fees | |
| 1956 | 631 640 | 606 840 | 276 600 | 244 780 | 185 310 | 134 500 |
| 1961 | 1 022 280 | 940 300 | 610 610 | 539 950 | 175 760 | 161 850 |
| 1966 | 3 104 090 | 2 633 180 | 1 181 240 | 966 100 | 305 030 | 208 260 |
| 1967 | 3 702 000 | 3 103 530 | 1 284 990 | 1 002 150 | ||
| 1969 | 5 238 030 | 4 384 190 | 1 625 480 | 1 251 880 | ||
| 1974 | 7 022 290 | 5 838 760 | 3 441 370 | 2 675 650 | ||
| 1979 | 17 007 680 | 17 346 550 | 9 114 150 | 7 217 170 | ||
The Association of Norwegian Secondary Schoolteachers had a large fund (Norsk Lektorlagets Fond) whose capital account stood at 2 173 070 NOK in 1965 – almost as large as the fund of the Norwegian Teachers’ Association. The organization’s budget was smaller but in 1979 it was more than half of the Norwegian Teachers’ Association’s budget, even though there were around four times as many primary schoolteachers. The organization published the journal Den Høgre Skolen (The Secondary School), which changed its title to Skoleforum (School Forum) in 1976. The change was in recognition of the fact that some members of the organization were teaching in the youth school, now a part of primary school. Strictly speaking, it was no longer an organization solely of secondary schoolteachers. Competition with the Norwegian Teachers’ Association was fierce at the youth school level.
All three teachers’ organizations were important political players, but the experts interviewed for this study agreed that the Norwegian Teachers’ Association was most influential, as it cooperated closely with the Labor Party. Kari Lie, former secretary, vice-chair, and chair of the Norwegian Teachers’ Association, confirmed that it was important to have good contact with the Labor Party, as it controlled the Ministry of Education most of the time (Table 3.1). According to the conservative politician Lars Roar Langslet, the Conservative Party also had amicable relations with the Norwegian Teachers’ Association, but the Association of Norwegian Secondary Schoolteachers had been a closer ally:
There were of course varying political positions within the Association of Norwegian Secondary Schoolteachers and the Norwegian Teachers’ Association, but we had better contact with the Association of Norwegian Secondary Schoolteachers on many issues in the Conservative Party. Kaltenborn, who was chair of the association for a time [from 1965 to 1971], was also active as conservative politician. But it wasn’t as if we brought our heads together and collectively agreed about this or that; it wasn’t that kind of cooperation.
Other experts made similar statements. Many secondary schoolteachers had conservative inclinations and many primary schoolteachers leaned toward social democracy. However, the teachers’ organizations attempted to remain independent of the parties, and many teachers were also active in other parties. The Liberal Party had long been known as the primary schoolteachers’ party. Both within the Association of Norwegian Secondary Schoolteachers and within the Norwegian Teachers’ Association, there were also small but active minorities of socialist and communist teachers. During the 1970s, many of them were members of the AKP but also earlier there had been socialists among the secondary schoolteachers, such as the politician, Trygve Bull.
Other Actors
Several other collective actors played a role in education politics, such as the Protestant church and its lay organizations, which were involved in debates about Christian education and private schooling. In the debates about comprehensive schooling, the Norwegian church did not play a significant role, as it did not declare itself strongly for or against comprehensive schooling. The same is true of initiatives by parents and associations involved in the language struggle. These actors’ impact is discussed in more detail in Chapter 5. The employers’ organizations and the Federation of Trade Unions were mostly involved in debates about upper-secondary and vocational education and had little to say about the prolonging of comprehensive education to nine years.
Finally, various education-political councils played a role, especially the Experimental Council (Forsøksrådet). The Experimental Council was composed of reform-oriented social scientists and politicians but was formally independent of party politics. Another important body was the Primary School Committee (Grunnskolerådet), which advised the ministry on reforms regarding primary schools. School directors also played a role as facilitators of reforms (Reference Telhaug and MediåsTelhaug/Mediås, 2003, 190ff).
The German Playing Field
Political Parties
The Christian Democratic Union (CDU) and the Social Democratic Party (SPD) were the two major parties in postwar West Germany. The CDU was the most successful party in elections on the national level, and in North Rhine–Westphalia (NRW) until the mid-1960s (Figure 3.2). The SPD had better election results in NRW than nationally, especially in later decades (Figures 3.2 and 3.3).
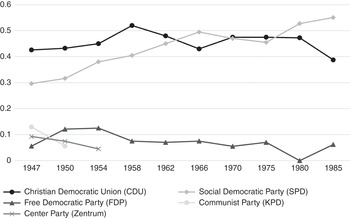
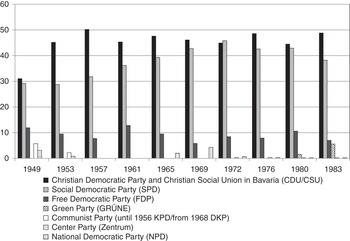
The CDU followed in the footsteps of the Catholic Center Party, which disappeared from the NRW parliament in 1958 and was mostly absorbed into the CDU. On the national level, the CDU cooperated with its strongly conservative Bavarian sister party, the Christian Social Union (CSU). In the Rhineland, some of the founding members of the CDU were quite leftist but Konrad Adenauer, soon to be one of the leading figures, fought such tendencies effectively (Reference DüdingDüding, 2008, 41ff). The CDU had been founded with the aim to unite Christians across the denominations. Nevertheless, in 1971, 73 percent of CDU members were Catholic and 25 percent Protestant. The Catholic Church supported the CDU rather openly, while the Protestant Church did not take as clear a stand (Reference SchmittSchmitt, 1989, 78ff). Among churchgoing, conservative Protestants, the CDU was more successful than the SPD (Reference Haungs and VeenHaungs, 1983, 23; Reference SchmittSchmitt, 1989).
In comparison with the Catholic Center Party, the CDU was more clearly a right-wing party, representing upper-class interests. The integration of upper-class Protestants in the party meant that the Catholic workers’ wing was relegated to an internal leftist opposition (Reference SchmittSchmitt, 1989, 79, 219). CDU membership was dominated by white-collar employees and the self-employed, who also made up the majority of the CDU’s representatives in the NRW parliament (Reference DüdingDüding, 2008, 519). Workers made up around 11 percent of the CDU’s membership in 1980 compared to around 28 percent of the SPD’s membership in 1978 (Reference Von Beymevon Beyme, 1985, 214f). Seventeen percent of CDU members were union members (Reference Haungs and VeenHaungs, 1983, 36). Women were more likely to vote CDU than men and the CDU had a slightly higher percentage of female members then the SPD (Reference Haungs and VeenHaungs, 1983, 22, 36).
The educational attainment of CDU members and members of parliament was a little higher than that of SPD members. In 1947, 47.8 percent of the CDU’s representatives in the NRW parliament had only attended the Volksschule, and by 1966, this share had dropped to 25.6 percent (Reference DüdingDüding, 2008, 516). In 1971, 19 percent of CDU members on the national level had completed the Abitur and, by 1977, the percentage was 28 percent (Reference Haungs and VeenHaungs, 1983, 36). The educational attainment of CDU voters was considerably lower than among its members (Reference Haungs and VeenHaungs, 1983, 37). The CDU was more successful than the SPD in rural areas, especially in Catholic-dominated areas. In such areas, and also in small and middle-sized towns, workers, especially qualified workers, tended to vote CDU (Reference Haungs and VeenHaungs, 1983, 22f).
Over time, the SPD turned from a party dominated by workers into a party of public employees, teachers, and social workers. In 1972, one-third of the members belonged to the age group of sixteen to twenty-four-year-olds (Reference WalterWalter, 2011, 178f). This development was reflected in the educational attainment of its representatives in the NRW parliament. In the first postwar parliament, 78 percent of the SPD representatives had only attended the Volksschule, against 7.8 percent who had completed the Abitur exam. By 1966, 46.4 percent were Volksschule graduates, while 41.4 percent had completed the Abitur (Reference DüdingDüding, 2008, 516). Among the members of the SPD, the share of Abitur graduates was not as high. In 1977, it was 15 percent. In the same year, 53 percent of the SPD’s members were Protestant and 28 percent Catholic (Reference Haungs and VeenHaungs, 1983, 36). The SPD cooperated with the German Confederation of Trade Unions (DGB), founded in 1949. Despite the DGB’s formal independence of party politics, the trade unions were dominated by social democrats. The DGB unions organized a little more than 30 percent of German wage earners during the 1960s and 1970s (Reference EbbinghausEbbinghaus, 2002, 9). In 1977, 50 percent of the SPD’s members were union members (Reference Haungs and VeenHaungs, 1983, 36).
The third party in the German national and federal parliaments was the liberal Free Democratic Party (FDP), which aimed at uniting national and social liberals. The early FDP had its strongholds in urban areas and in Protestant rural areas. It was more successful among Protestants than among Catholics (Reference Vorländer, Decker and NeuVorländer, 2013, 275). In the late 1970s, the members of the FDP were mainly white-collar employees, and some civil servants and self-employed, while the share of workers was around 5 percent (Reference Von Beymevon Beyme, 1985, 213). The FDP’s parliamentary representatives in NRW were highly educated compared to the CDU’s and especially the SPD’s: in the first postwar parliament, only 16.7 percent had not continued their education after the Volksschule and this share dropped to zero by 1966. Most FDP representatives were self-employed in most of the election periods before 1980 (Reference DüdingDüding, 2008, 516, 519f). In NRW, the early FDP comprised many former Nazi officials, some of whom had excellent links with industrial leaders. The social liberal current became more influential during the 1960s and 1970s (Reference DüdingDüding, 2008, 50ff, 295ff, 626ff).
Finally, the German Communist Party (KPD) disappeared from NRW’s parliament in 1954 and was banned in 1956 (Reference DüdingDüding, 2008, 334ff). In 1968, a new Communist Party, the DKP, was founded, but it never secured any seats in parliament. Its members played a role in some unions, including the Education and Science Workers’ Union.
In contrast to Norway, majority governments were the rule. Until 1966, the CDU and its Bavarian sister party CSU governed on the national level, from 1961 on only with the FDP (Table 3.7). The SPD joined the national government for the first time in 1966, in a coalition with the CDU/CSU. By 1969, the balance of power had changed to the extent that Willy Brandt became the first SPD chancellor, forming a government with the FDP. From 1974 until 1982, this coalition was continued under Helmut Schmidt (SPD).
Table 3.7 West German and North Rhine–Westphalia governments and ministers of education over time
| Years | Composition of national government | Minister of education | Years | Composition of NRW government | Minister of education |
|---|---|---|---|---|---|
| 1949–63 | CDU (Chancellor Konrad Adenauer), with various small parties; from 1961 only with CSU and FDP | No such ministry | 1950–4 | CDU (Ministerpräsident Karl Arnold), Center Party | Christine Teusch (CDU) |
| 1963–6 | CDU (Chancellor Ludwig Erhard), CSU, FDP | No such ministry | 1954–6 | CDU (Ministerpräsident Karl Arnold), FDP, Center Party | Werner Schütz (CDU) |
| 1966–9 | CDU (Chancellor Kurt Georg Kiesinger), CSU, SPD | No such ministry | 1956–8 | SPD (Ministerpräsident Fritz Steinhoff), FDP, Center Party | Paul Luchtenberg (FDP) |
| 1969–74 | SPD (Chancellor Willy Brandt), FDP | Hans Leussink (no party affiliation) 1969–72, Klaus von Dohnanyi (SPD) 1972–4 | 1958–62 | CDU (Ministerpräsident Franz Meyers) | Werner Schütz (CDU) |
| 1974–82 | SPD (Chancellor Helmut Schmidt), FDP | Helmut Rohde (SPD) 1974–8, Jürgen Schmude (SPD) 1978–82 | 1962–6 | CDU (Ministerpräsident Franz Meyers), FDP | Paul Mikat (CDU) |
| 1966–78 | SPD (Ministerpräsident Heinz Kühn), FDP | Fritz Holthoff (SPD) 1966–70; Jürgen Girgensohn (SPD) 1970–83 | |||
| 1978–98 | SPD (Ministerpräsident Johannes Rau), with FDP; from 1980 SPD majority | Jürgen Girgensohn (SPD) 1970–83; Hans Schwier (SPD) 1983–95 |
In NRW, the SPD governed for the first time with the FDP from 1956 to 1958. In 1958, the CDU secured the absolute majority in the NRW elections and governed for another eight years. NRW became a “red” federal state in 1966, when the tide turned in the SPD’s favor and NRW became a stronghold of the SPD for many decades to come.
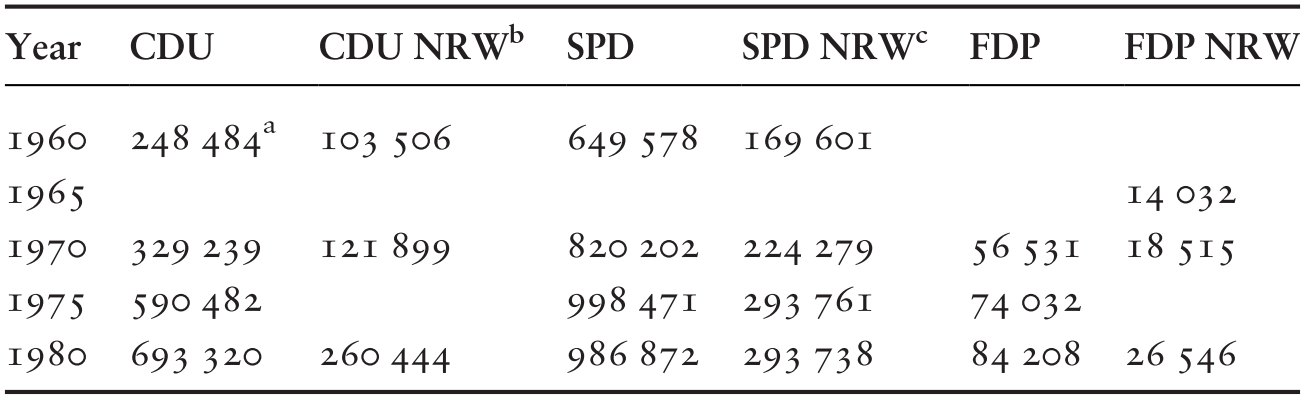
In terms of membership, the SPD had long been strong but had been weakened by splits and Nazi dictatorship (Reference WalterWalter, 2011, 27f). In the postwar decades, the SPD still had more members than the CDU, but membership only approached a million again in 1975 (Table 3.8). In 1961, 0.66 percent of the national electorate were members of the CDU compared to 1.72 percent that were members of the SPD. By 1976, these numbers had increased to 1.55 percent for the CDU and 2.43 percent for the SPD (Reference Katz, Mair, Bardi, Bille, Deschouwer, Farrell, Koole, Morlino, Müller, Pierre, Poguntke, Sundberg, Svasand, van de Velde, Webb and WidfeldtKatz et al., 1992, 341). The FDP’s members made up 0.19 percent of the national electorate in 1976 (Reference Katz, Mair, Bardi, Bille, Deschouwer, Farrell, Koole, Morlino, Müller, Pierre, Poguntke, Sundberg, Svasand, van de Velde, Webb and WidfeldtKatz et al., 1992, 341). Comparing the membership numbers of SPD and CDU in NRW and their national membership shows that the CDU had a comparably strong membership base in NRW. This is related to the strength of its predecessor, the Center Party and to the importance of political Catholicism in this region.
Table 3.8 Party membership in West Germany over time
| Year | CDU | CDU NRWb | SPD | SPD NRWc | FDP | FDP NRW |
|---|---|---|---|---|---|---|
| 1960 | 248 484a | 103 506 | 649 578 | 169 601 | ||
| 1965 | 14 032 | |||||
| 1970 | 329 239 | 121 899 | 820 202 | 224 279 | 56 531 | 18 515 |
| 1975 | 590 482 | 998 471 | 293 761 | 74 032 | ||
| 1980 | 693 320 | 260 444 | 986 872 | 293 738 | 84 208 | 26 546 |
a Figure from 1962. b Figures are sums of the party chapters of CDU Rheinland and Westfalen-Lippe; figure for 1960 is from 1962; figure for 1980 is from November 1979. c Figures are sums of the party chapters of SPD Mittelrhein, Niederrhein, Westliches-Westfalen, Ostwestfalen-Lippe; figures always from the last calendar day of the previous year.
With respect to party finances, the figures in Tables 3.9 and 3.10 should not be overinterpreted, as the numbers vary from year to year and are not very reliable. Parties have “considerable discretion” regarding the interpretation of column headings in their financial reports (Reference Poguntke, Boll, Katz and MairPoguntke/Boll, 1992, 319). On average, however, they show that the CDU, and in some years the FDP, received more donations than the SPD. The CDU’s parliamentary groups also employed more people. Due to the SPD’s strong membership base and stable election results, its financial resources were nonetheless not much smaller.
Table 3.9 Numbers of paid staff of West German parties over time
| Year | CDU | SPD | FDP | ||||||
|---|---|---|---|---|---|---|---|---|---|
| Central | Subnational | Parliamentary | Central | Subnational | Parliamentary | Central | Subnational | Parliamentary | |
| 1962–3 | 224 | 288 | |||||||
| 1970 | 150 | 344 | 282 | 37 | |||||
| 1975 | 229 | 434 | 330 | 334 | 92 | ||||
| 1980 | 218 | 256a | 651 | 67 | 348 | 567 | 105 | ||
a Figure from 1982.
Note: Figures include part-time and full-time positions in the central and subnational administrations and the parliamentary groups of the parties.
Table 3.10 Income of party head offices in West Germany over time (in deutsche marks)
| Years | CDU | |||
|---|---|---|---|---|
| Income from members, MPs, and office holdersb | State subvention a | Donations | Other | |
| 1960 | 2 180 000 | |||
| 1970 | 2 324 785 | 2 657 574 | 2 644 748 | 12 |
| 1975 | 7 934 605 | 15 245 339 | 6 139 106 | 0 |
| 1980 | 10 358 376 | 18 202 951 | 11 365 298 | 0 |
| Years | SPD | |||
|---|---|---|---|---|
| Income from members, MPs, and office holdersc | State subventiona | Donations | Other | |
| 1960 | 3 644 895 | 1 127 979 | 38 340 | 196 668 |
| 1970 | 4 672 499 | 4 148 133 | 1 719 069 | 0 |
| 1975 | 7 301 798 | 23 366 687 | 5 626 055 | 0 |
| 1980 | 10 843 156 | 27 232 888 | 943 856 | 0 |
| Years | FDP | |||
|---|---|---|---|---|
| Income from members, MPs, and office holdersd | State subventiona | Donations | Other | |
| 1960 | 410 000 | |||
| 1970 | 1 028 | 560 819 | 1 014 656 | 213 596 |
| 1975 | 2 445 | 4 258 316 | 4 736 834 | 23 430 |
| 1980 | 8 839 | 9 097 138 | 4 125 650 | 299 153 |
a 1960: direct state subsidies to parties; from 1967 to 1983 only elections subsidies. b Income of central party from membership fees and assignments from office holders of central party, federal ancillary organizations, lower-level organizations. c 1960: transfers from regional organizations, special transfers, assignments from office holders; 1970/75/80 income of central party from membership fees and assignments from office holders. d Only membership fees from FDP members living abroad. No assignments from office holders.
Teachers’ Organizations
Teachers in West Germany, and NRW, belonged to many different organizations. One of the most important was the Education and Science Workers’ Union (Gewerkschaft Erziehung und Wissenschaft, GEW), founded in 1948. Historically, it had its roots in the largest organization of primary schoolteachers during the nineteenth and early twentieth century, the Deutscher Lehrerverein (DLV), founded in 1871. The union was open to anyone working in the education system. In 1970, 23 percent of the members were primary schoolteachers and 49 percent were Hauptschule teachers. The Hauptschule had been turned into a separate lower-secondary school based on the former upper stage of the Volksschule. Eleven percent were teachers at a Realschule, 6 percent were teachers at a special school, 4 percent were Gymnasium teachers, and 3 percent were university staff (Reference KörfgenKörfgen, 1986, 186). Like its predecessor, the DLV, the Education and Science Workers’ Union was nondenominational, but in 1970, three-quarters of the members were Protestants and 16 percent Catholics. Most members worked in large or small cities, with only 21 percent in rural areas (Reference KopitzschKopitzsch, 1983, 295; Reference KörfgenKörfgen, 1986, 186). It was the only teachers’ organization that was affiliated with the DGB.
Primary schoolteachers had long been divided based on denomination and gender, as Catholic teachers and female teachers had founded separate, large organizations. Protestant teachers also sometimes founded separate organizations, but these were much smaller and less influential than the Catholic teachers’ associations, especially in Prussia (Reference Pöggeler and HeinemannPöggeler, 1977). In 1889, the Catholic Teachers’ Association (Katholischer Lehrerverband) was founded in Bochum (Reference BöllingBölling, 1978, 33ff; Reference TymisterTymister, 1965). In 1890, female Catholic teachers founded the Association of German Catholic Female Teachers (Verein katholischer deutscher Lehrerinnen, VkdL), which still exists today (Reference TymisterTymister, 1965, 141ff). The VkdL organized mainly Volksschule teachers but cooperated with smaller Catholic female teachers’ organizations for secondary schoolteachers (Reference SackSack, 1998, 122). The Allgemeiner Deutscher Lehrerinnenverein was also founded in 1890, a nondenominational organization of female teachers of all school types dominated by Protestant liberal women that was not reestablished after the Second World War (Reference Herrlitz, Hopf and TitzeHerrlitz et al., 2009, 92). Female primary schoolteachers more often stemmed from the upper class, while male primary schoolteachers were recruited mainly from the rural middle and lower classes (Reference BöllingBölling 1983, 78, 95ff).
After the Second World War, Catholic and Protestant Volksschule teachers refounded their organizations (the Verband der Katholischen Lehrerschaft Deutschlands, VKLD, and the Bund Evangelischer Lehrer). The Bund Evangelischer Lehrer was much smaller than the VKLD. From 1958, these organizations cooperated in the elections for the employee boards at the municipal and federal state level that had been introduced by the NRW government. In 1958, their lists received around 55 percent of the votes, with around 44 percent for the Education and Science Workers’ Union (Reference Groß-Albenhausen, Hitpaß, Franke, Kittler and StüberGroß-Albenhausen/Hitpaß, 1993, 85). In 1970, these organizations merged, forming the Association of Education and Upbringing (Verband Bildung und Erziehung, VBE). In the 1970s, the Association of Education and Upbringing continued to be the most successful teachers’ association in most of the federal employee board elections (Hauptpersonalratswahlen) on the primary school and Hauptschule level, though the competition with the Education and Science Workers’ Union was close (Verband Bildung und Erziehung, 1980, 111ff).
University-educated teachers at higher secondary schools (from 1955 all called Gymnasien) organized in the Association of Philologists, founded as Vereinsverband akademisch gebildeter Lehrer Deutschland in 1903, renamed Deutscher Philologenverband (DPhV) in 1921 and refounded in 1947. They were well-paid higher civil servants and belonged to the educated upper class (Reference BöllingBölling, 1983, 20ff). They were allied with the smaller and politically less significant Association of German Lower Secondary Schoolteachers (Verband Deutscher Realschullehrer).
Unfortunately, data on the financial resources of German teachers’ organizations could not be obtained. Membership numbers were also difficult to come by. In NRW, the Education and Science Workers’ Union was clearly the largest teachers’ organization (Table 3.11). In 1960, the union had around 81 000 members nationally and it grew to around 120 000 members in 1970 and to 192 962 members in 1979 (Reference KopitzschKopitzsch, 1983, 295; GEW NRW, 1980, 53). NRW members made up 19 percent of the national membership, which is lower than could be expected considering that NRW comprised around one-third of the West German population (Reference KopitzschKopitzsch, 1983, 295; Reference KörfgenKörfgen, 1986, 186). It is possible that this is related to the low number of Catholic teachers in the union, who presumably preferred the Association of Education and Upbringing.
Table 3.11 Membership numbers of the main teachers’ organizations in North Rhine–Westphalia, 1960–80
| Year | Education and Science Workers’ Union, NRW | Association of Philologists, NRW | Association of Education and Upbringing, NRW |
|---|---|---|---|
| 1960 | 13 855 | ||
| 1970 | 22 416 | ||
| 1975 | 29 901 | 9 284 | |
| 1976 | 33 206 | ||
| 1980 | 4 334 | 12 764 |
The Association of Education and Upbringing and its Catholic predecessor VKLD had significantly more members than the Association of Philologists. On the national level, Reference Pöggeler and HeinemannPöggeler (1977, 367) estimates that the male and female Catholic teachers’ associations together had about 60 000 members in 1960, while the Association of Philologists had about 22 000. The exact membership numbers of the Association of Philologists were not published. Reference RösnerRösner (1981, 136) estimates that the NRW section had about 11 000 members in 1977. Several interviewed experts believed that the actual membership number was significantly lower and that the Association of Philologists kept this secret for political reasons. According to the current staff of the Association of Philologists in NRW, the NRW section had 4 334 members in 1980 (Table 3.11). This low number might confirm experts’ suspicions.
All teachers’ organizations were formally independent of party politics. The Education and Science Workers’ Union was nonetheless closely connected to the SPD. A poll of members revealed in 1970 that 62 percent of the respondents considered the SPD to be the most “likable” party, compared to 16 percent that preferred the CDU/CSU and 7 percent that preferred the FDP (Reference KopitzschKopitzsch, 1983, 296; Reference KörfgenKörfgen, 1986, 187). There were also currents of communist and socialist groupings in the union, who opposed the SPD’s politics but also each other’s standpoints. These internal divisions characterized and weakened the union (see Chapter 5).
The Association of Philologists and the Association of Education and Upbringing were both affiliated with the Association of Public Employees (Deutscher Beamtenbund), a federation of non–social democratic public employees’ organizations. The Association of Public Employees mostly refrained from taking part in the school debates because the differences of opinion between its teachers’ organizations were so great. The Association of Philologists was politically closest to the CDU which should not be taken to mean that the association was always content with the CDU’s politics. The interviewed experts all agreed that the Association of Philologists was a representative of “societal power” (Anke Brunn, SPD politician) that organized the “leading people” (Jürgen Hinrichs, former FDP politician).
Due to its Catholic roots, the Association of Education and Upbringing was originally also closely connected to the CDU but it harbored SPD politicians too, such as NRW’s minister of education from 1966 to 1970, Fritz Holthoff. Over time, the Association of Education and Upbringing emancipated itself increasingly from the CDU. The former CDU politician Wilhelm Lenz, who was also managing director of the Association of Public Employees in NRW (Deutscher Beamtenbund NRW) from 1953 to 1984, made some interesting remarks with respect to the teachers’ organizations’ relations with the parties. In his view, the Association of Education and Upbringing played a similar role for the CDU as the Education and Science Workers’ Union played for the SPD:
The Education and Science Workers’ Union influenced the SPD but within the SPD it wasn’t that well liked. “Those are nutjobs” and so forth. For us that was at times the Association of Education and Upbringing. However – how should I put this? – [they did] more objective work. And you could talk to them.
Most interviewed experts perceived the Education and Science Workers’ Union and the Association of Philologists as ideological antipoles, while the Association of Education and Upbringing was considered more moderate.
Other Actors
A few other actors should be mentioned. The Organization Comprehensive School (Gemeinnützige Gesellschaft Gesamtschule) was founded in 1969 in Dortmund, NRW, as a network of reform-oriented teachers, parents, social scientists, and politicians. In 1972, it merged with the NRW Working Group for Comprehensive Schooling (Arbeitskreis Gesamtschulen in Nordrhein-Westfalen) and subsequently developed regional chapters in all federal states. By 1980, it had around 4 000 members (Reference LohmannLohmann, 2016, 2).
On the national level, reform-oriented social scientists, pedagogues, and politicians exchanged opinions through the German Educational Council (Deutscher Bildungsrat), founded in 1965. In 1970, an administrative Commission for Educational Planning comprising representatives of the national and federal governments was created to coordinate German education politics (Bund-Länder-Kommission für Bildungsplanung, 1973).
Parents’ associations played a role, not least within the NRW movement against the cooperative school. In terms of financial resources, this movement was well endowed with funds it received from the CDU. Employers’ organizations and the chambers of commerce were engaged in education politics, but more in vocational than in general education. For the upper-secondary level, employers opposed the integration of the upper grades of the Gymnasium with vocational schools. They were not among the most involved actors in the debates about comprehensive lower-secondary schooling. The Catholic and the Protestant Church influenced education politics in NRW to a higher degree than today but were most engaged in the debates about denominational schooling.
Comparison: Playing Fields in Postwar Education Politics
Overall, the Norwegian and North Rhine–Westphalian political playing fields were clearly similar, yet there are also some important differences (Table 3.12). In Norway, the political center played a more important and complex role. The Liberal Party, the Center Party, and the Christian Democrats were based primarily on the center-periphery, the rural-urban, and the state-church cleavage, respectively. However, all three center parties were anchored in the rural periphery and struggled for votes from rural, religious, working- and middle-class groups.
Table 3.12 Overview of most relevant actors in education politics, 1950s–1970s
For both the Labor Party and the Conservative Party, alliances with the center were a precondition for successful policymaking. The Labor Party was based primarily on the class cleavage but became a cross-class party over time, including sections of the rural and urban working- and middle-class population. It represented the periphery in center-periphery conflicts. Norway’s Conservative Party, on the other hand, was an urban middle- and upper-class party, which organized few workers compared to the German CDU and to other Norwegian parties, and was weak in rural areas. It represented the interests of higher civil servants, especially in the political center Oslo. The conservatives were socially far removed from the members and voters of the center parties. Rather than within the Conservative Party, Christian workers and farmers more often organized themselves in the party of the Norwegian Christian Democrats. The membership of the Center Party and the Norwegian Liberal Party was also quite diverse in terms of class background.
In Germany, the FDP also played an important role as “kingmaker” for both the social and the Christian democrats. But the social profile of the FDP was more dominated by upper-class groups than that of the political center in Norway. The SPD gave organizational expression to the class cleavage and was strong among workers but not very successful in rural areas. The CDU represented the interests of parts of the upper class but was also a cross-class party. Many of the social groups organized by the center parties in Norway were found within the ranks of the CDU in Germany. This is true of farmers and the rural population, people with a strong Christian identity, including women, and other sections of the middle classes. German social democrats and liberals also attempted to organize these groups, but they did it less successfully than the CDU. This is due to the high salience of the state-church cleavage. In state-church conflicts, the CDU represented the interests of the Catholic Church and the Catholic population, including Catholic workers, and of conservative Protestants, while the FDP and the SPD stood for the secularization of the state, including the education system.
In terms of power resources, both social democratic parties were strong, but the election results of the Norwegian Labor Party were more impressive. It governed for the most part through minority governments, which implies that coalition-making on single issues was important. In NRW and Germany as a whole, the balance of power between the social democrats and Christian democrats was not as clear, but overall the CDU was more influential. In NRW, this was especially true in the 1950s and early 1960s. From 1966, NRW turned into a “red” federal state, and from this point on social democrats had a greater chance of putting their political agenda into practice in a coalition with the FDP.
The parties of the political right received more donations than their social democratic opponents in both countries and had significant financial resources. However, financial resources and membership numbers were apparently not the most important determinants of political power. The Norwegian Conservative Party had many members and was well endowed with funds, but the electoral successes of the social democrats illustrate that ideological hegemony was more on their side. On the other hand, the German and North Rhine–Westphalian social democrats had significant incomes due to their high membership numbers. The fact that they did not manage to achieve a compromise more favorable to their program in education politics can therefore not be explained by a lack of financial resources.
Among the teachers’ organizations, the German Association of Philologists and the Association of Norwegian Secondary Schoolteachers (Norsk Lektorlag) both represented teachers with comparatively high social backgrounds. They were smaller than the other teachers’ organizations, but well connected with the parties of the political right. The politically influential German Association of Philologists had surprisingly few members.
The major difference regarding teachers’ organizational structures can be found among the organizations of primary schoolteachers (the former Volksschule/folkeskole teachers). These teachers were organizationally more united in Norway. In Germany, they were split into several organizations along the state-church cleavage. In Norway, the division of primary schoolteachers based on gender was an expression not only of the gender cleavage but also of urban-rural and class cleavages, since female teachers had more urban, upper-class backgrounds. However, this split was overcome in 1966. Groups of communist teachers could be found in the teachers’ organizations of both countries. However, the communist-socialist cleavage was much more salient within the German Education and Science Workers’ Union.
In conclusion, the distribution of power resources between all these political actors was clearly politically relevant. In Norway, the political left and primary schoolteachers were somewhat more powerful, which presumably facilitated comprehensive school reform attempts. However, the differences were not so overwhelming as to preclude any alternative political outcomes. More importantly, the distribution of power resources should be considered partly a result of successful political coalition-making, rather than a potential explanation for such coalitions. It cannot tell us anything about how Norwegian social democrats managed to become a cross-class party and to build cross-interest coalitions with the parties of the political center or how the CDU managed to uphold its intra-party cross-interest coalition in education politics. Or, to put it differently, power resources alone cannot explain why similar social groups turned into consenters to comprehensive schooling in the Norwegian case, but into antagonists in the German case. We must therefore explore the political processes, including the ideological expressions of cleavages and actors’ attempts at coalition-making, in detail.


 Open access