


Implications
The practice of evaluating animals for both feed intake and feed efficiency indoors on concentrate-based diets may not reflect their phenotypic performance when consuming conserved forage-based diets indoors or when grazing pasture.
Introduction
A high proportion of farm income on beef enterprises comes from financial support as opposed to profitable production (Dillon et al., Reference Dillon, Moran, Lennon and Donnellan2018). Animals that efficiently convert feed to product can improve the profitability of beef enterprises, as well as reduce the environmental footprint of beef production (Basarab et al., Reference Basarab, Beauchemin, Baron, Ominski, Guan, Miller and Crowley2013; Berry and Crowley, Reference Berry and Crowley2013). Worldwide, breeding values for feed intake and feed efficiency in beef cattle are generally derived indoors on high-concentrate (HC) diets (Kenny et al., Reference Kenny, Fitzsimons, Waters and McGee2018), as is the case in Ireland for the national ‘Terminal Index’, a breeding index for growing and finishing cattle (ICBF, 2019). Within temperate regions of north-western Europe, however, climatic conditions allow for the majority of a beef animals lifetime dietary intake to come from grazed grass (Drennan and McGee, Reference Drennan and McGee2009; O’Donovan et al., Reference O’Donovan, Lewis and O’Kiely2011). Grass is the cheapest feed available when compared with grass silage and concentrates (Finneran et al., Reference Finneran, Crosson, O’Kiely, Shalloo, Forristal and Wallace2012) and is Irelands competitive advantage when producing beef (O’Donovan et al., Reference O’Donovan, Lewis and O’Kiely2011). Due to the seasonality of grass growth, periods of housing are necessary where cattle are managed differently depending on age and the production system operated; young growing animals are typically offered grass silage plus restricted amounts of concentrates to take advantage of compensatory growth the following season at pasture (Drennan and McGee, Reference Drennan and McGee2009). In contrast, animals approaching slaughter may be offered a HC diet during a ‘finishing’ phase to achieve adequate carcass fat cover (O’Riordan et al., Reference O’Riordan, Crosson and McGee2011). Therefore, the success of beef production systems in temperate regions is reliant on identifying and breeding cattle that can efficiently convert feed to saleable meat across an assortment of diets.
Previous studies using beef cattle indoors have demonstrated that rankings for feed intake and feed efficiency can change when animals are offered conserved forage-based diets followed by energy-dense diets (Clarke et al., Reference Clarke, Drennan, McGee, Kenny, Evans and Berry2009; Cassady et al., Reference Cassady, Felix, Beever and Shike2016), and even when offered different forage types, such as grass silage and zero-grazed grass (Coyle et al., Reference Coyle, Fitzsimons, Kenny, Kelly and McGee2016b). Feed consumption is more complex under grazing conditions as animals must autonomously harvest pasture, varying in supply and nutritive value, to meet their nutrient requirements for maintenance and growth (Gregorini et al., Reference Gregorini, Gunter, Beck, Soder and Tamminga2008). Consequently, under grazing conditions ingestive behaviours become more significant (Gregorini et al., Reference Gregorini, Gunter, Beck, Soder and Tamminga2008) and may result in an increase in energy expenditure towards non-productive functions (Cantalapiedra-Hijar et al., Reference Cantalapiedra-Hijar, Abo-Ismail, Carstens, Guan, Hegarty, Kenny, McGee, Plastow, Relling and Ortigues-Marty2018). Inconsistencies were found across the limited number of studies that have evaluated feed efficiency of beef cattle at pasture, whereby herbage intake of animals previously classified as divergent for feed efficiency (residual feed intake (RFI)) indoors on forage-based diets remained (Manafiazar et al., Reference Manafiazar, Basarab, Baron, McKeown, Doce, Swift, Undi, Wittenberg and Ominski2015) or was not (Lawrence et al., Reference Lawrence, Kenny, Earley and McGee2012) significantly different under in situ grazing conditions. Further research is required to evaluate the relevance of evaluating beef cattle for feed intake and feed efficiency on HC diets relative to grass silage-based diets and grazed pasture.
The objective of the current study was to determine the repeatability of feed intake and feed efficiency of growing cattle indoors on a HC diet relative to grass silage and pasture-based diets. Also, of interest was the relationship between grazing and rumination behaviour with feed intake and feed efficiency.
Material and methods
Ninety-seven animals were used in the current study, of which 47 were heifers and 50 were steers. The animals were the progeny of a spring-calving suckler herd as described by McCabe et al. (Reference McCabe, McHugh, O’Connell and Prendiville2019). The progeny were sired by nine Limousin and nine Aberdeen Angus sires bred to four dam breed types: Limousin, Aberdeen Angus, Limousin × Holstein-Friesian and Aberdeen Angus × Holstein-Friesian. The sires used were representative of those used on the Irish beef cattle population. The mean birth date of the animals was 13 March 2016 (SD 25.7 days). Prior to commencing the current study, calves were single-suckled and rotationally grazed with their dams on perennial ryegrass-dominated (Lolium perenne L.) pasture from early April to weaning on 26 October 2016. Male calves were castrated in mid-August.
After weaning, all animals underwent three test periods for feed efficiency: (1) indoors, offered grass silage and restricted amounts of concentrates at Teagasc, Grange, Dunsany, Co. Meath, Ireland; (2) outdoors while grazing pasture at Teagasc, Johnstown Castle, Co. Wexford, Ireland and (3) indoors, offered a concentrate-based diet at the Irish Cattle Breeding Federation (ICBF), Gene Ireland, progeny test centre, Tully, Co. Kildare, Ireland.
Test period one: grass silage plus restricted concentrate supplementation
Following weaning, calves were accommodated indoors in slatted floor pens, each containing seven animals (2.9 m2/animal); pens were balanced for sex and BW. Animals were individually offered grass silage ad libitum and 2 kg of concentrate on a fresh weight basis (composition: rolled barley, 865 g/kg; soya bean meal (de-hulled), 60 g/kg; molasses, 50 g/kg; minerals and vitamins, 25 g/kg) through electronically controlled Calan gates (American Calan Inc., Northwood, NH, USA). Animals were given an initial adaption period of 14-days to acclimatize to their environment and diet before recording individual DM intake (DMI) over an 80-day test period (mid-December 2016 to early-March 2017) similar to that described by Lawrence et al. (Reference Lawrence, Kenny, Earley and McGee2012). All animals had continuous access to clean, fresh water. Silage and concentrates were offered once daily (at 0800 h). Silage was offered based on approximately 1.1 times the intake of the previous day. Samples of the offered and refused silage, and concentrate were taken twice weekly and stored at −20°C pending laboratory analysis. Sample processing, DM determination and analysis of in vitro DM digestibility of the silage, CP, NDF and ash of the silage and concentrate samples were as described by Lenehan et al. (Reference Lenehan, Moloney, O’Riordan, Kelly and McGee2017). Body weight of each animal was recorded once at the beginning and end of the measurement period and every 21 days in between. From herein, this test period shall be referred to as the silage plus concentrate (S+C) period.
Test period two: grazed pasture
Animals were transported to Teagasc, Johnstown Castle in late March 2017 and rotationally grazed on perennial ryegrass-dominated pasture as described by Lawrence et al. (Reference Lawrence, Kenny, Earley and McGee2012). The test period was conducted over 103 days (mid-May to late-August 2017). Individual DMI was estimated once during this period in mid-July using the n-alkane technique (Mayes et al., Reference Mayes, Lamb and Colgrove1986). During the intake estimation period, animals were assigned to two groups based on sex. Animals were dosed once daily for a 12-day period using paper pellets containing 500 mg C32-alkane (n-dotriacontane) each. Individual faecal samples were collected on days 7 to 12 at approximately 0700 and 1500 h. These samples were subsequently bulked per animal on a fresh weight basis (12 g per sample) and oven dried at 40°C prior to being milled using a 1 mm sieve. Herbage representative of that grazed by the animals was sampled on days 6 to 11 of the estimation period using electronic shears. The ratio of naturally occurring C33-alkane (tritriacontane) in the herbage to dosed C32-alkane was used to calculate the intake. Pre- and post-grazing sward heights were recorded using a rising plate meter (Jenquip, New Zealand) during the intake estimation period. Sample processing, analysis of in vitro organic matter digestibility, CP, NDF and ash of the herbage sampled during the intake estimation period were determined as described by O’Connor et al. (Reference O’Connor, Moloney, O’Kiely, Boland and McGee2019). Animal BW was recorded once at the beginning and end of the test period and every 21 days in between. From herein, this test period shall be referred to as the grazing (GRZ) period.
Grazing behaviour was recorded over a 22-h period during the herbage DMI estimation period using the RumiWatchSystem (Itin + Hoch GmbH, Liestal, Switzerland), a grazing behaviour recording device validated by Werner et al. (Reference Werner, Leso, Umstatter, Niederhauser, Kennedy, Geoghegan, Shalloo, Schick and O’Brien2017). Animals were fitted with RumiWatch halters at approximately 0900 h and these were removed 22 h later. The automatically captured data were downloaded to the RumiWatch Manager 2 (V.2.1.0.0) and subsequently analysed using the RumiWatch Convertor (RWC) software (V.0.7.3.36) as described by Werner et al. (Reference Werner, Leso, Umstatter, Niederhauser, Kennedy, Geoghegan, Shalloo, Schick and O’Brien2017). The RWC created 10 min summaries of the data which were categorized into different focal behaviour parameters including grazing time, grazing bouts, grazing bout duration, number of bites, bite rate, ruminating time, ruminating bouts, ruminating bout duration, ruminating mastications, ruminating mastication rate, number of ruminating boli and ruminating boli per ruminating bout. Rate of DMI and DMI/grazing bout was calculated as: (DMI × 1000)/grazing time and DMI/grazing bouts, respectively. Grazing behaviour records for 70 animals were available for the final analysis.
Test period three: high concentrate
At the end of the grazing season (mid-November 2017), animals were housed in a slatted floor shed and offered grass silage ad libitum and, following dietary adaptation, 4 kg concentrate per head daily (fresh weight). Subsequently (January 2018) animals were transported to the ICBF, progeny test centre. Upon arrival, they were assigned to pens which were balanced for breed, sex and BW. Pens consisted of an indoor area (7.3 m2/animal) and an outdoor area (4.5 m2/animal), which were bedded with peat moss and woodchip, respectively. There were five animals per pen. Dry matter intake was recorded over a 72-day test period (late-January to early-April 2018) for heifers, and an 81-day test period (mid-January to early-April 2018) for steers, using electronic feeders (RIC Feed-Weigh Trough; Hokofarm Group BV, Marknesse, The Netherlands) described by Kelly et al. (Reference Kelly, Murphy, Sleator, Judge, Conroy and Berry2019). Animals were pre-trained to eat from the electronic feeders and given an adaption period of 14 days before measurement of DMI commenced. Animals were offered a HC total mixed ration (TMR) ad libitum (1.1 times the weight of the intake of the previous day). The TMR consisted of 3 kg of hay, 10 kg of concentrates (composition: maize grain, 270 g/kg; soya bean hulls, 140 g/kg; barley, 262 g/kg; dried distillers grains, 91 g/kg; maize gluten feed 76 g/kg; soya bean meal 30 g/kg; rape extract 27 g/kg; vegetable oil, 6 g/kg; minerals and vitamins, 38 g/kg) and 9 kg of water on a fresh weight basis. The dietary ingredients were mixed and dispensed using a feeding wagon (Keenan; Borris, Co. Carlow, Ireland) twice daily – 0900 to 1230 h and 1400 to 1700 h – from Monday to Friday. On Saturday and Sunday, the TMR was also dispensed twice daily but between 0900 and 1230 h. Samples of the offered and refused TMR were taken twice weekly and stored at −20°C pending laboratory analysis. Sample processing, DM determination and analysis of CP, NDF and ash of the TMR samples was as described by Kelly et al. (Reference Kelly, McGee, Crews, Fahey, Wylie and Kenny2010). Feeding behaviour traits were evaluated using the attendance data from the electronic feeding bins. The number of daily feeding visits was calculated based on the number of times an animal entered the feed bin and consumed a minimum of 100 g of feed. Daily feeding time was calculated as the time taken to consume the recorded intake per day. Feeding visit duration, DMI rate and DMI/feeding visit were subsequently calculated as: feeding time/number of feeding visits; (DMI × 1000)/feeding time and DMI/feeding visits, respectively. The BW of each animal was recorded on two consecutive days at the beginning and end of the measurement period and every 26 days in between. From herein, this test period shall be referred to as the HC period.
Breeding values for feed intake
The predicted transmitting ability (PTA) value for feed intake (daily DMI) for each individual animal in the study, excluding their own performance, was acquired from the ICBF national database. The mean PTA (SD) value for feed intake was −0.07 (0.26), and the mean reliability of the PTA values was 39% with a range from 34% to 43%.
Performance traits
Average daily gain (ADG) was calculated for each animal during each test period as the linear regression coefficient from the regression of BW on days on test. Individual mid-test BW was determined using the linear regression coefficients for ADG from each animal within the three test periods. Individual mid-test metabolic BW (MBW) was defined as BW0˙75. Gain to feed ratio (G : F) was calculated by dividing the ADG during each test period by the average DMI. Dry matter intake relative to BW (DMI/BW) was calculated within each period as DMI kg/BW kg. Residual feed intake was calculated for each animal as the difference between actual DMI and expected DMI. For each test period, expected DMI was computed for each animal using a multiple regression model, regressing DMI on MBW and ADG, while adjusting for breed group and sex. The R 2 from these models was 0.58, 0.30 and 0.47 for the S+C, GRZ and HC periods, respectively.
Statistical analysis
Data were assessed for normality using PROC UNIVARIATE in SAS 9.4 (SAS Institute Inc., Cary, NC, USA). The level of re-ranking among individuals for MBW, ADG, DMI, G : F, DMI/BW and RFI across the three test periods was undertaken using partial Spearman’s rank correlations using PROC CORR in SAS, while adjusting for breed group, age and sex. Animals were also divided into three equally sized groups based on their ranking for feed intake, ADG and the feed efficiency traits within each test period and classified as high, medium and low. The proportion of animals that changed classification for each trait between the three test periods was compared against the proportion that maintained their respective classification using a χ2 test through PROC FREQ in SAS.
The relationship between phenotypic feed intake performance in each of the individual test periods and genetic potential for intake was investigated by regressing the phenotypic performance of DMI against the PTA for feed intake using PROC GLM in SAS. All models included fixed effects of age and sex. Breed group was not included in this analysis as genetic evaluations in Ireland are evaluated and presented across breeds (Clarke et al., Reference Clarke, Drennan, McGee, Kenny, Evans and Berry2009).
The relationship between grazing time, DMI rate, number of grazing bouts, grazing bout duration and DMI/grazing bout in the GRZ period with total time spent at the feeder, DMI rate, number of feeding visits, feeding visit duration and DMI / feeding visit in the HC period, respectively, was conducted using partial Spearman’s rank correlations, while adjusting for breed group, age and sex. Associations between grazing and rumination behaviour in the GRZ period with ADG, DMI, G : F, DMI/BW and RFI, and similarly associations between feeding behaviour in the HC period with ADG, DMI, G : F, DMI/BW and RFI were conducted using partial Spearman’s rank correlations, while adjusting for breed group, age and sex.
Correlations were considered ‘strong’ where values were equal to or greater than 0.60, ‘moderate’ where values were between 0.30 and 0.59 and ‘weak’ where values were equal to or less than 0.29.
Results
The chemical composition of the feedstuffs offered for the three test periods is presented in Table 1. Pre- and post-grazing sward heights during DMI estimation in the GRZ period were 11.1 (SD = 1.36) and 5.5 cm (SD = 0.67), respectively. Descriptive statistics of the phenotypic values of the animals across the three test periods are presented in Table 2. Commencing the S+C period, animals were approximately 9 months of age with an initial mean BW of 276 kg, and by the start of the final (HC) test period they were approximately 22 months of age with a mean weight of 678 kg. Mean G : F was 0.104, 0.108 and 0.096 kg of BW gain/kg DMI for the S+C, GRZ and HC periods, respectively; corresponding ranges were 0.02 to 0.16, 0.06 to 0.24, 0.05 to 0.14. Residual feed intake averaged 0.00 kg DM/day and ranged from −1.04 to 1.06, −3.86 to 2.85 and −4.39 to 5.07, for the S+C, GRZ and HC periods, respectively.
Table 1 Mean (SD) chemical composition of feeds offered to the cattle across the three test periods
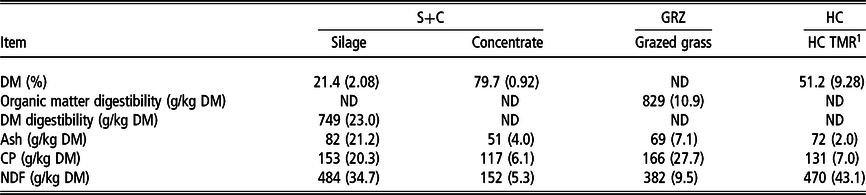
S+C = grass silage plus concentrate; GRZ = grazed grass; HC = high concentrate; TMR = total mixed ration, ND = not determined.
1 TMR consisting of 3 kg hay, 10 kg concentrates and 9 kg water on a fresh weight basis.
Table 2 Phenotypic values (SD) for cattle across the three test periods
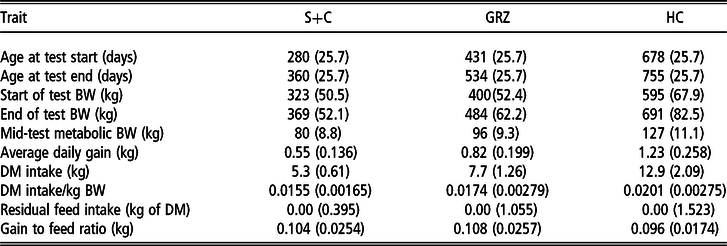
S+C = grass silage plus concentrate; GRZ = grazed grass; HC = high concentrate.
Performance, feed intake and feed efficiency re-ranking
Spearman’s rank correlation coefficients for growth performance, feed intake and feed efficiency traits between the three feed test periods are presented in Table 3. A strong positive correlation (P < 0.001) was observed for MBW between all the test periods. There were moderate positive correlations for DMI between the S+C and GRZ periods (P < 0.01), as well as the S+C and HC periods (P < 0.001), whereas DMI was not repeatable (P > 0.10) between the GRZ and HC periods. When expressed relative to weight, there was a moderate positive correlation for DMI between the S+C and GRZ periods (P < 0.01) as well as between the S+C and HC periods (P < 0.001), respectively, but there was no association for the trait between the GRZ and HC periods. Average daily gain was not repeatable (P > 0.10) between the S+C and GRZ periods or the S+C and HC periods, but there was a tendency towards a weak positive relationship (P < 0.10) for ADG between the GRZ and HC periods. For RFI, there were weak positive correlations between the GRZ and S+C periods (P < 0.05) as well as between the S+C and HC periods (P < 0.05), whereas no statistically significant relationship was found between the GRZ and HC periods. There was no association (P > 0.10) for G : F between any of the test periods, with correlations close to zero observed.
Table 3 Spearman’s rank correlations for performance, feed intake and feed efficiency traits in cattle between the three test periods
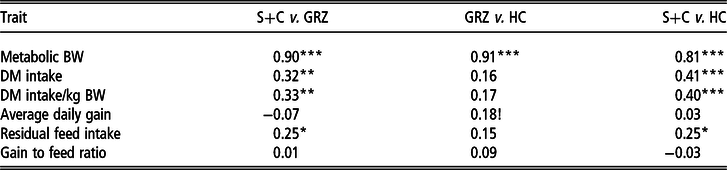
Correlation coefficients are different from zero; !P < 0.10; *P < 0.05; **P < 0.01; ***P < 0.001.
S+C =grass silage plus concentrate; GRZ = grazed grass; HC = high concentrate.
The percentage of animals that changed or maintained growth performance, feed intake and feed efficiency classes between the test periods is presented in Table 4. Approximately 45% of animals maintained their DMI classification between the S+C and GRZ periods, and the GRZ and HC periods, whereas this increased to 57% for the S+C and HC periods. In contrast, when expressed relative to weight, 49% of animals maintained their DMI classification between the S+C and GRZ periods, whereas only approximately 42% maintained classification between the GRZ and HC periods, and the S+C and HC periods. The percentage of animals that maintained ranks for ADG was relatively constant across all three test periods, ranging from 37% to 42%. For G : F, the percentage maintaining rank ranged from 30% to 42% with 17% to 26% changing two classes across the three test periods. In contrast, for RFI, 37% to 45% of animals maintained their classification and only 14% to 18% changed two classes across the three test periods.
Table 4 Percentage of cattle that maintained or changed feed intake, growth and feed efficiency class1 between periods
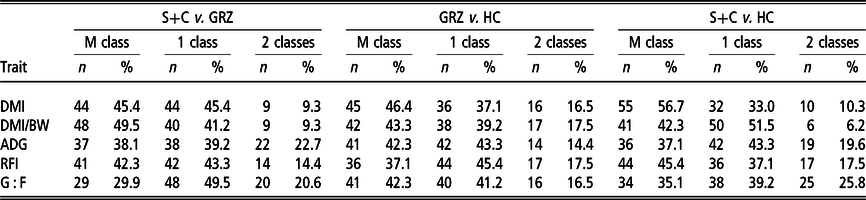
S+C = grass silage plus concentrate; GRZ = grazed grass; HC = high concentrate; ADG = average daily gain; DMI = DM intake; DMI/BW = DMI/kg of BW; RFI = residual feed intake; G : F = gain to feed ratio.
1 Three classes: low (bottom 33%); medium (middle 33%); high (top 33%); M class = maintained class; 1 class = changed one class; 2 classes = changed two classes.
Relationship between phenotypic dry matter intake and animal’s predicted transmitting ability for dry matter intake
The linear regression of phenotypic DMI across the three test periods on PTA values for feed intake showed a 0.51 (SE = 0.19; P = 0.01), 0.42 (SE = 0.49; P = 0.39) and 3.26 (SE = 0.73; P = <0.001) kg increase in DMI per increment increase in PTA value for the S+C, GRZ and HC test periods, respectively.
Relationship between grazing behaviour and indoor feeding behaviour
Descriptive statistics of the phenotypic values for feeding behaviour are presented in Table 5. Animals spent approximately 8 h grazing and 7 h ruminating in the GRZ period, whereas they spent approximately 2 h feeding in the HC period.
Table 5. Phenotypic values (SD) for grazing and rumination behaviour1of cattle in the grazing period and the feeding behaviour traits in the high concentrate period2
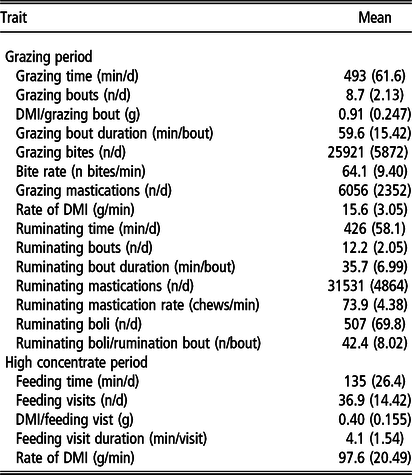
1 22 hour recording period
2 24 hour recording period
The Spearman’s rank correlations for the feeding behaviour traits between the GRZ and the HC periods showed no relationship between grazing time, grazing bouts, grazing bout duration, rate of DMI and DMI/grazing bout in the GRZ period with feeding time (r = 0.15; P = 0.22), feeding visits (r = 0.20; P = 0.12), feeding visit duration (r =0.09; P = 0.47), rate of DMI (r = 0.12; P = 0.34) and DMI/feeding visit (r = 0.02; P = 0.85) in the HC period, respectively.
Relationship between feeding behaviour and average daily gain, feed intake and feed efficiency
The Spearman’s rank correlations of intake, growth and feed efficiency measures with the feeding behaviour traits in the GRZ and HC period are presented in Table 6. Grazing time and grazing mastications were not associated (P > 0.05) with growth, feed intake or any of the feed efficiency traits. The number of grazing bouts per day, grazing bites per minute and ruminating bouts per day were positively associated with DMI, DMI/BW and RFI (r = 0.28 to 0.45; P < 0.05 - 0.001), and the number of grazing bites was positively associated with DMI and DMI/BW. The number of ruminating boli produced per day and per ruminating bout showed positive correlations with G : F (r = 0.28 and 0.26, respectively; P < 0.05). The traits, rumination time, rumination mastications and the number of rumination boli produced per day were positively correlated with ADG (r = 0.34 to 0.42; P = <0.01 - 0.001).
Table 6. Spearman’s rank correlations between grazing and rumination behaviour in the grazing period and feeding behaviour traits in the high concentrate period with average daily gain, feed intake and feed efficiency traits in cattle (n = 70)
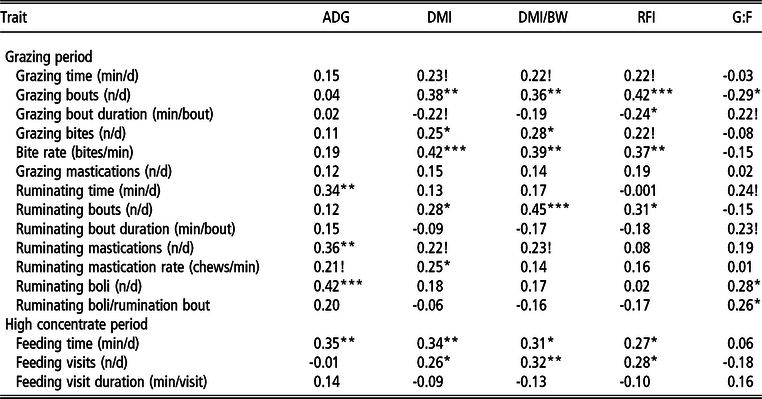
ADG = average daily gain; DMI = dry matter intake; DMI/BW = DMI/kg of body weight; RFI = residual feed intake; G:F = gain to feed ratio.
Correlation coefficients are different from zero; ! P < 0.10; *P < 0.05; **P < 0.01; ***P < 0.001
Feeding time in the HC period was positively associated with ADG, DMI, DMI/BW and RFI. The number of feeding visits per day was positively associated with DMI, DMI/BW and RFI.
Discussion
Breeding values for feed intake and feed efficiency in cattle are generally derived indoors on HC diets (Kenny et al., Reference Kenny, Fitzsimons, Waters and McGee2018); however, worldwide beef production is mainly forage-based. Within temperate regions of beef production, such as Ireland, climatic conditions allow for the majority of an animal’s lifetime dietary intake to come from grazed grass and grass silage (Drennan and McGee, Reference Drennan and McGee2009; O’Donovan et al., Reference O’Donovan, Lewis and O’Kiely2011). Therefore, breeding values for feed intake and feed efficiency derived indoors on HC diets may not be applicable to commercial grass-based beef production systems. The aim of the current study was to assess the repeatability of feed intake and feed efficiency across grass silage, pasture and HC diets. It is acknowledged that diet type is confounded with time and animal physiological age, but the experimental design reflects the dietary order and timeframe applicable in commercial practice for seasonal grass-based beef production systems using spring-born animals.
The moderate-to-weak correlations for DMI (0.41) and RFI (0.25) between the S+C and HC periods indicate that these traits are somewhat repeatable between conserved forage-based diets offered indoors during the growing phase and HC diets offered indoors during the ‘finishing’ phase. Cassady et al. (Reference Cassady, Felix, Beever and Shike2016) and Durunna et al. (Reference Durunna, Plastow, Mujibi, Grant, Mah, Basarab, Okine, Moore and Wang2011) reported higher correlations of 0.58 and 0.63 for DMI as well as 0.40 and 0.39 for RFI, respectively, between forage- and grain-based diets. Re-ranking for feed intake related traits between the diets is understandable as when animals are offered energy-dense diets, intake is largely regulated metabolically (INRA, 2018), whereas when offered forage-based diets, intake can be influenced by rumen capacity (Allen, Reference Allen1996). Independent of diet, re-ranking can occur as animals mature (Coyle et al., Reference Coyle, Fitzsimons, Kenny, Kelly and McGee2016a); hence, the higher correlations reported by both Durunna et al. (Reference Durunna, Plastow, Mujibi, Grant, Mah, Basarab, Okine, Moore and Wang2011) and Cassady et al. (Reference Cassady, Felix, Beever and Shike2016) may be partially attributed to the short duration of 2 to 3 weeks between their two test periods compared with the 46 weeks duration in the current study.
The weak and non-significant correlations for DMI and RFI between the GRZ and HC periods in combination with the proportion of animals that changed ranks clearly suggest that the performance of growing animals at pasture is not reflective of their performance indoors on HC diets during the ‘finishing’ phase. Similarly, Clarke et al. (Reference Clarke, Drennan, McGee, Kenny, Evans and Berry2009) reported a low correlation of 0.26 for DMI between grazed grass and a HC diet. Offering animals uniform HC diets allows for the expression of full potential for feed intake, performance and growth (Keane et al., Reference Keane, Drennan and Moloney2006), whereas at pasture, herbage can vary in terms of quantity and quality (Gregorini et al., Reference Gregorini, Gunter, Beck, Soder and Tamminga2008), which may limit performance. Additionally, grazing animals must have the motivation to autonomously harvest pasture that has been offered in situ (Prendiville et al., Reference Prendiville, Lewis, Pierce and Buckley2010). In contrast, Coyle et al. (Reference Coyle, Fitzsimons, Kenny, Kelly and McGee2017) reported a mean correlation of 0.49 for DMI and 0.19 for RFI, between zero-grazed grass and a HC diet offered indoors. The higher correlation for grass DMI obtained by Coyle et al. (Reference Coyle, Fitzsimons, Kenny, Kelly and McGee2017) may be attributed to the zero-grazing regime employed as this practice avoids the aforementioned challenges associated with grazing. The phenotypic values observed for the grazing behaviour traits in the GRZ period and the feeding behaviour traits in the HC period (Table 5) demonstrate the differences between grazing pasture compared with consuming HC diets indoors. Of note, is the marked contrast in daily duration of eating; approximately 8 h grazing compared with 2 h consuming the HC TMR. The weak relationships between grazing time, number of grazing bouts, grazing bout duration, DMI rate and DMI/grazing bout in the GRZ period with time spent feeding, number of feeding visits, feeding visit duration, DMI rate and DMI/feeding visit in the HC period suggest that grazing and feeding indoors are largely two different traits. McGee et al. (Reference McGee, Welch, Ramirez, Carstens, Price, Hall and HIll2014) reported feeding behaviour was relatively repeatable indoors, with moderate correlations for time spent feeding (0.47) and number of feeding bouts (0.57) across growing and finishing diets, in association with moderate correlations for both DMI (0.56) and RFI (0.50). Thus, discrepancies in grazing behaviour at pasture and feeding behaviour in confinement reflect the differences in feed intake and feed efficiency between the two environments.
The use of markers to estimate DMI at pasture opposed to directly measuring the trait (as in the S+C and HC periods) has been postulated as a potential cause for re-rankings for both feed intake and feed efficiency in beef cattle between confinement and grazing scenarios (Clarke et al., Reference Clarke, Drennan, McGee, Kenny, Evans and Berry2009; Lawrence et al., Reference Lawrence, Kenny, Earley and McGee2012). The DMI estimates using the n-alkane technique at pasture relative to live weight in the current study (17.4 g/kg) are comparable with previous research either grazing equivalent pasture (Clarke et al., Reference Clarke, Drennan, McGee, Kenny, Evans and Berry2009, 15.7 g/kg) or where the DMI of such pasture was measured under zero-grazing conditions (Coyle et al., Reference Coyle, Fitzsimons, Kenny, Kelly and McGee2017, 16.2 g/kg; O’Connor et al., Reference O’Connor, Moloney, O’Kiely, Boland and McGee2019, 17.2 g/kg). Nonetheless, alkane measurement is only conducted over 6 days, whereas feed intake measurement indoors requires at least 45 days to get an accurate measure of daily DMI (BIF, 2010). Furthermore, there is potential for inaccuracies within the n-alkane technique due to differences in digestion, recovery rate and selective grazing between animals (Dove et al., Reference Dove, Freer and Foot2000), with selective grazing being exacerbated in heterogenous sward types (Mayes and Dove, Reference Mayes and Dove2006). However, research with dairy cows has demonstrated that the repeatability of DMI estimated using alkanes (0.64) while grazing homogenous perennial ryegrass swards comparable to the current study is similar to the repeatability of DMI recorded indoors using electronic feeders (0.46 to 0.84; Berry et al., Reference Berry, Coffey, Pryce, de Haas, Løvendahl, Krattenmacher, Crowley, Wang, Spurlock, Weigel, Macdonald and Veerkamp2014).
Compared with the weak and non-significant correlations between the HC and GRZ periods, there were significant and stronger correlations for DMI (0.32) and RFI (0.25) between the S+C and GRZ periods. Similarly, Clarke et al. (Reference Clarke, Drennan, McGee, Kenny, Evans and Berry2009) reported a numerically higher correlation for DMI between grass silage and grazed grass diets (0.30) compared with grazed grass and HC diets (0.26). Likewise, in studies conducted indoors, stronger correlations were reported for both DMI and RFI between grass silage and zero-grazed grass (0.61 and 0.35, respectively; Coyle et al., Reference Coyle, Fitzsimons, Kenny, Kelly and McGee2016b) compared with zero-grazed grass and a HC diet (0.49 and 0.19, respectively; Coyle et al., Reference Coyle, Fitzsimons, Kenny, Kelly and McGee2017). This is more than likely due to the intake and digestive characteristics of the diets being more similar between forage sources (such as grass silage and fresh grass) than between forage and HC diets (INRA, 2018).
Gain to feed ratio was not repeatable across the three test periods, which agrees with previous research (Cassady et al., Reference Cassady, Felix, Beever and Shike2016; Coyle et al., Reference Coyle, Fitzsimons, Kenny, Kelly and McGee2016b, Reference Coyle, Fitzsimons, Kenny, Kelly and McGee2017). The poor repeatability of the trait across the test periods is more than likely an artefact of the different diet types, errors associated with gut-fill in combination with inter-animal variation in compensatory growth mechanisms between the differing diets and animal maturity stages. Although a useful management tool, the use of G : F in breeding programmes has been questioned, due to its strong correlation with BW, and consequently it has an adverse effect on mature animal size, and subsequently feed intake (Cantalapiedra-Hijar et al., Reference Cantalapiedra-Hijar, Abo-Ismail, Carstens, Guan, Hegarty, Kenny, McGee, Plastow, Relling and Ortigues-Marty2018). In contrast, RFI is an alternative measure of feed efficiency, which is independent of ADG and BW (Berry and Crowley, Reference Berry and Crowley2013). In agreement with Coyle et al. (Reference Coyle, Fitzsimons, Kenny, Kelly and McGee2016b, Reference Coyle, Fitzsimons, Kenny, Kelly and McGee2017) and Cassady et al. (Reference Cassady, Felix, Beever and Shike2016), RFI had stronger correlations across the differing diets compared with G : F, and therefore is a more robust trait for use in breeding indexes. Including all component traits of RFI in a breeding objective or index is equivalent to including RFI (Van der Werf, Reference Van Der Werf2004).
The Irish Terminal Index is an economically weighted genetic selection index composed of key traits of economic importance; feed intake, which is assigned a negative economic weighting, accounts for 16% of the total index (ICBF, Reference Kelly, Murphy, Sleator, Judge, Conroy and Berry2019). It is assumed that the breeding value for feed intake is applicable across the total lifetime of the animal. The significant regression coefficient between the PTA values for feed intake and DMI measured in the HC and S+C periods indicate that these breeding values have merit when animals are offered HC diets or grass silage plus supplementary concentrates indoors. However, the corresponding relationship for DMI estimated at pasture was non-significant. Considering the majority of the annual feed budget for growing cattle in Ireland comprises of grazed grass (O’Donovan et al., Reference O’Donovan, Lewis and O’Kiely2011), this is of concern. It is acknowledged that the discrepancy between these findings may be partly related to the aforementioned challenges associated with accurately quantifying grazed herbage consumption. The stronger correlation for DMI between the S+C and GRZ periods compared with the HC and GRZ periods suggests more accurate PTA values may be derived from testing animals on forage-based diets such as grass silage as a compromise to recording DMI at pasture. Further research using a more comprehensive data set including multiple records of feed intake and feed efficiency in grazing cattle over the course of a grazing season is warranted to confirm the findings of the current study.
An alternative to the direct measurement of feed intake or feed efficiency is to identify correlated traits (Berry and Crowley, Reference Berry and Crowley2013). The traits pertaining to feeding, grazing and rumination behaviour in the current study may be useful indicator traits for feed intake and feed efficiency in breeding programmes. The number of feeding visits per day in the HC period was associated with both DMI and RFI, which agrees with Kelly et al. (Reference Kelly, McGee, Crews, Fahey, Wylie and Kenny2010). Similarly, this holds true at pasture, as the number of grazing bouts per day was positively associated with both DMI and RFI, but grazing bout duration was negatively associated with RFI. Feeding time was associated with DMI and RFI in the HC period, which is similar to the findings of McGee et al. (Reference McGee, Welch, Ramirez, Carstens, Price, Hall and HIll2014). At pasture, grazing time and biting rate have been reported as integral components regulating intake (Gregorini et al., Reference Gregorini, Tamminga and Gunter2006); however, in the current study, only biting rate was significantly associated with DMI and RFI. Collectively, this implies that feed efficient (low-RFI) cattle have fewer grazing bouts of longer duration with less vigorous grazing compared to their inefficient counterparts. In contrast, the grazing behaviour of high-RFI (inefficient) animals more closely resembles an ‘evolutionary anti-predator foraging strategy’, which involves consuming herbage as rapidly as possible (Gregorini et al., Reference Gregorini, Tamminga and Gunter2006). These differences in herbage harvesting and ingestive behaviour are likely to be associated with divergence in energy expenditure. Rumination involves the breakdown of ingested feed into smaller particles for further digestion in the rumen (Van Soest, Reference Van Soest1994). The positive association between the number of ruminating boli with G : F may indicate that animals efficient at converting feed to live weight gain regurgitate boli more often to increase mastication and consequently the digestibility of herbage. Further work is required in this area. Advances in precision agricultural technologies will allow for the routine collection of data pertaining to grazing and rumination behaviour in animals at pasture in commercial settings. These traits could potentially be used in breeding programmes for feed intake or feed efficiency at pasture. For instance, combining the grazing behaviour traits with BW and ADG could lead to a useful prediction model for use in generating breeding values for feed intake.
Ultimately, the success of pasture-based beef production systems is reliant on the selection of animals capable of efficiently converting a predominantly grazed grass and grass silage-based diet to product cost-effectively. The results of the current study demonstrate that associations for feed intake and RFI (but not G : F) between grass silage-based and grazing or HC diets were moderate-to-weak; however, the traits were not correlated between grazed pasture and HC. Therefore, breeding values derived indoors on HC diets may not be optimized for pasture-based beef production systems. Furthermore, the implications of the findings also potentially extend to the appropriateness of generating breeding values for greenhouse gas emissions, for example, methane indoors on HC diets, as feed intake and methane are closely linked (Basarab et al., Reference Basarab, Beauchemin, Baron, Ominski, Guan, Miller and Crowley2013). Further research using multiple records of DMI estimated at pasture is required to confirm these findings. The results also show that grazing and rumination behaviour at pasture are associated with feed intake and feed efficiency and could possibly be used as ‘indicator traits’ in breeding for genetic improvements for feed intake and feed efficiency.
Acknowledgements
The authors acknowledge the financial support of the Department of Agriculture Food and the Marine Research Stimulus Fund 13/S/496 RAPIDFEED. The authors acknowledge the technical assistance of E. Mulligan, M. Williams, M. McManus, N. Galvin and the Teagasc Grange and Johnstown Castle farm staff. The statistical expertise of N. McHugh is also acknowledged. Additionally, the contribution of the Irish Cattle Breeding Federation is acknowledged.
B. Lahart 0000-0002-0341-2030
Declaration of interest
None.
Ethical statement
The animal procedures undertaken in this study were approved by the Teagasc Animal Ethics Committee and licensed by the Health Products Regulatory Authority in accordance with Directive 2010/63/EU.
Software and data repository resources
None.


