


Malnutrition and involuntary weight loss are common in cancer patients and can often be attributed to the metabolic burden of the tumour itself with associated cachexia, and/or the toxicities of the treatment modalities used(Reference Von Meyenfeldt, Fredrix and Haagh1–Reference Baracos, Martin and Korc3). Recently, skeletal muscle mass (SMM) depletion has gained particular interest, with the use of various body composition methods to determine actual loss of lean tissue rather than total body weight alone(Reference Prado and Heymsfield4). This is particularly relevant, as depletion of muscle mass can occur independently of adipose tissue, and overweight or obese patients may have low skeletal muscle reserves(Reference Prado, Lieffers and McCargar5). In patients with cancer, skeletal muscle and fat are not necessarily gained or lost in equal proportions and although patients may gain fat, muscle mass can be lost simultaneously(Reference Fearon, Strasser and Anker2,Reference Mourtzakis, Prado and Lieffers6) , and as a result, these patients can be overlooked for potential nutritional risk(Reference Barazzoni, Bischoff and Boirie7).
The progressive and general depletion of SMM and related functional decline are key components of sarcopenia(Reference Cruz-Jentoft and Sayer8). Full consensus on the definition of sarcopenia in terms of included variables and cut-off values has yet to be reached; however, diagnosis requires a combination of muscle mass measurement, muscle strength and physical performance indicators(Reference Cruz-Jentoft, Bahat and Bauer9). Sarcopenia has been associated with subsequent adverse outcomes, and although originally mostly investigated in the ageing population, with an increased risk of falls, frailty, functional decline and mortality(Reference Cruz-Jentoft, Bahat and Bauer9), in patients with cancer, low SMM and low muscle attenuation have been shown to be poor prognostic indicators(Reference Martin, Birdsell and MacDonald10,Reference Daly, Prado and Ryan11) . Where sarcopenia has been assessed in cancer research, it is generally defined as low muscle mass, with physical function assessment rarely included(Reference Cruz-Jentoft and Sayer8). The term ‘skeletal muscle index’ (SMI) is also used to define sarcopenia as a normalised measure of muscle (cm2/m2).
The negative impact of sarcopenia on outcomes, particularly survival, in patients with cancer, has been investigated across various malignancies such as head and neck, colorectal, upper gastrointestinal and lung(Reference Prado, Lieffers and McCargar5,Reference Martin, Birdsell and MacDonald10,Reference Shachar, Williams and Muss12–Reference Prado, Birdsell and Baracos18) . As a result, there is increasing evidence that sarcopenia should be included in risk stratification tools to identify patients at high risk of potential nutritional issues and complications of treatment.
Measurement of body composition using diagnostic computed tomography (CT) scans has emerged as an effective method to determine levels of muscle depletion, in oncology patients, as images are readily available for analysis and do not require additional cost, radiation exposure or burden to the patient. The accuracy and reliability of a CT scan at the tissue-organ level has led to this being accepted as the ‘gold-standard’ imaging method in body composition analysis(Reference Prado and Heymsfield4,Reference Mourtzakis, Prado and Lieffers6,Reference Prado, Birdsell and Baracos18) . In this context, low muscle mass, without functional assessment, that is associated with an increased risk of mortality, has been described as ‘CT-defined sarcopenia’(Reference Martin, Gioulbasanis and Senesse19,Reference Martin, Hopkins and Malietzis20) . For the purposes of this review, the term sarcopenia will refer to CT-defined sarcopenia.
The cross-sectional area (CSA) of a single vertebral slice in CT imaging at the lumbar vertebral level of L3 has been shown to correlate well with total body skeletal muscle volume in healthy subjects(Reference Shen, Punyanitya and Wang21). The CSA of muscle at the level of L3 can be used to diagnose sarcopenia; however, cut-off values have been previously defined by numerous researchers based on mortality outcomes, often with varied values for sex, BMI, specific populations, and in varying tumour groups(Reference Prado, Lieffers and McCargar5,Reference Mourtzakis, Prado and Lieffers6,Reference Martin, Birdsell and MacDonald10,Reference van Vledder, Levolger and Ayez22,Reference Su, Ruan and Chen23) , making direct comparisons difficult in patients with cancer without standardisation.
One of the issues with the use of CT scans in muscle mass evaluation for many tumour types is that diagnostic, rather than whole-body scans, is frequently used to evaluate a specific anatomical area such as: the head and neck, chest or abdomen and pelvis. As a result, those who have not had an abdominal CT are unable to be assessed using validated measures. This has led researchers to use alternative landmarks.
The selection of an alternate slice to L3 should consider whole-body musculature, specifically whether muscle groups are more susceptible to wasting than others, and minimum mass required for actual function. Alternate CT scan slices have been investigated in non-cancer or healthy subjects, with vertebral levels ranging from T4 to L5, with varying results(Reference Shen, Punyanitya and Wang21,Reference Derstine, Holcombe and Ross24–Reference Rozenberg, Mathur and Herridge32) . Dertstine et al., in a study of 735 healthy subjects, compared vertebral levels from T10 to T5, and the authors concluded that the further away from L3 that SMM is measured, the less reflective it is of whole-body SMM(Reference Derstine, Holcombe and Ross24). Although validation of alternate slices has been conducted in healthy subjects, this may not be applicable to patients with solid tumours, due to potential alterations in body composition caused by altered metabolic and energy balance(Reference Demark-Wahnefried, Peterson and Winer33–Reference Silver, Dietrich and Murphy35).
Single muscle groups at a particular vertebral level have also been used, such as the psoas or pectoralis muscle, rather than the CSA of the entire slice, again with varying definitions of sarcopenia cut-offs (if any), and subsequent varied results(Reference Kinsey, San José Estépar and van der Velden36–Reference Veld, Vossen and De Amorim Bernstein47). Baracos raises significant concerns with using one sentinel muscle for sarcopenia measurement, including that all muscles have specific functions, and wasting can occur differently in certain muscle groups, bringing into question whether one muscle can be representative of whole-body muscle status(Reference Baracos48). This approach has also yet to be validated by any expert group. Adiposity at a particular vertebral level should ideally also be considered to enable the impact of sarcopenia and obesity to be explored; however, for the purposes of this review, assessment of SMM is the focus.
With much being currently explored in this area, and the importance of identifying sarcopenia in cancer patients, the aim of this systematic review was to investigate the use of alternate vertebral levels above the lumbar L3 in the evaluation of skeletal muscle in this population. The objective of this narrative synthesis is to determine if there is a feasible alternative that can be used when L3 is not available.
Methodology
Search strategy
This systematic review followed criteria outlined by the Preferred Reporting Items for Systematic Reviews and Meta-Analysis guidelines(Reference Liberati, Altman and Tetzlaff49) and has been registered with PROSPERO (the international prospective register of systematic reviews) with Registration number CRD42019137317 in October 2019.
All relevant studies were identified through extensive searches of electronic databases and reference lists of eligible papers. The search included the databases: Ovid MEDLINE, Embase, CINAHL (Cumulative Index to Nursing and Allied Health Literature), Web of Science and Scopus (papers published from January 1996 to 30 April 2020). The medical subject headings (MeSH) used in each database were: (sarcopenia, ‘skeletal muscle’, ‘muscle wasting’, ‘muscle atrophy’, ‘body composition’, ‘muscle mass’, cachexia and ‘muscle weakness’) combined (using Boolean operator AND) with (CT, ‘computed tomography’) and (cancer, carcinoma, neoplasms) and (lumbar, thoracic, cervical). The systematic selection process is illustrated in Preferred Reporting Items for Systematic Reviews and Meta-Analysis format in Fig. 1.
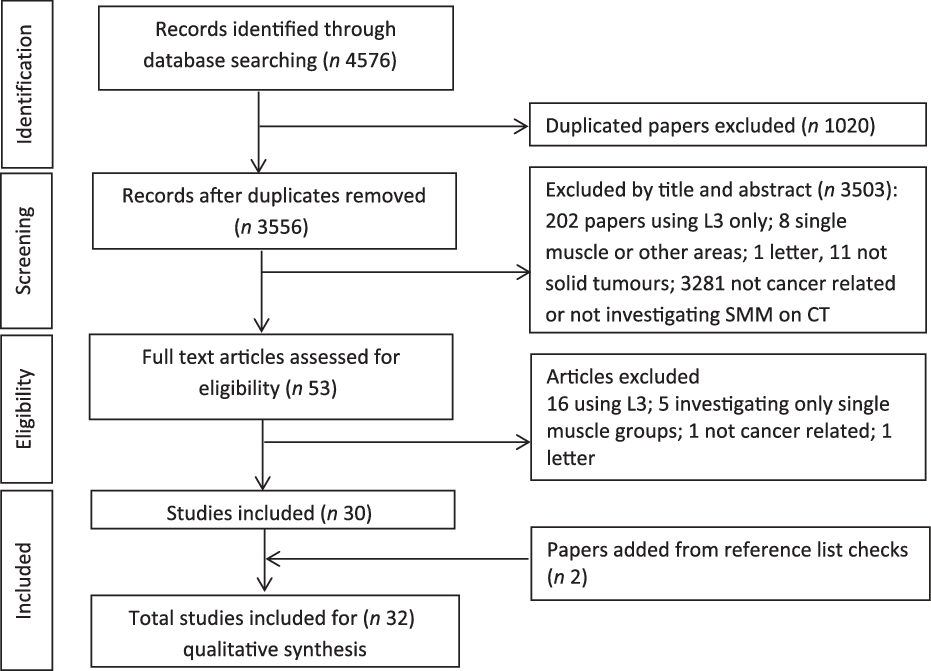
Fig. 1. PRISMA flow diagram of literature search and article selection.
Eligibility criteria
Studies using adult human subjects (≥18 years) with a confirmed cancer diagnosis (solid tumours only) were included. All studies that used alternate vertebral landmark slices to the lumbar L3 in CT scans in the evaluation of SMM and all papers that investigated the CSA of skeletal muscle at any slice above the level of L3 were eligible. Those that included validation or comparison of the alternate slice with L3 were also included. Studies selected for review included only those that had measured skeletal muscle using the CSA of an entire vertebral slice and not isolated muscle groups. Other exclusions were conference abstracts, case studies, opinion papers, non-English papers and reviews.
Study appraisal and synthesis
Eligibility assessment was performed by the primary investigator, independently and unblinded. Electronic database search results were transferred into EndNote X9 (Thompson Reuters), where duplicates were then removed. The abstracts and titles of the remaining papers were assessed using the eligibility criteria, excluding those that did not obviously meet this. The full texts of publications that met the criteria were then reviewed once again to ensure compliance. The quality of the methodology used in each paper and validity of presented results were then assessed using the Academy of Nutrition and Dietetics Quality Criteria Checklist, where studies were given a positive (+), neutral (Ø) or negative (–) quality rating based on the appraisal tool(50). Two independent reviewers completed the checklist individually and blinded, and findings were compiled and any discordance was discussed until consensus was reached.
Data extraction
Data relating to the type of cancer, specific vertebral slice and/or slices used, the rationale for selecting a particular slice, whether association with L3 was investigated and the sarcopenia cut-off points used (if included) are displayed in Table 1.
Table 1. Characteristics of thirty-two selected studies using alternate vertebral computed tomography (CT) scan slices for skeletal muscle mass (SMM) estimation

Quality rating: + positive, Ø neutral.
C, cervical; T, thoracic; L, lumbar; HNC, head and neck cancer; SMM, skeletal muscle mass; CSMA, cross-sectional muscle area; SMA, skeletal muscle area; SMI, skeletal muscle index; CSA, cross-sectional area; CDLT, chemotherapy dose-limiting toxicity; CT, computed tomography; SAT, subcutaneous adipose tissue; SM, skeletal muscle; pts, patients; Ca, cancer; N/A, not applicable; PNS, paranasal sinuses; SMD, skeletal muscle radiodensity; DFS, disease-free survival; PFS, progression-free survival; OS, overall survival; DSS, disease-specific survival; CRF, chronic renal failure; ROC, receiver operating characteristic.
Results
There were 4576 studies identified through the database searching process. After screening titles and abstracts, fifty-three studies were scanned in full. Studies that did not meet the criteria for inclusion were then removed; reference lists of the remaining papers were checked, resulting in thirty-two included in the systematic review (Fig. 1).
Study characteristics
All thirty-two papers were retrospective, cross-sectional studies, with the largest proportion originating from The Netherlands (13/32, 41 %). The number of patient scans used in each study varied, with the majority 24/32 (75 %) having sample sizes <250, with only three studies having much larger cohorts of >800(Reference Pai, Chuang and Chuang51–Reference Dabiri, Popuri and Cespedes Feliciano53). The majority (52 %) of papers focused on muscle mass assessment in patients with head and neck cancer (HNC) (seventeen studies(Reference Pai, Chuang and Chuang51,Reference Popuri, Cobzas and Esfandiari52,Reference Bril, Wendrich and Swartz54–Reference Huiskamp, Chargi and Devriese68) ), with ten (32 %) investigating lung cancer(Reference Goncalves, Taylor and Halpenny69–Reference Madariaga, Troschel and Best78) and the remaining papers focusing on a mixed tumour cohort of head and neck, lung, breast and colorectal(Reference Dabiri, Popuri and Cespedes Feliciano53,Reference Blauwhoff-Buskermolen, Langius and Becker79–Reference Neefjes, van den Hurk and Blauwhoff-Buskermolen82) . More detailed characteristics of the studies are shown in Table 1.
Study quality and bias assessment found that there were no studies of negative quality and eighteen was rated as being neutral. As all studies were retrospective in nature and involved the use of CT scans from patients who had already had a scan for diagnostic purposes, patients were not ‘recruited’ into studies and received no intervention other than standard care. The risk of bias therefore was associated with the limiting of selected tumour groups, and as there was no randomisation and small populations, results may not be representative of larger sample cohorts. Due to the nature of CT scans, scans were excluded from all studies if they were not clear for analysis and this may have led to some bias in the assessment of the remaining scans. Potential biases were addressed in most papers; however, three failed to discuss risk of bias or limitations at all in the presented results(Reference Jung, Roh and Kim63,Reference Kim, Kim and Park70,Reference Recio-Boiles, Galeas and Goldwasser71) .
Analysis of computed tomography scans
The Slice-O-Matic (Tomovision, Canada) medical imaging software was used in the majority of studies (15/32, 47 %), with the remainder using either in-house software or different software packages. Fifteen papers used a cervical vertebral slice (C3)(Reference Bril, Wendrich and Swartz54–Reference Wendrich, Swartz and Bril57,Reference Bril, Pezier and Tijink59–Reference Ansari, Chargi and van Gemert66,Reference Huiskamp, Chargi and Devriese68,Reference Muresan, Juan and Artero80) with most using the study by Swartz et al. as the reference for the use of C3, and applying the prediction formula described to the CSA at C3 to predict CSA at L3(Reference Swartz, Pothen and Wegner56). Seven of these studies were conducted at the same institution in the Netherlands where the use of C3 in muscle mass estimation was first investigated(Reference Bril, Wendrich and Swartz54–Reference Wendrich, Swartz and Bril57,Reference Bril, Pezier and Tijink59,Reference Ansari, Chargi and van Gemert66–Reference Huiskamp, Chargi and Devriese68) . The use of thoracic vertebral landmarks varied and included T2, T4, T5, T8, T10 and T12, and these levels were used in the studies investigating lung, head and neck and colorectal cancer(Reference Pai, Chuang and Chuang51–Reference Dabiri, Popuri and Cespedes Feliciano53,Reference Sealy, Dechaphunkul and van der Schans58,Reference Goncalves, Taylor and Halpenny69,Reference Fintelmann, Troschel and Mario74–Reference Madariaga, Troschel and Best78,Reference van der Kroft, van Dijk and Rensen81,Reference Neefjes, van den Hurk and Blauwhoff-Buskermolen82) . The remaining studies used the higher lumbar vertebral slice of L1(Reference Goncalves, Taylor and Halpenny69–Reference Sun, Anraku and Karasaki73). The most common reason given for using an alternative slice to L3 was that an abdominal scan was not available diagnostically for many tumour sites, and an alternative needed to be used for sarcopenia analysis. However, most gave no rationale as to why a specific slice level was chosen (either cervical or thoracic), or any previously published validation evidence to support its use.
Two Canadian studies investigated auto-segmentation modelling using a head and neck and lung cancer data set (1004 patients) of CT scans(Reference Popuri, Cobzas and Esfandiari52,Reference Dabiri, Popuri and Cespedes Feliciano53) . Both presented models for thoracic auto-segmentation at T4 and at L3 following comparison with manual segmentation of the same slices. Direct comparison of SMM at the thoracic level with that at L3 was not conducted. Both studies suggest ‘good’ performance from their models for auto-segmentation of muscle from CT images suitable for analysis of large-scale cancer databases. Although these two studies were quite clinically different to those measuring outcomes, they met the selection criteria for this review. Rationale for the use of the thoracic slice T4 as well as L3 was that both had been ‘widely used for body composition analysis’(Reference Popuri, Cobzas and Esfandiari52).
Sarcopenia analysis and cut-off values
Sarcopenia was not the focus of all the studies in the review, and specific sarcopenia cut-off measurements were not provided in these instances. These studies investigated the association between L3 and another slice of choice as an alternative, however, did not determine actual sarcopenia incidence in the populations used(Reference Bril, Wendrich and Swartz54,Reference Swartz, Pothen and Wegner56,Reference Wieland, Stewart and Skipworth76) . Where sarcopenia cut-off values were used, there was inconsistency in the values provided. Five studies referenced the sarcopenia cut-off value determined by Wendrich et al. (Reference Wendrich, Swartz and Bril57) of SMI < 43·2 cm2/m2 which was found to be predictive of chemotherapy dose-limiting toxicity, however provided no sex-specific values(Reference Chargi, Bril and Emmelot-Vonk55,Reference Bril, Pezier and Tijink59,Reference Zwart61,Reference Ansari, Chargi and van Gemert66,Reference Chargi, Bril and Swartz67) . Others used the sex-specific cut-offs applied for CSA at L3 by Martin et al. (Reference Martin, Birdsell and MacDonald10) which also provides cut-off values for obese males(Reference Ganju, Morse and Hoover60,Reference Muresan, Juan and Artero80,Reference Neefjes, van den Hurk and Blauwhoff-Buskermolen82) . Twelve studies provided their own cut-off values based on mortality or morbidity prediction, or using receiver operating characteristic curves in their population analysis, with or without sex-specific cut-offs, at the alternate vertebral slice levels(Reference Pai, Chuang and Chuang51,Reference Sealy, Dechaphunkul and van der Schans58,Reference Karsten, Al-Mamgani and Bril62,Reference Jung, Roh and Kim63,Reference Lin, Lin and Kang65,Reference Huiskamp, Chargi and Devriese68,Reference Kim, Kim and Park70,Reference Sun, Anraku and Karasaki73–Reference Troschel, Kuklinski and Knoll75,Reference Madariaga, Troschel and Best78,Reference Blauwhoff-Buskermolen, Langius and Becker79) . Most papers provided cut-offs in comparable SMI format, others looked at volume or mass values only. All cut-off values are shown in Table 1, and those studies that provided sex-specific cut-off values are represented in Fig. 2 to graphically demonstrate the variation in cut-offs used.
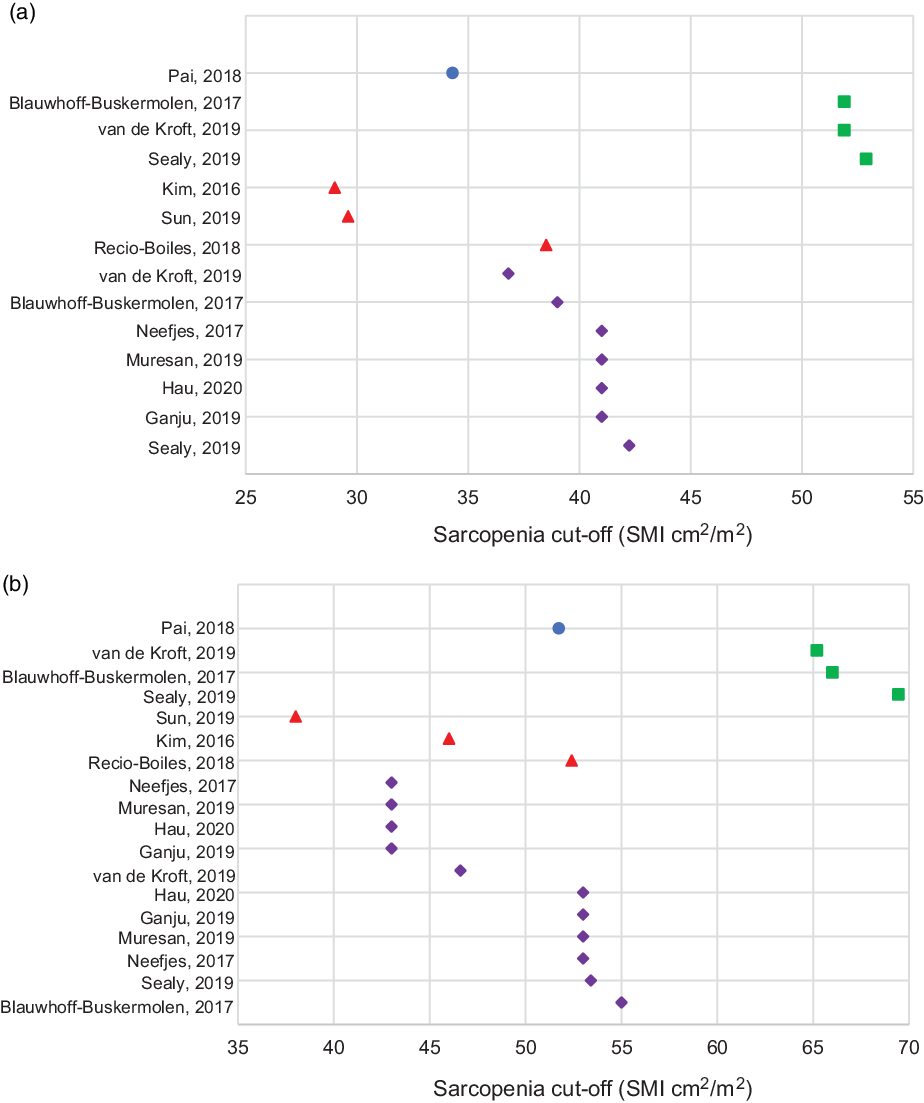
Fig. 2. Sarcopenia cut-offs using alternate vertebral slices in (a) females and (b) males. Legend: ![]() T2;
T2; ![]() T4;
T4; ![]() L1;
L1; ![]() L3
L3
Alternate vertebral slice results
All studies presented positive results for the use of the particular vertebral slice chosen as an alternative to L3. Few, however, performed direct comparative evaluation to CSA at L3(Reference Pai, Chuang and Chuang51,Reference Jung, Roh and Kim63,Reference Kim, Kim and Park70,Reference Sanders, Degens and Dingemans72,Reference Gronberg, Sjoblom and Wentzel-Larsen77,Reference van der Kroft, van Dijk and Rensen81) , and none compared the alternate slice of choice with whole-body SMM. Swartz et al. (Reference Swartz, Pothen and Wegner56) were the first to demonstrate a correlation between CSA at L3 and C3 in fifty-two patients with HNC (r = 0·891, P < 0·001) and developed a prediction equation for the estimation of skeletal muscle at L3 from C3 values (using the sum of the paravertebral and sternocleidomastoid muscles). This method has been applied in twelve of the studies in this review(Reference Chargi, Bril and Emmelot-Vonk55,Reference Wendrich, Swartz and Bril57,Reference Bril, Pezier and Tijink59–Reference Karsten, Al-Mamgani and Bril62,Reference Hua, Liao and Liu64–Reference Huiskamp, Chargi and Devriese68,Reference Muresan, Juan and Artero80) . Jung et al. created differing models for survival prediction using CSA at C3 and provide low SMM cut-offs in mass measures, not SMI(Reference Jung, Roh and Kim63). No studies were found that used other cervical vertebral levels.
In the studies that investigated thoracic SMM, Pai et al. (Reference Pai, Chuang and Chuang51) found a positive correlation between CSA at T2 and L3 (r = 0·63, P < 0·001) in 173 HNC patients with full-body scans (20 % of the total study cohort). Van de Kroft et al. compared CSA at T4 with L3 and showed significant correlations in patients with liver metastases from colorectal cancer and present their own sarcopenia cut-offs for L3 and T4 (r 2 = 0·60, P < 0·001)(Reference van der Kroft, van Dijk and Rensen81). Gronberg et al. also compared CSA at L3 with T4 and only found a moderate agreement when 401 scans in patients with lung cancer were investigated at both levels, in males and females (r 2 = 0·51 and 0·28)(Reference Gronberg, Sjoblom and Wentzel-Larsen77). Another study used CSA at T4 in patients with lung cancer, and results were analysed separately with authors, suggesting that they be ‘interpreted with caution’ as validation of measurements at the T4 level was currently being undertaken(Reference Neefjes, van den Hurk and Blauwhoff-Buskermolen82). Sealy et al. also looked at SMI at T4, however in HNC patients, and used a method of pooling the SMI values at L3 and T4 using standard deviations from the mean and presented their own set of sex-specific cut-off values(Reference Sealy, Dechaphunkul and van der Schans58).
The vertebral level L1 was used by two groups with L3 comparisons. Sanders et al. demonstrated a ‘stronger’ correlation with muscle CSA at L1 to L3 when compared with pectoralis muscle alone in patients with lung cancer (r = 0·90, P < 0·001)(Reference Sanders, Degens and Dingemans72). Kim et al. also compared muscle area at L1 and the pectoralis muscle to that of the area at L3, and they too demonstrated greater correlation between L1 and L3 than pectoralis muscle alone and L3 (r = 0·851 v. r = 0·447, P < 0·001)(Reference Kim, Kim and Park70). This finding was then used to generate estimated sex-specific cut-offs for sarcopenia at the level of L1.
All but one study used baseline CT scans for analysis and did not investigate muscle changes over time in alternate slices. Wieland et al. compared scans at two time intervals to assess muscle changes at T4; however, sarcopenia was not a focus of this particular paper, and muscle loss or gain was for the purposes of unrelated investigation(Reference Wieland, Stewart and Skipworth76).
Discussion
This review demonstrates that there is limited work in the area of alternate CT slices for the diagnosis of sarcopenia in patients with cancer and, what does exist, varies widely not only in the choice of slice but also in the appropriate methods of comparison, and the sarcopenia cut-off values used. Overall, the evidence is not sufficiently robust to offer a single suitable alternative to L3 for the assessment of CT-defined sarcopenia in this population.
The use of the CSA at the L3 level has been widely accepted as the site best associated with total body SMM. Since the pioneering work of Shen et al. in 2004, who compared the muscle CSA of lumbar slices in CT scans with whole-body MRI in healthy adults, total body SMM was best correlated with skeletal muscle area in a single abdominal slice about 5 cm above L4–L5 (around the L3 mark). Whole-body SMM was measured using the CSA of forty axial slices and the estimated volume measurements in between each slice(Reference Shen, Punyanitya and Wang21). Mourtzakis et al. also demonstrated whole-body correlation with L3 in patients with locally advanced or metastatic lung or colorectal cancer, when L3 CSA was compared with whole-body dual-energy X-ray absorptiometry measures(Reference Mourtzakis, Prado and Lieffers6). No study in this review attempted to determine the association between CSA at an alternate vertebral slice, with actual total body SMM.
Full-body PET-CT scans are not routinely used in many centres, mainly due to access, costs involved or Oncologist preference for patient diagnostic requirements. A common issue in each study was a lack of rationale for the particular alternate slice chosen by the research team. Random selection of a vertebral level without consideration of the musculature in that area, and their functions, calls into question the validity and applicability of an alternate level for body composition analysis.
The highest alternate vertebral level in this review used was C3. Several papers investigating SMM in HNC have used the method introduced by Swartz et al. where muscle measurement at C3 is used to predict CSA at L3(Reference Swartz, Pothen and Wegner56). This initial study, however, only investigated a small population of HNC patients (n 52) and compared these with a control group of ‘trauma’ patients with no specific reason for the selection of C3 as the cervical level of choice. The agreement between muscle values at C3 and L3 was measured using both correlation (r = 0·785, P < 0·001) and Bland–Altman methodology(Reference Bland and Altman83). ‘Reasonable’ agreement and a prediction rule were then established following multivariate analysis and involved the inclusion of a patient’s age, sex and weight. Due to the very small cohort in this study, there is serious concern regarding imprecision, as well as results not validated against full-body SMM measurements. Muscles in the C3 area include the sternocleidomastoid and paravertebral muscles, and it is unclear if these muscles high in the neck region are susceptible to severe wasting, and even suitable to be associated with whole-body SMM. These muscles are very different to those found at the L3 level, and whether these can even be interconverted is questionable. A further limitation of the use of C3 in the HNC population is tumour invasion in this area, and although the authors addressed this with the suggestion of doubling one side of the sternocleidomastoid muscles, this is not feasible in patients with bilateral neck nodal involvement. Also missing at this level is adequate adipose tissue (specifically visceral), deeming adiposity analysis impossible. Twelve studies have subsequently used the Swartz equation method in patients with HNC with varying sample sizes and results(Reference Hua, Deng and Long43,Reference Chargi, Bril and Emmelot-Vonk55,Reference Wendrich, Swartz and Bril57,Reference Bril, Pezier and Tijink59–Reference Karsten, Al-Mamgani and Bril62,Reference Lin, Lin and Kang65,Reference Ansari, Chargi and van Gemert66,Reference Huiskamp, Chargi and Devriese68,Reference Muresan, Juan and Artero80,Reference Chargi, Ansari and Huiskamp84) .
Thoracic slices ranged from T2 to T10 with no clear indication of which particular slice is the most suitable, and cut-off values for sarcopenia varied with each vertebral level. The use of a thoracic slice makes clinical sense, especially in lung cancer patients, as most will have a chest CT scan at time of diagnosis. The muscles located in the thoracic region are responsible for respiration, which is itself important for function and recovery; therefore, analysis of muscle wasting in this area could be useful. Certain muscles in the L3 region extend to the thoracic level, such as the erector spinae; however, other muscles at the level of T4, for example, include the pectoralis muscle, and these have functions associated with arm and shoulder movements. This may impact on muscle volume in this area specifically in relation to manual activities, potentially more applicable to men, and these functional differences need to be considered when selecting a thoracic slice(Reference Gronberg, Sjoblom and Wentzel-Larsen77). There was only one study that used T2. This study compared SMM at T2 with L3 in 173 HNC patients with r = 0·63 (P < 0·001)(Reference Pai, Chuang and Chuang51). The r 2 value is low at 0·40, and no information is provided with regard to adjustments for co-variables. This slice was chosen ‘along an alignment of both humeral heads and the secondary thoracic vertebra (T2)’; however, no mention is made of the potential issue of skewing of the shoulders and muscles in this area, and the difficulty of identifying a slice with identical muscle visible on both sides. Important also to note is that this study was conducted in a Taiwanese population, and ethnicity should also be taken into consideration. Due to the uncertainty of results presented in this study, the use of T2 may not be suitable, however, warrants further investigation. The Patient-Generated Subjective Global Assessment tool used in the nutritional assessment of cancer patients incorporates the physical examination of the clavicle and scapula regions for signs of muscle wasting(Reference Jager-Wittenaar85); therefore, the T2 area may have some validity for future use in sarcopenia analysis. Four studies investigated lower thoracic slices from T5 to 12, yet all provided skeletal muscle measurements in m2 or as volume in m3, not as SMI, making comparisons with other studies difficult(Reference Goncalves, Taylor and Halpenny69,Reference Fintelmann, Troschel and Mario74,Reference Troschel, Kuklinski and Knoll75,Reference Madariaga, Troschel and Best78) .
The lumbar L1 slice was used by five studies(Reference Goncalves, Taylor and Halpenny69–Reference Sun, Anraku and Karasaki73) with two assessing the relationship between SMI at L3 and L1, both demonstrating reasonable correlation. The muscles found at L1 are similar to those at L3, so this is likely a suitable alternative which, however, may be too low down in a CT scan for many other cancer sites to be applicable for wider use.
Sarcopenia incidence or diagnosis was the focus of 24/32 (75 %) of the papers in this review, and there was heterogeneity in the SMI values used as the cut-off for diagnosis of sarcopenia. Sex-specific cut-offs associated with mortality have been published by Prado et al. and classify sarcopenia as <52·4 cm2/m2 for men and <38·5 cm2/m2 for women at L3, in obese patients with solid respiratory or gastrointestinal tumours(Reference Prado, Liefers and McCargar86). Martin et al. have established sarcopenia cut-off values at L3 for mortality as: <53 cm2/m2 in obese males, <43 cm2/m2 in non-obese males and <41 cm2/m2 in females regardless of obesity status, in 1473 patients with lung or gastrointestinal cancers(Reference Martin, Birdsell and MacDonald10). The studies in this review have used varied methods for low SMI assessment based on morbidity and mortality outcomes, and this makes comparability difficult, not only with specific vertebral levels but also on a tumour site level. Of concern is the lack of sex-specific threshold values for low SMM. Males generally have a higher proportion of SMM than females, and this is especially so in the upper body(Reference Janssen, Heymsfield and Wang87,Reference Baracos and Kazemi-Bajestani88) . Therefore, alternate levels in the thoracic region need to account for this potential difference in muscularity. Van de Kroft et al. (Reference van der Kroft, van Dijk and Rensen81) provided sex-specific cut-off values for both L3 and T4 with quite varied results to those given by Sealy et al. at the same levels(Reference Sealy, Dechaphunkul and van der Schans58), especially at L3, in colorectal and HNC patients, respectively. In the papers that used C3, only three(Reference Hua, Deng and Long43,Reference Ganju, Morse and Hoover60,Reference Muresan, Juan and Artero80) gave sex-specific values based on previously defined cut-off values(Reference Martin, Birdsell and MacDonald10). In the study by Wendrich et al., sex was not shown to be a significant contributing variable when estimating risk of chemotherapy dose-limiting toxicities and low SMM in a HNC population(Reference Wendrich, Swartz and Bril57). The concern with this is that four other papers have used this outcome-specific sarcopenia cut-off value to apply to unrelated outcomes such as overall survival and post-operative complications(Reference Chargi, Bril and Emmelot-Vonk55,Reference Bril, Pezier and Tijink59,Reference Zwart61,Reference Ansari, Chargi and van Gemert66) . Separate thresholds should be applied for males and females in any cohort when investigating sarcopenia.
Similarly, there is a difference in SMM with ethnicity. Patients of Asian origin have been shown to have reduced SMM when compared with Europeans(Reference Wells89), and sarcopenia seems to be less prevalent in not only the Asian population but also in African-Americans when compared with Caucasians(Reference Hilmi, Jouinot and Burns90). This is an important factor to consider, as sarcopenia cut-off values may not be optimal across differing populations and should only be used where applicable. The majority of papers in this review were European in origin; however, all but one study that included an Asian population used their own established cut-off values. Hua et al. used cut-off values by Martin et al. (Reference Martin, Birdsell and MacDonald10), which includes BMI ranges that are not necessarily suitable for this Chinese population(Reference Hua, Deng and Long43).
Cut-off values for sarcopenia diagnosis are yet to be established for all patients with cancer and have not been validated in vertebral landmarks other than L3, yet the papers in this review have established their own values without direct comparison with full-body SMM. Halpenny et al. compared six vertebral and regional measurements of SMM, including T10 and L3, in whole-body PET-CT images in 148 patients with advanced melanoma and found that skeletal muscle at T10 was strongly associated with whole body (r 2 = 0·78); however, this paper was ineligible for inclusion in this review as it did not meet eligibility criteria for patient age (range 15–91 years)(Reference Halpenny, Goncalves and Schwitzer91). Including younger subjects under the age of 18 years is problematic as there may be changes in muscle mass with growth. T10 is also too low to be included in a head and neck scan, and this level may only have applicability to patients who have had a chest CT. Association of muscle mass to vertebral slices other than L3 has yet to be validated against full-body measurements using CT scans in adult cancer patients.
The lack of consensus and varying results not only for slices used but also tumour sites makes comparison challenging. In addition, the lack of validation methods investigating the relationship of muscle CSA at other vertebral slices to whole-body SMM, specifically in cancer, is a concern and brings into question their application in sarcopenia diagnosis. The muscle CSA at the level of L3 is a surrogate of whole-body SMM in healthy adults(Reference Shen, Punyanitya and Wang21), and determining the association of muscle CSA at a different vertebral level by comparing with measures at L3 is a further surrogate of a surrogate value, increasing the possible degree of error. The myriad of results, many with poor correlations to L3, a lack of adequate consideration of musculature at alternate vertebral levels, and potentially unsuitable cut-offs for sarcopenia assessment, give cause for concern with the research that has been done in this area and should be interpreted with caution.
With emerging evidence of worse outcomes for patients with cancer who are sarcopenic, it is important that all patients are assessed where possible and that a consistent and clinically relevant evidence base be established. Having an accurate and validated alternative to the L3 slice will enable this crucial assessment in not only patients who have had an abdominal CT scan but also all patients with cancer. This review highlights the requisite need for more robust methods of validation in order for suitable alternate slices to be used for sarcopenia assessment and should ideally aim to include comparison of whole-body SMM measurements from the CT scans of patients with cancer.
Conclusion
This systematic review indicates that the current level of evidence is inadequate to provide definitive recommendations for the use of alternate vertebral slices to L3 in CT scans of cancer patients, for the evaluation of SMM and the diagnosis of CT-defined sarcopenia.
Acknowledgements
Support was provided for this work by an Australian Government Research Training Program Scholarship.
All authors contributed to the conceptualizatiuon and methodology. Belinda Vangelov: Investigation, Validation, Formal Analysis, Writing-Original draft preparation, Writing - Review and Editing, Visualisation, Project Administration. Damian Kotevski: Validation, Formal Analysis, Writing - Review and Editing. Judy Bauer: Supervision, Writing - Review and Editing. Robert Smee: Supervision, Writing - Review and Editing.
B. V., J. B., D. K. and R. S. declare they have no conflict of interest.


