


Introduction
There is now a long history of dietary fibre research around the world, including numerous studies showing relationships between fibre intake and health. Many countries carry out national surveys and most of these report total dietary fibre (TDF) intakes. From knowledge of the role of fibre in health and of intakes, recommendations have appeared since the 1970s to increase the intake of dietary fibre in Western countries to ultimately improve the health of their populations. Many of these have included figures for the daily amount to be consumed and many have also suggested various high-fibre foods in their dietary guidelines. However, there have been few attempts to consolidate these recommendations across Europe. Moreover, there is little further guidance beyond a total quantity of fibre to be consumed such as to specify the types of fibre or the proportions of the different fibre-containing food sources to achieve an optimum intake. This is partly because of debates about how fibre should be subdivided into categories, since these have largely been unsatisfactory. Dietary guidance in recent years has also focused on topics other than fibre, such as efforts to address obesity and CVD and/or to achieve recommended intakes of nutrients like saturated fat, sugar and salt. The stimulus for this paper was to determine the current situation about how different countries in Europe describe dietary fibre, what they recommend in terms of dietary fibre to the public, and how intakes may vary both in total amount consumed and in the sources that provide fibre to the population. From this the intent was to be able to generate more detailed guidance for European countries about not only the quantity of fibre which should be consumed, but more specifically how this might be achieved in terms of foods and fibre sources that could contribute to intakes to achieve desirable health outcomes.
The purpose of this paper is therefore to:
-
(1) Describe the current status of dietary fibre definitions and potential subclassifications by which more detailed advice could be given to the public;
-
(2) Describe current dietary recommendations and guidelines in Europe which include fibre and to investigate how these vary both in recommended intake and in sources from which this should be obtained;
-
(3) Describe the permitted health claims in Europe and some selected countries, and how these vary in terminology and in the quantities of fibre required to satisfy the claim;
-
(4) Report the fibre intakes in different countries in Europe, both in terms of intakes of total fibre and of the sources that provide fibre;
-
(5) Assess how well intakes match recommendations;
-
(6) Summarise the latest literature on the relationship between fibre and the major diseases with which it has been associated, particularly where subdivisions of fibre or sources of fibre have been described as being protective. The intent was to determine those conditions for which there is sufficient evidence to able statements to be made to the public with some confidence;
-
(7) Draw these various threads together to suggest a common recommended intake for fibre in Europe and to attempt to suggest how this fibre should be derived, such as in the proportion of intakes which should come from various food groups.
In outlining these various aspects of dietary fibre recommendations, it is also intended to identify gaps in knowledge about intakes and types of fibre and sources and in the potential relationships between fibre intakes and disease outcomes. The goal of this paper was not to provide an overview of every aspect of dietary fibre in terms of its chemistry, physiology or health effects but to consider where existing knowledge is being applied at the population level – thus the accepted methods for analysis, not all methods available, intakes in national surveys of the population, not every study published, permitted health claims, where enough evidence exists to enable manufacturers to make a statement to the public, not on health effects where there is insufficient evidence to be able to draw conclusions and provide guidance to the public at large. Indeed, it is essentially a review with a public health approach. For aspects of research on dietary fibre not covered in this review, such as bioavailability, interaction with minerals or appropriateness of different fibre types for specific health conditions, readers are encouraged to seek out the appropriate literature.
Definitions of dietary fibre, classification of fibre and fibre sources, conditions for nutrition claims and analytical methods (Tables 1–7, Figs 1 and 2)
Methods used to compile tables
For definitions, classification, structures, sources and analytical methods for dietary fibre, a search was made mostly through Google and PubMed. Search terms were: dietary fibre/fiber, definition, classification, sources, structure, composition, analysis, analytical method. Specific key words were then used, such as bulking effect, viscosity, fermentation or polysaccharide and oligosaccharide names. DF content used to build Table 6 was extracted mainly from a food composition table(1).
Results: definitions
Over the years, the definition of dietary fibre has been subject to much discussion. The most recent definitions, from about 2008 (for example, Codex Alimentarius Alinorm)( 2 ), have general global agreement. Dietary fibre is made up of carbohydrate polymers with three or more monomeric units (MU), which are neither digested nor absorbed in the human intestine and includes: (1) NSP from fruits, vegetables, cereals and tubers whether intrinsic or extracted, chemically, physically and/or enzymically modified or synthetic (MU≥10); (2) resistant (non-digestible) oligosaccharides (RO) (MU 3–9); and (3) resistant starch (RS) (MU≥10). When extracted, chemically, physically and/or enzymically modified or synthetic, generally accepted scientific evidence of benefits for health must be demonstrated to consider the polymer as dietary fibre. Most definitions also include ‘associated substances’, which are non-carbohydrate such as lignin and substances which are present in cell walls linked to polysaccharides and quantified as dietary fibre by the accepted analytical methods (Tables 1 and 2).
Table 1 Principal definitions of dietary fibre
MU, monomeric units; DF, dietary fibre; RS, resistant starch; RO, resistant oligosaccharides; DP, degree of polymerisation; NDC, non-digestible carbohydrates.
The main differences between definitions are related to:
-
(1) ‘Associated substances’ (lignin, mainly) which are or are not explicitly included in dietary fibre definition.
-
(2) The minimum number of carbohydrate monosaccharide units to be included; the European Union (EU) definition prescribes a minimum MU number (sometimes called ‘degree of polymerisation’) of 3, while Codex Alimentarius prescribes a minimum of 10 but leaves to the local authority the decision on whether or not to include carbohydrates with an MU number of 3 to 9. Since many countries outside the EU have no local regulatory definition, the default is to adopt the Codex definition of MU number≥10 (Table 2). As a consequence, in these countries, RO are or are not considered as dietary fibre, independently from the demonstration of a beneficial effect.
-
(3) The requirement, mainly for extracted, isolated, modified or synthetic carbohydrate polymers, that they have been shown to have a benefit to health. Most authorities throughout the world have a (non-exclusive) list for health benefits related to dietary fibre. This list is included in the definition as, for example from Agence Française de Sécurité Sanitaire des Aliments (French Agency for Food Safety) AFSSA (2002)( 3 ) (now Agence Nationale Française de Sécurité Sanitaire de l’Alimentation, de l’Environnement et du Travail; ANSES) in France, American Association for Clinical Chemistry (AACC) in the USA (2001)( 4 ) or Food Standards Australia New Zealand (FSANZ) (2013, in Australia( 5 ) and New Zealand) or mentioned somewhere else in the text of the definition document (Codex Alimentarius (2009)( 2 ), Health Canada (2012)( 6 ), Institute of Medicine (IoM) (2005)( 7 ) in the USA). The health benefits associated with the definition are related to:
Table 2 International acceptance of CODEX definition (or very similar regulations) and inclusion of non-digestible oligosaccharides*

MU, monomeric units; EU, European Union; IOM, Institute of Medicine; DP, degree of polymerisation.
* With MU number 3–10 as dietary fibre.
(3a) Colonic function: ‘increase of stool production’ or ‘stimulation of colonic fermentation’ for AFSSA, ‘beneficial effect on/improved laxation’ for AACC, FSANZ and IoM, ‘improves laxation or regularity by increasing stool bulk’ and ‘provides energy-yielding metabolites through colonic fermentation’ for Health Canada (2012)( 6 ), ‘decrease intestinal transit time, increase stool bulk’ for the European Commission (EC)( 8 );
(3b) Blood cholesterol: ‘decrease of fasting cholesterolaemia’, ‘blood cholesterol attenuation’ or ‘reduction in blood cholesterol’, for AFSSA, EC, AACC and IoM and FSANZ, ‘reduces blood total and/or low-density lipoprotein (LDL) cholesterol levels’ for Health Canada (2012)( 6 );
(3c)Blood glucose: ‘reduces/decreases/attenuation of post-prandial blood glucose/glycaemia and/or insulin levels/insulinaemia’, ‘blood glucose attenuation’ and ‘modulation of blood glucose’ (for Health Canada, AFSSA, EC and IoM, AACC and FSANZ).
Classification of fibre, fibre sources and conditions for nutrition claims
Table 3 presents the classification of dietary fibre according to chemical structure, the main sources of the various fibre types, as well as physicochemical properties, such as water solubility and viscosity and physiological properties, such as fermentability.
Table 3 Classification of dietary fibre according to main chemical components, main food sources, and main properties*
MU, monomeric units; AX, arabinoxylans; DP, degree of polymerisation; RS, resistant starch.
* Adapted from Kumar et al. (2012)( Reference Kumar, Sinha and Makkar 92 ); † Asp (2001)( Reference Asp 9 ): data not found in the literature.
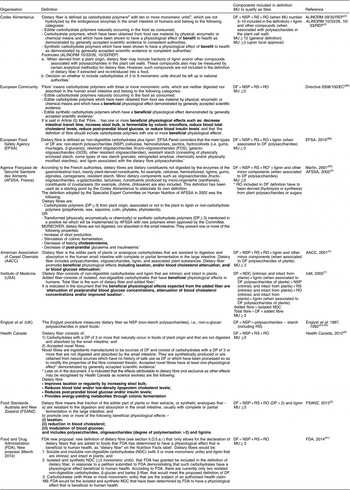
Dietary fibre is often subdivided into oligosaccharides (MU number 3–9) (RO) and polysaccharides, including NSP and RS, with a minimum MU number of 10( Reference Asp 9 ), provided in an overview in Fig. 1. Dietary fibre also comprises ‘associated substances’.
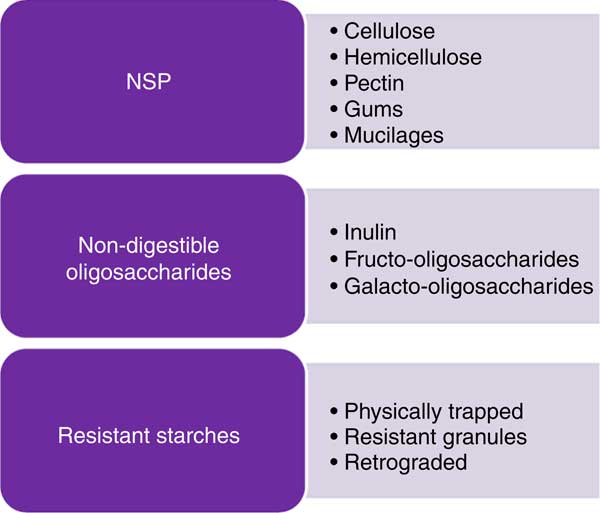
Fig. 1 Some examples of potential fibre sources.
While several of the analytical methods quantify soluble and insoluble dietary fibre separately (for example, McCleary et al. ( Reference McCleary, DeVries and Rader 10 )), there are very few publications which provide a classification of the main dietary fibre sources using this subdivision. RS and ‘associated substances’ are mostly insoluble in water, RO are mostly soluble whereas the solubility of NSP depends on the MU number, the MU composition and the linkages which are involved in the polymer. When soluble, some NSP, such as high-molecular-weight guar gum or β-glucans, certain pectins or psyllium, are also viscous or gel-forming in the intestinal tract, and this property may influence glucose and lipid metabolism. The scientific opinions of the European Food Safety Authority (EFSA) in 2010 on dietary reference values for carbohydrates and dietary fibre( 11 ) and on the substantiation of health claims related to dietary fibre( 12 ) mentioned that ‘the terms “soluble” and “insoluble” have been used in the literature to classify dietary fibre in an attempt to link different physical-chemical properties of fibre components to different physiological effects. However, the classification by water solubility is method-dependent, and does not always predict physiological effects, although in most cases soluble fibre types are fermented more quickly than insoluble types’( 13 ). Aqueous solubility is not directly related either to fermentability or to the profile of SCFA produced through fermentation, another characteristic of interest regarding effects of dietary fibre on colon cancer prevention. The bulking effect of dietary fibre is an important property when considering impact on constipation and more generally on faecal bulk. In order to have a bulking effect of any consequence, fibre must be mainly insoluble, reach the distal colon (i.e. be at least partially resistant to fermentation and/or slowly fermented in the colon) and have a significant water-holding capacity. Faecal-bulking capacity of various dietary fibre sources has been measured and/or discussed by several authors( Reference Stephen 14 – Reference Cummings 18 ) and it was concluded that there are few dietary fibre types which meet all these criteria. Monro( Reference Monro 16 ) has developed a table of faecal bulking index of sixty-six foods along with their TDF content, but these were based on measurements in rats so may not be directly applicable to humans.
It might be useful to propose a classification of dietary fibre materials according to their main characteristics: (1) viscosity in solution and/or in the digestive tract; (2) fermentability in the colon (possibly including the fermentation pattern: rate of fermentation and SCFA profile); and (3) bulking effect in the colon. However, data on all these characteristics are not yet available for many dietary fibre types and sources (Table 3), and often the fibres themselves may be poorly specified (for example, with regard to molecular weight or subunit ratios) which has also been a key issue limiting health claims for fibres in Europe. Moreover, a classification according to these physicochemical properties will be difficult to consider in dietary fibre analysis.
However, a few broad statements can be made:
-
(1) RO are largely soluble (but not viscous) and highly fermentable in the colon;
-
(2) Amongst NSP, cellulose and arabinoxylans from hulls and brans are largely insoluble and poorly fermentable;
-
(3) Amongst NSP, minimally hydrolysed hydrocolloids (i.e. pectins and gums) are viscous or gel-forming;
-
(4) Psyllium/ispaghula, carboxymethylcellulose and coarse bran have a high bulking effect( Reference Cummings 18 ).
Table 4 gives information on the main dietary fibre components found in different food categories. The fibre content of the food as eaten depends on the fibre DM and on the concentration in hulls or bran which are highly concentrated in dietary fibre.
Table 4 Dietary fibre in principal food categories – quantitative and qualitative aspects*
TDF, total dietary fibre; RS: resistant starch; RO: resistant oligosaccharides.
* Li et al. 2002( Reference Li, Andrews and Pehrsson 93 ); Mayer, 1998( Reference Mayer 94 ); Nyman et al. 1984( Reference Nyman, Siljestrom and Pedersen 95 ); Kumar et al. 2012( Reference Kumar, Sinha and Makkar 92 ); Ranhotra et al. 1991( Reference Ranhotra, Gelroth and Glaser 17 ).
Some types of dietary fibre are not present in all food categories. Such is the case of RS which is clearly only present in starchy foods (cereals, tubers, non-mature fruits (mostly in green banana)), β-glucans which are mostly present in some cereals and legumes, and pectic substances which are present mainly in fruits and some vegetables.
Extracted, isolated, modified or synthetic fibre sources with specific properties are also available for enrichment of foods or for providing techno-functional properties to food. These are considered ‘additives’ and are mostly hydrocolloids such as pectin and gums. All the commercially available non-digestible carbohydrates of MU≥3 do not appear in the positive lists of ‘dietary fibre’ set up by national or international authorities (Table 5). These lists are as yet incomplete and can be updated when adequate scientific information on beneficial health effects is available. It is interesting to note that in the scientific opinion on the substantiation of health claims relating to xanthan gum( 19 ) and ‘changes in bowel function’, xanthan gum is not presented as dietary fibre. This is probably because of the definition of dietary fibre adopted by EFSA, which states that carbohydrate polymers obtained by physical, enzymic or chemical means must demonstrate a beneficial physiological effect. Tables 3–6 include information on non-digestible carbohydrates such as xanthan gum, even if no beneficial effect has so far been demonstrated. Science is evolving and evidence of health benefits may appear in the future to allow classification of such compounds as ‘dietary fibre’.
Table 5 Extracted and synthetic fibre sources recognised as ‘dietary fibre’ in Europe
ANSES, Agence Nationale Française de Sécurité Sanitaire de l’Alimentation, de l’Environnement et du Travail; AFSSA, Agence Française de Sécurité Sanitaire des Aliments (French Agency for Food Safety).
Table 6 Principal isolated and synthetic fibre sources or high-fibre fractions available for enrichment of foods
FOS, fructo-oligosaccharides; GOS, galacto-oligosaccharides.
Table 6 lists the main extracted and synthetic fibre materials or high-fibre fractions which are available for the enrichment of foods. It shows that fibre has been incorporated into a wide variety of foods, including dairy, meat or bakery products. The amount of fibre in the food as eaten can vary from less than 0·2 g to 20 g/serving. These quantities are of interest as they determine whether or not a health claim can be made for the food in terms of its dietary fibre content. The EU Regulation (EC) No 1924/2006( 20 ) on nutrition and health claims for foods (slightly modified by a corrigendum in 2007( 20 )) specifies the requirement for the use of the terms ‘source of fibre’ or ‘high in fibre’:
-
(1) ‘Source of fibre’: a claim that a food is a source of fibre, and any claim likely to have the same meaning for the consumer, may only be made where the product contains at least 3 g of fibre per 100 g or at least 1·5 g of fibre per 100 kcal (418 kJ).
-
(2) ‘High fibre’: a claim that a food is high in fibre, and any claim likely to have the same meaning for the consumer, may only be made where the product contains at least 6 g of fibre per 100 g or at least 3 g of fibre per 100 kcal (418 kJ).
Analytical methods
Since dietary fibre can be declared on labels, it must be appropriately quantified. Analytical methods for dietary fibre used in Europe and elsewhere for the purpose of food labelling have changed over the years as the definition has evolved.
The TDF method of Prosky was developed and around the year 2000, the Association of Official Analytical Chemists International (AOAC) method 985.29 became the official method for dietary fibre in numerous countries( Reference De Vries 21 ). This method requires enzymic digestion of protein and non-resistant starch, followed by precipitation of soluble fibre with 95 % alcohol, followed by weighing. The method has been improved over time and now provides quasi-exhaustive quantification of all dietary fibre, even if further modifications are still ongoing. Moreover, specific methods have been developed to quantify specific fibre types, for example oligosaccharides, RS or β-glucans (Table 7 and Fig. 2). The most commonly used methods are AOAC 985.29, 991.43, 2001.03 and 2009.01( Reference McCleary, DeVries and Rader 10 ).
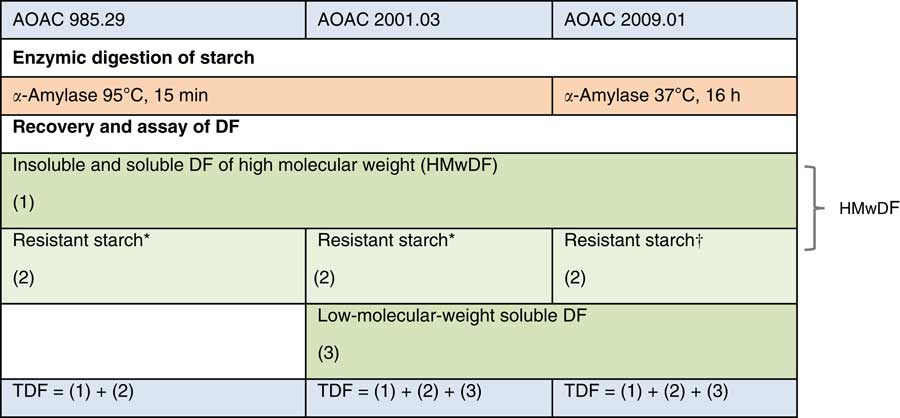
Fig. 2 Main Association of Official Analytical Chemists International (AOAC) methods for total dietary fibre (TDF) analysis (adapted from Bar-L’Helgouac’h et al. ( Reference Bar-L’Helgouac’h, Barron and Saulnier 197 )). * Method quantifies part of resistant starch (RS). † Method quantifies all RS. DF, dietary fibre.
Table 7 Principal Association of Official Analytical Chemists International (AOAC) methods for total dietary fibre (TDF) and specific dietary fibre analysis
FOS, fructo-oligosaccharides.
* Cited by McCleary et al. ( Reference McCleary, DeVries and Rader 10 ).
Before 1995, the UK used the Southgate( Reference Southgate 22 ) and Englyst( Reference Englyst, Anderson and Cummings 23 – Reference Englyst, Quigley and Hudson 25 ) methods and Sweden the Uppsala method( Reference Theander, Aman and Westerlund 26 , Reference Theander 27 ) to quantify dietary fibre in plant materials. NSP analysis proposed by Englyst et al. ( Reference Englyst, Quigley and Hudson 25 ) was accepted by the Ministry of Agriculture, Fisheries and Food (the forerunner of the present Food Standards Agency) at the time and was used for nutrition and labelling purposes in the UK until 1999. This method is also still used in McCance and Widdowson’s Table of Food Composition and hence is used in all food intake assessments in the UK. For the first time, the new version of McCance and Widdowson’s The Composition of Foods, released in August 2014, has values for both NSP and dietary fibre using the method of the AOAC, and in future intakes may be described for both methods. Recently the UK Scientific Advisory Committee on Nutrition (SACN) has recommended the UK adopt the AOAC method 2009.01, which would bring it in line with most other nations( 28 ).
Dietary fibre recommendations and permitted health claims (Tables 8, 9 and 10)
Methods used to compile tables
To collect information about recommendations for total fibre intake in Europe, and recommendations for specific fibre intakes throughout the world, a search was performed using Google and Google Scholar. Search terms were: fibre, fiber, carbohydrate, nutrient, nutrition, recommendation, and dietary reference value. Additional information was collected through personal contacts to various authorities.
An exhaustive list of health claims related to dietary fibre permitted in the EU, in the USA and in Australia/New Zealand was constructed based on data found on the EC website( 29 ) and on the Food and Drug Administration website( 30 ) and in Food Standards Australia New Zealand( 31 ).
Results
Those countries that have recommendations for fibre intake all refer to total fibre. However, some countries specify that the fibre recommendations refer to natural occurring fibre in the diet from foods such as fruit, vegetables, pulses and cereal grains. None of the countries gives recommendations for specific types of fibre.
There remains insufficient information to be able to determine an Estimated Average Requirement (EAR) and thus calculate an RDA for dietary fibre. (EAR is a nutrient intake value that is estimated to meet the requirement of half the healthy individuals in a group; RDA is the average daily dietary intake level that is sufficient to meet the nutrient requirement of nearly all (97 to 98 %) healthy individuals in a group; Adequate Intake (AI) is a value based on observed or experimentally determined approximations of nutrient intake by a group (or groups) of healthy people – used when an RDA cannot be determined.) An AI has been developed instead, based on intakes that have been observed to provide health benefits related to bowel function, maintaining or reducing blood cholesterol or modulating postprandial blood glucose response or protecting against certain diseases. Table 8 provides the recommendations (AI) for total fibre intake in different countries for different age groups. Most countries recommend a daily intake of dietary fibre of 25–35 g for adults (25–32 g/d for adult women and 30–35 g/d for adult men) and less for children and older adults depending on age, corresponding to approximately 3–4 g/MJ.
Table 8 Recommendations (Adequate Intake) for average population total fibre intake in different age groups
F, female; M, male; RI, recommended intake.
1 Insoluble fibre:soluble fibre ratio 3:1.
2 75 % insoluble, 25 % soluble.
3 Depending on physical activity.
4 NSP.
A list of health claims related to dietary fibre permitted in the EU, in the USA and in Australia and New Zealand is presented in Table 9. For the European health claims related to bowel function, the foods must be ‘high in’ the particular fibre mentioned in the claim, which means the food should provide at least 6 g/100 g or 3 g/100 kcal (418 kJ) (corresponding to at least 7 g/MJ). For claims related to postprandial glycaemia, the necessary amount of the specific fibre is generally related to the available carbohydrate in the product. For claims related to cardiovascular health, the amount varies between 3 and 10 g of the specific fibre per d. Claims for which a specific fibre intake for beneficial effect is stated could possibly be seen as a recommendation for intake of that fibre. The US health claims do not specify the types of dietary fibre, just the foods that provide the fibre.
Table 9 Authorised health claims related to dietary fibre in the European Union (EU) (European Commission 2014), in the USA (Food and Drug Administration 2013) and in Australia/New Zealand (Food Standards Australia New Zealand 2013)

RACC, reference amounts customarily consumed.
1 Provides 10–19 % of the Dietary Reference Value per RACC.
2 3 g or less per RACC and per 50 g if RACC is small; meals and main dishes: 3 g or less per 100 g and not more than 30 % of energy from fat.
3 1 g or less per RACC and 15 % or less of energy from saturated fat; meals and main dishes: 1 g or less per 100 g and less than 10 % of energy from saturated fat.
4 20 mg or less per RACC and per 50 g of food if RACC is small; meals and main dishes: 20 mg or less per 100 g.
5 Please notice: In the Federal Regulation it is specified that a claim on dietary fibre and CVD is not authorized.
6 Provides at least 6 g of fibre per 100 g or at least 3 g of fibre per 100 kcal (418 kJ).
If the substances that are the subject of health claims are considered as recommended for intake, this would suggest that there should be recommendations for intake of some subtypes of fibre, such as oats and barley fibres, which are rich in β-glucans (soluble fibres) or insoluble types like RS, cellulose, and arabinoxylans. In addition, diets containing fibre from fruit, vegetables and grains are said to be related to reduced risk of heart disease. The fibres contained in these foods are mainly pectin, cellulose, β-glucans, xylans and lignin. Likewise, extracted fibres such as chitosan, guar gum and glucomannan could be recommended based on their role in disease risk reduction. The claims for which a specific amount of a specified fibre is needed are highlighted in Table 10.
Table 10 Potential recommendations for intake of specific fibres (subtypes of fibres) based on health claims
AX, arabinoxylans.
Almost all studies that form the scientific evidence for a cause-and-effect relationship for fibre-specific claims are performed with added fibre types or bran, and, in general, responses with fibre have been compared with a control without fibre addition. In most cases, the quantity of fibre necessary for each health effect is difficult to achieve through a normal diet and the only fibre types where it might be possible to ingest a sufficient amount for a health effect through foods with their naturally occurring fibre content would be the β-glucans from oats, and perhaps barley. Since wheat bran is a common food ingredient, it is also possible to eat the amount of wheat bran fibre necessary to obtain a health effect through a normal diet.
Fibre intakes and sources in Europe from surveys and large studies (Tables 11–17)
Methods used to compile tables
A search was made of all large surveys and studies which reported dietary fibre intake where dietary assessment was conducted using a complete method, in other words, one where all foods consumed were recorded, such as 24 h recall and prospective foods records. Studies using FFQ were not included. This was done because a difference in intake of fibre-containing foods, particularly fruit and vegetables, has been seen when FFQ have been compared with complete methods, such as 24 h recalls or food diaries( Reference Dahm, Keogh and Spencer 32 ). Even when energy and macronutrient values match quite well, there can be substantial differences in fruit and vegetable intake between FFQ and other methods, resulting in important differences in fibre intake. Many of the studies included were national surveys, the reports of which were obtained online from government agencies and were not part of the published literature in the form of refereed publications. The most recent survey located was used in each country. Most surveys were produced since 2000; a few earlier reports were included if a more recent one could not be found. Other large studies, with several hundred individuals or more, were also included. In order to put the European countries in a world context, studies from other countries were also included, such as from the USA, Canada, Japan, Australia and South America. Studies were reported separately for adults, older adults, and children of varying ages, approximately 13–18 years, 4–12 years and 1–4 years old. There was also one recent survey of infants aged 4–18 months from the UK. For each study or survey, the following items were tabulated: country, year of assessment, the group being studied or the type of study, such as a national survey, age range (or mean age if only this was available), number of subjects, dietary assessment method, total fibre intake for males, females, and for both, reference, year of publication and any comments about additional information. It was intended to record dietary fibre assessment method, but so few studies mentioned this that it was omitted, and it was assumed that all studies except those from the UK used the AOAC or Prosky method. For the UK studies, dietary fibre was reported as NSP and hence RO, RS and lignin are not included. Studies from Ireland used either NSP or had figures for both methods. Results were taken as presented in the publications obtained and no attempt was made to obtain raw data.
Those studies and surveys for which information on sources of dietary fibre were provided were additionally tabulated to document these sources. Data were separated for adults of all ages and children of all ages. For each study, country, year of assessment, the groups being studied, age, sex, number of participants, reference and year of publication were recorded as before. Total fibre intake was documented, and then sources listed. Publications varied in the detail with which they provided sources and in the sources they listed. Many foods were common to all studies, such as potatoes, fruit and vegetables, but the grain or cereal products varied considerably and some studies recorded total grain products only. Efforts were made to rationalise these to allow comparisons to be made. The following were tabulated if at least three studies reported it: bread, pasta, biscuits and pastry, breakfast cereals, other grains not listed elsewhere, savoury snacks, potatoes, vegetables, legumes, fruit, sugar and confectionery, soup, nuts and seeds, meat and fish dishes. From the grain products reported, a total ‘grain products’ was calculated and a total of the percentage fibre intake was also calculated. In many cases, items with small percentages were omitted, but often these could be added to existing groups and were noted as such.
Results
A total of twenty-nine studies were found with dietary fibre intakes for adults (Table 11), ten for older adults (Table 12), sixteen for children aged 13–18 years (Table 13), twenty for children 4–12 years (Table 14) and eleven for children 1–4 years (Table 15), providing data for nearly 140 000 individuals. The National Health and Nutrition Examination Survey (NHANES) in the USA is reported every 2 years, and hence from 2000, six sets of results are available. Only the last two sets, 2007–2008 and 2009–2010, have been included for comparison with intakes from Europe. Many of the surveys provided data for both adults and children or for children of different ages. Except for young children, most studies reported results for both males and females separately but in some cases the numbers of the different sexes participating were not given and hence an average intake could not be calculated. Most studies reported results for children aged 1–4 years for both sexes together and hence this only has been tabulated. In the three surveys of young children where the sexes were reported separately, namely the Australian National Survey, the Swedish National Survey and National Health and Nutrition Examination Survey (NHANES), fibre intakes were similar for boys and girls.
Table 11 Dietary fibre (DF) intakes in adults

M, male; F, female; NA, not available; INCA-2, Individual and National Study on Food Consumption 2; AFSSA, Agence Française de Sécurité Sanitaire des Aliments (French Agency for Food Safety); SU.VI.MAX, SUpplémentation en VItamines et Minéraux Anti-oXydants; ENCAT, Evaluation of Nutritional Status in Catalonia; NHANES, National Health and Nutrition Examination Survey.
Table 12 Dietary fibre intake in older adults*
M, male; F, female; NA, not available; INCA-2, Individual and National Study on Food Consumption 2; AFSSA, Agence Française de Sécurité Sanitaire des Aliments (French Agency for Food Safety); ENCAT, Evaluation of Nutritional Status in Catalonia; NHANES, National Health and Nutrition Examination Survey.
* All studies included both males and females.
Table 13 Dietary fibre intake in children aged 13 to 18 years*

M, male; F, female; NA, not available; INCA-2, Individual and National Study on Food Consumption 2; AFSSA, Agence Française de Sécurité Sanitaire des Aliments (French Agency for Food Safety); ENCAT, Evaluation of Nutritional Status in Catalonia; NHANES, National Health and Nutrition Examination Survey.
* All studies included both males and females.
Table 14 Dietary fibre intake in children aged 4 to 12 years*

M, male; F, female; NA, not available; INCA-2, Individual and National Study on Food Consumption 2; AFSSA, Agence Française de Sécurité Sanitaire des Aliments (French Agency for Food Safety); DONALD, Dortmund Nutritional and Anthropometric Longitudinally Designed; ENCAT, Evaluation of Nutritional Status in Catalonia; NHANES, National Health and Nutrition Examination Survey.
* All studies included males and females.
Table 15 Dietary fibre intake in young children aged 0 to 4 years*
NA, not available; NDNS, National Diet and Nutrition Survey; NHANES, National Health and Nutrition Examination Survey.
* All studies included both males and females.
The age range of the studies on adults ranged mainly from 18 to 65 years, but there was considerable variation between surveys in age ranges considered as adults or older adults. The survey in Poland reported intakes for the entire age range from very young children to the elderly and is included in the table for adults. Roughly 65 % of the studies of adults used 24 h recall, often, but not always repeated. For children, prospective records were more common, used in roughly 60 % of studies. These ranged from 2 to 12 d of record.
Dietary fibre intake in adult males ranged from 15 to 25 g/d, while for females the figures were 14 to 21 g/d. The lowest figures were for Canada and the USA and therefore, in general, intakes of fibre were higher in Europe than in North America. On average, intakes for adult males in Europe were from 18 to 24 g/d and for females 16 to 20 g/d, with little variation from one European country to another. Figures were lower for the UK since these were measured as NSP, but if a conversion of 1 g NSP=1·33 g TDF is used, the intakes in the UK are similar to those in other European countries. This picture was similar for older males in Europe, with intakes ranging from 18 to 22 g/d; intakes were more varied for older females, which may relate to the age distribution of the cohort being studied since total food intake decreases with age in older age.
For the youngest age group (1–4 years), dietary fibre intake ranged from 8 to 12 g/d. It was slightly lower in the Italian study by Sette et al. ( Reference Sette, Le Donne and Piccinelli 33 ) but this age group was rather younger than the other studies. Intakes were higher in Australia than in other countries at 16·1 g/d on average for children aged 2–3 years. The study of infants aged 4–18 months was from the UK and reported intakes of NSP of 6–7 g/d (about 8 to 9 g/d as TDF), increasing with age. For children aged 4–12 years, the range in intakes was quite wide, from about 10 to 18 g/d for boys and 8 to 18 g/d for girls. Intakes in Australia were again greater than for all other studies, boys 4–8 years at 19·2 g/d and 9–13 years 23·9 g/d, and for girls, 18·0 g/d for 4–8 years and 20·7 g/d for 9–13 years. The country with the lowest intake was Argentina where a study of 10- to 12-year-olds reported intakes of about 9 g/d. For Europe, intakes were very similar from country to country, with lower values in Ireland and the UK where they were reported as NSP, but similar if converted to TDF. A Danish study from the late 1990s also had high intakes, at 22·2 g/d for boys and 19·4 g/d for girls. This may be explained by they being slightly older, with an average age of 12·5 years. Intakes of teenagers were largely similar to those of younger children, again with higher intakes in Australia. As for other ages, there were no obvious differences between areas of Europe, with intakes in countries like Spain and Italy being similar to those in Germany or Austria or Scandinavia.
Comparison of recommendations and intakes
As indicated above, recommendations for fibre intake for adults for most European countries and for countries like Australia, New Zealand and the USA are in the order of 30–35 g/d for men and 25–32 g/d for women. Overall average intakes do not reach this level of intake for any country. No recent survey for adults in Australia was found, but the surveys in children suggested that intakes are higher than in other countries. The highest average intake shown was that for the National Nutrition Survey in Germany in 2005/2006 where average intake for men was 25 g/d and for women 23 g/d. Similarly, average intake in Hungary in a recent national survey was 25·5 g/d for men and 20·9 g/d for women. Not far behind were the intakes in the national survey in Finland in 2007, FINDIET, where average intake for men was 23·7 g/d and for women 20·7 g/d. Other countries were far behind with average intakes of around 20 g/d for men and around 15 g/d for women. Recommendations for older adults are somewhat lower than for adults, at around 20 g/d for men and women. Most countries show average intakes quite close to such a recommendation, with many around 20 g/d for men and 18–20 g/d for women. A number of surveys show increased intakes with age, such as the National Diet and Nutrition Survey in the UK.
For children, recommendations vary quite markedly from country to country; for example, for those aged 10–12 years, France recommends 5+age, equivalent to 15–17 g/d, for Poland, 19 g/d, for Australia and New Zealand, 20 g/d for girls and 24 g/d for boys (for 9–13 years) and for the USA, 26 g/d for girls and 31 g/d for boys (for 9–13 years). Other countries have no official recommendation for children. Hence it is difficult to say if recommendations are being met overall, although for most countries, intakes are lower than the recommendation, with few reaching an average intake of 20 g/d for boys or 18 g/d for girls. For teenagers, recommendations are similar or slightly higher than for younger children. The only countries which have recorded intakes close to the recommendations are Australia in a national survey of 14- to 16-year-olds, and in the EskiMo project in Germany, where the average intakes for boys were about 27 g/d and for girls 21 and 24 g/d. These relatively high intakes were also seen in a study of 13- to 14-year-old sports club attenders in Chile. All other studies showed intakes of less than 20 g/d for older children, substantially lower than the recommendations in most countries.
Sources of dietary fibre
There are relatively few publications which provide detail on the types of dietary fibre consumed, such as further chemical classification, for example as specific hexoses (glucose, galactose, fucose and/or rhamnose), pentoses (arabinose and/or xylose) and/or uronic acid polymers (galacturonic and/or glucuronic acids), or cellulose, hemicelluloses and pectins, etc. or separated by other characteristics, such as solubility. Those studies that are available with such information are older than the recent surveys where total intakes were reported. Some of the recent surveys provided food sources of fibre and these were therefore tabulated for comparison. The few studies that reported sources for older adults were similar to those for adults aged 18–64 years, and hence have been omitted.
Food sources of fibre are shown in Table 16 for adults and Table 17 for children. In adults, grain products were the largest source of fibre in all countries, providing from 32–33 % of fibre intake in the USA and Spain to 48–49 % in Ireland, the Netherlands and Sweden. Some countries provided greater breakdown of grain sources, and, in these, bread was the major source, ranging from 11 to 30 % of total fibre, with much smaller contributions from breakfast cereals, from 5 to 8 %, biscuits and pastries, from 3 to 11 %, and pasta from 1 to 4 %. There were no studies with detailed breakdown of the contributions from grains from Italy where pasta may have contributed a higher proportion. Vegetables, potatoes and fruit were the next highest sources, but these varied considerably, vegetables contributing from 12 to 21 % of fibre intake, potatoes from 6 to 19 % and fruit from 8 to 23 %. These variations reflect climatic growing conditions and hence cultural norms across Europe, with cooler northern European countries tending to have greater contributions to fibre intake from potatoes and warmer southern countries greater from fruit. Other foods, such as confectionery, savoury snacks, soup, milk products and meat dishes made smaller contributions to fibre intakes.
Table 16 Principal food sources of dietary fibre in adults

NA, not available; INCA-2, Individual and National Study on Food Consumption 2; AFSSA, Agence Française de Sécurité Sanitaire des Aliments (French Agency for Food Safety); SU.VI.MAX, SUpplémentation en VItamines et Minéraux Anti-oXydants; DF, dietary fibre; ENCAT, Evaluation of Nutritional Status in Catalonia; NSHD, National Survey of Health and Development; NHANES, National Health and Nutrition Examination Survey.
Table 17 Principal food sources of dietary fibre in children

NA, not available; INCA-2, Individual and National Study on Food Consumption 2; AFSSA, Agence Française de Sécurité Sanitaire des Aliments (French Agency for Food Safety); DONALD, Dortmund Nutritional and Anthropometric Longitudinally Designed; M, male; F, female; Gr, grade; NHANES, National Health and Nutrition Examination Survey.
In children, results varied markedly even for studies in the same country. Such was the case for Belgium where one study of toddlers in Antwerp showed grains contributing 58 % of fibre intake, including 38 % from bread alone, while another of preschoolers in Flanders found 37 % from all grain products. A report of the National Health and Nutrition Examination Survey (NHANES) for 2003–2006 indicated that grains provided 44 % of fibre intake, while another of 2009–2010 found 33 %. As in adults, grains were again the major source of fibre but, with such varied figures, there must be considerable variation in how the food sources are calculated and it is difficult to give precise figures. Fruit appeared to make a greater contribution to fibre for children than for adults, with values ranging from below 10 % for older children in the UK to 26 % for children in Spain. The UK had the lowest fruit contribution compared with other European countries. Both in the UK and Australia where detailed information was provided for different age groups of children, there was a decreasing contribution to fibre intake from fruit with age, with lowest values in teenagers.
Intakes of fibre components
There are very few publications, particularly recent ones, which describe intake of dietary fibre components, as compared with total fibre. A small number of studies have reported RS intakes, as shown in Table 18, although these cannot capture RS3 which is mostly produced by home preparation and storage conditions. The information that can be obtained suggests, as shown in the Table, that many European countries are likely to have intakes of RS of about 4–5 g/d, with more where there are high intakes of pasta as in Italy. Asian countries like China have much higher intakes of about 15 g/d. By far the largest proportion of the RS comes from grain products for all the countries studied, and as expected the source of grain products varied with the type of food consumed in large amounts, such as pasta in Italy or rice in Asia.
Table 18 Intakes of resistant starch

NHANES, National Health and Nutrition Examination Survey; M, male; F, female; NA, not available.
Only four studies, three of them small, could be located which reported lignin intake using complete dietary assessment methods, not food frequency, and were all from the 1970s. They suggested that lignin intake was in the order of 1–3 g/d in Western countries.
Dietary fibre and health
This section summarises the evidence relating dietary fibre and specifically different types or sources of fibre to health, with the goal of establishing whether there is sufficient evidence to provide more detailed advice to the public on types or sources to consume based on the effects different types may have against certain health conditions. Systematic reviews were not conducted specifically for this paper, but the evidence presented is largely taken from existing systematic reviews, some of these prepared recently for the SACN review of carbohydrates, published in June 2015( 34 ).
Relationship between dietary fibre intake, fibre types and sources of fibre and risk of chronic non-communicable diseases
Since the early work of Dennis Burkitt and Hugh Trowell in the 1970s( Reference Burkitt and Trowell 35 ), it has been recognised that diets which are low in dietary fibre content are associated with poorer health. The history of interest in the health aspects of dietary fibre has gone through a number of phases, starting with exploration of impact on colonic function and short-term effects on glycaemia and regulation of blood cholesterol. More recently, associations with hard endpoints such as cancers and CVD events have been explored using data from maturing prospective cohort studies. Whilst the body of evidence from these latter studies has increased markedly in the past decade, few analyses of the relative impact of the sources of dietary fibre have been conducted. Mostly, where these have been undertaken, the sources have included vegetable, fruit and cereal sources of dietary fibre and more rarely legume fibre and nuts and seeds fibre. In addition, within the cereal fibre sources, the fibre fractions will vary markedly depending on the dominant grain type consumed (oats, wheat, rye, etc.) due to their differing composition. This variation in grain type may be at the heart of some of the differences between studies in terms of risk association with cereal fibre from country to country, since the staple grain consumed varies markedly by geographical region.
Methods used to compile tables
Due to the huge amount of scientific literature, this paper assessed the current situation using reviews, pooled analyses and latest results from the European Prospective Investigation into Cancer and Nutrition (EPIC) if they have not been integrated into an existing meta-analysis. For cancer outcomes, the 2007 report for the World Cancer Research Fund (WCRF)( 36 ) and WCRF Continuous Update Project( 37 ) were used as the primary source of information. For cardiometabolic outcomes, the UK SACN Carbohydrates and Health report (2015) was the primary source( 34 ). Priority was given to meta-analyses of randomised controlled trials and prospective cohort studies over case–control studies, except for outcomes where no other evidence exists.
A search was made using PubMed using the following search terms: systematic review, meta-analysis, dietary fiber, dietary fibre, cereal fibre, vegetable fibre, fruit fibre, legume fibre, EPIC, European Prospective Investigation into Cancer. Only papers in English and published in the last decade were used.
Results
Table 19 lists the results, where available, of the most recent dose–response meta-analyses identified of dietary fibre, dietary fibre sources and disease outcomes. For further detail of the methodology of dose–response meta-analyses, please refer to Berlin et al. ( Reference Berlin, Longnecker and Greenland 38 ). The pooled estimate of risk for each disease outcome was represented for each incremental unit consumed, along with the 95 % CI around that estimate. The latter provides an indication of the statistical significance of the pooled risk estimate. It can be seen that none of the pooled estimates indicates a positive association, that is, all suggest either a lack of association (risk estimate close to unity) or a negative association (increasing consumption of dietary fibre or fibre source is associated with a lowering of risk, risk estimates markedly less than unity). Accordingly, where a statistically significant negative association has been reported, this has been indicated (*) to permit identification of any pattern around the relative associations by disease outcome and fibre source. Meta-analyses in which pooled estimates are derived comparing risk in the highest category of consumers with those in the lowest are also discussed in the text, but these estimates are not included in Table 19. Compared with the dose–response meta-analysis, this approach has the disadvantage that depending on the populations included, the amounts of dietary fibre consumed in these comparator groups may vary greatly between studies.
Table 19 Dose–response meta-analyses outcomes of total, fruit, vegetable, cereal and legume sources of dietary fibre and health outcomes in prospective cohort studies

n, Number of prospective studies included; g/d, unit of increment of dietary fibre; RR, relative risk; NA, pooled estimate not available – too few studies or excessive heterogeneity between studies; SACN, Scientific Advisory Committee on Nutrition.
* Risk estimates are statistically significant, and indicate lower risk with increasing consumption.
All-cause mortality
In terms of all-cause mortality risk, a recent meta-analysis using seven prospective cohort studies observed an 11 % reduction in mortality risk for each 10 g/d increment of dietary fibre consumed (95 % CI 0·85, 0·92)( Reference Kim and Je 39 ). When comparing the highest (mean approximately 27 g/d) and lowest (mean approximately 15 g/d) fibre intake groups, the pooled estimate indicated a 23 % lower risk in the highest consumers after adjustment for major recognised confounding variables.
Kim & Je( Reference Kim and Je 39 ) located fewer studies providing risk estimates for all-cause mortality in relation to the source of dietary fibre. However, they were able to pool the cohort-derived risk estimates for cereal fibre, vegetable fibre and fruit fibre based on the results from three, two and two studies, respectively( Reference Kim and Je 39 ). Overall, the strongest inverse associations were observed with increasing cereal fibre consumption (8 % reduction in risk per 10 g/d), with weaker associations being observed for vegetable and fruit sources. These results should, however, be treated with caution for a number of reasons. First, the number of studies included in the meta-analyses of fibre sources was very small. Furthermore, fatality as an outcome is limited with regard to informing about the role of diet in disease prevention since it includes both disease incidence and subsequent survival. It is possible that high-fibre diets may have an impact differently on incidence and survival, since their underlying pathologies may differ. Indeed, associations do appear to be different considering fatal and non-fatal CVD outcomes in relation to dietary fibre intake( Reference Bazzano, He and Ogden 40 , Reference Pietinen, Rimm and Korhonen 41 ). Mortality is not an ideal outcome therefore to judge whether a dietary exposure may make an impact on disease prevention per se. Nonetheless, the meta-analyses of Kim & Je( Reference Kim and Je 39 ) are useful in terms of hypothesis generation and for comparison with summary estimates of risk of specific disease incidence in relation to dietary fibre consumption.
Cardiometabolic health
CVD
With a strong relationship with unhealthy lifestyles, including tobacco smoking, low levels of physical activity and poor diets, the WHO has estimated that over three-quarters of CVD deaths may be preventable by appropriate lifestyle change( 42 ). One such change may be adherence to a dietary pattern encompassing a range of high-fibre foods which may make an impact on reducing CVD risk through reduction in recognised CVD risk factors such as raised blood cholesterol, hypertension, systemic inflammation, impaired glucose tolerance and elevated body fat( Reference Buttriss and Stokes 43 ). A recently published systematic review and meta-analysis of seventeen cohort studies that provided risk estimates for incident fatal events of CVD in relation to intakes of total fibre and fibre sources confirmed the association between low dietary fibre consumption and increased risk of CVD( Reference Threapleton, Greenwood and Evans 44 ). Random-effects dose–response meta-analyses were conducted by pooling provided or derived dose–response trends for each included cohort. The pooled estimate of risk was then expressed for each increment of dietary fibre based on one standard deviation of mean intakes in European populations which, for TDF, was for each 7 g/d consumed. This approach was undertaken for CVD events, and separately for CHD events, and in a further publication for cerebrovascular (stroke) events( Reference Threapleton, Greenwood and Evans 44 , Reference Threapleton, Greenwood and Evans 45 ). The pooled estimates of risk are included in Table 19, and for TDF intake indicate a reduction in risk of these CVD events between 7 and 9 % for each 7 g/d increment consumed.
The relationship between fibre sources and risk of CVD events was similar for total CVD outcomes, coronary, and cerebrovascular events, notwithstanding the limited number of studies available for certain analyses. Overall, intakes of cereal and vegetable fibre sources, and insoluble dietary fibre were more strongly associated with lower risk of CVD, CHD and stroke than fruit fibre and soluble dietary fibre (see Table 19).
CVD risk factors
Hypertension/blood pressure
Two reviews of randomised controlled trials of fibre and blood pressure were published in 2005 by Streppel et al. ( Reference Streppel, Arends and Van’t Veer 46 ) and Whelton et al. ( Reference Whelton, Hyre and Pedersen 47 ). Both described a significant inverse relationship between fibre consumption and blood pressure, with reductions in blood pressure by 1–2 mmHg with fibre supplementation. Greater reductions were observed in older, more hypertensive populations. Whelton et al. ( Reference Whelton, Hyre and Pedersen 47 ) also described some evidence of a greater magnitude of reduction with fruit and vegetable sources of dietary fibre rather than grain sources, although this finding was based on a very limited number of studies (four and nine trials, respectively). More recently, randomised controlled trials with blood pressure outcomes that were of at least of 6 weeks’ duration were identified by Evans et al. ( Reference Evans, Greenwood and Threapleton 48 ), and pooled in random-effects meta-analyses. No overall reduction in blood pressure was found when the results of all eighteen trials were pooled, comparing high- and low-fibre intervention groups regardless of dietary fibre type. However, diets rich in β-glucans were found to reduce systolic blood pressure by 2·9 mmHg and diastolic blood pressure by 1·5 mmHg for a median difference in β-glucans of 4 g/d.
Hyperlipidaemias
In 1999, Brown et al. ( Reference Brown, Rosner and Willett 49 ) undertook a meta-analysis of sixty-seven trials that demonstrated a reduction of total cholesterol by 0·047 mmol/l, and LDL-cholesterol by 0·057 mmol/l with daily consumption of fibre isolates or fibre-enriched products containing 2–10 g of soluble fibre provided by pectin, guar gum, psyllium and oat bran. Similar findings, albeit using narrower trials inclusion criteria, were reported in the evidence reviews prepared for the SACN Carbohydrate Working Group( 34 ). Total and LDL-cholesterol were lowered by supplementation with mixed, soluble types of dietary fibre, and total and LDL-cholesterol and fasting TAG levels were significantly lowered by supplementation with oats, oat bran or β-glucan-supplemented diets. Other types of dietary fibre supplementation did not consistently reduce blood lipids in these trials of normolipidaemic individuals. Some of this evidence forms the basis for the authorised health claims that certain fibre types, including β-glucans from oats and barley, pectin, guar gum and chitosan, may contribute to the maintenance of normal blood cholesterol concentrations (see Table 20).
Table 20 Authorised health claims related to dietary fibre in the USA and in the European Union (EU)( 195 )

RACC, reference amounts customarily consumed.
1 Provides 10–19 % of the Dietary Reference Value per RACC.
2 1 g or less per RACC and per 50 g if RACC is small; meals and main dishes: 3g or less per 100 g and not more than 30 % of energy from fat.
3 1 g or less per RACC and 15 % or less of energy from saturated fat; meals and main dishes: 1 g or less per 100 g and less than 10 % of energy from saturated fat.
4 20 mg or less per RACC and per 50 g of food if RACC is small; meals and main dishes: 20 mg or less per 100 g.
5 Please notice: in the Federal Regulation it is specified that a claim on dietary fibre and CVD is not authorised.
6 Provides at least 6 g of fibre per 100 g or at least 3 g of fibre per 100 kcal (418 kJ).
Type 2 diabetes
Some of the earliest studies of the effects of dietary fibre on health were concerned with its modulation of blood glucose and insulin, and as listed in Table 20, there is sufficient evidence to support a number of authorised health claims that certain types of dietary fibre, including arabinoxylan, β-glucans from oats and barley, and pectins if consumed within a meal, may contribute to the reduction of the blood glucose rise after that meal. Furthermore, two systematic reviews of prospective cohort studies, with dose–response meta-analyses, of the association between dietary fibre and risk of type 2 diabetes mellitus have been published recently that indicate a reduction in long-term risk( Reference Threapleton, Greenwood and Evans 50 , Reference Yao, Fang and Xu 51 ). Both used similar methodologies, though with eleven and seventeen prospective cohort studies, respectively, and equally concluded that there is clear evidence of diminishing risk of type 2 diabetes mellitus with increasing consumption of TDF (approximately 6 % reduction in risk with each additional 7 g daily consumption; see Table 19). Similarly, both reviews reported that fibre from cereals was associated with reduced diabetes risk. With each 7 g/d consumed, Threapleton et al. ( Reference Threapleton, Greenwood and Evans 50 ) reported that risk was reduced by 21 %, although there was evidence of considerable heterogeneity between studies. Both insoluble and soluble fibres were separately associated with lower risk but no associations were observed when studies reporting fibre from fruits or from vegetables were separately examined.
Obesity (energy intake and appetite)
Early studies conducted by Haber et al. ( Reference Haber, Heaton and Murphy 52 ), in which eating rate and satiety were assessed following consumption of equi-energetic loads of whole apples, apple purée and juiced apples, highlighted the importance of cell structure integrity, energy density and dietary fibre meal content on appetite control. In this study, these factors were inter-linked, but later studies have attempted to determine the influence of dose, source, fibre type and mode of delivery of dietary fibre (whole foods, foods enriched with dietary fibre and fibre isolated from the cell matrix) on appetite control and body weight management. Despite some evidence of biologically plausible mechanisms for a reduction in appetite with consumption of certain types of dietary fibre, one recent systematic review exploring the effects of fibre on energy intake and subjective appetite ratings has concluded that collectively, acute studies comparing dietary fibre interventions with a lower- or no-fibre control show limited effects of fibre( Reference Clark and Slavin 53 ). However, in the region of 22–39 % of interventions found evidence of either reduced energy or food intake or motivational ratings. These studies utilised β-glucan, lupin kernel fibre, rye bran, whole grain rye, or a mixed high-fibre diet.
Wanders et al. ( Reference Wanders, van den Borne and de Graff 54 ) also conducted a thorough systematic review of dietary fibre intervention studies assessing appetite, acute and long-term energy intake or body weight, with interventions grouped according to chemical structure and physicochemical properties (viscosity, solubility and fermentability). Overall, they reported that the effects of fibre interventions were relatively small (average reduction in energy intake and body weight was 0·15 MJ/d, and 0·4 % per 4 weeks, respectively) and there was little evidence of any dose–response relationships. They observed a disparity in the relative effects of different types of dietary fibre on short- and long-term outcomes (energy intake and body weight). In the longer-term studies, arabinoxylan-rich fibres (mainly from grains), fructans and RS were most strongly linked to reduced energy intake, although in acute studies the most potent types were pectins and most glucans. In terms of impact on body-weight reduction, yet further different types of dietary fibre were most potent (chitosan, dextrin and marine polysaccharides). However, more viscous types of fibre (such as guar gum, β-glucan and pectin) were associated with reduced appetite more often than non-viscous fibres.
Very few intervention studies have been conducted employing a whole-diet approach, most having a functional food approach, with exploration of dietary fibre types through the use of fibre isolates delivered as supplements or incorporated into specific food vehicles. Given the wide variability in physicochemical properties of such isolates, the variation in dose employed and extent of mixing of the fibre to energy sources in the rest of the diet, it is therefore not surprising that the majority of studies have failed to demonstrate a marked impact on energy intake and/or body weight. It is difficult to translate the action of specific fibre isolates into guidance around which sources of fibre may be most effective for appetite management or weight control.
Observational evidence for the effects of different sources or types of dietary fibre on body weight management is rather limited and inconsistent in terms of strength of association. In participants of the Finnish Diabetes Prevention Study( Reference Lindstrom, Peltonen and Eriksson 55 ), mean weight losses and waist reduction over 3 years of follow-up were greater with increasing intakes of dietary fibre in a clear step-wise manner. However, the impact of different sources of dietary fibre was not described. There is some evidence from pooled data from five EPIC centres that individuals with higher total and grain fibre intakes experienced smaller annual weight gains( Reference Du, Boshuizen and Forouhi 56 ). Over the 6·5-year follow-up, for each 10 g greater intake of total fibre, weight gain was less by 39 g/year in the 89 000+ European participants. This apparently small annual improvement may potentially contribute to significantly greater lifetime weight stability in higher fibre consumers. For grain sources of dietary fibre, the association was somewhat stronger at –77 g/year for each additional g consumed. This body weight-related association was not observed for fruit or vegetable sources of dietary fibre, but total and all sources of fibre were associated with lower annual waist circumference gains.
Gastrointestinal health
Constipation and faecal weight
Constipation is one of the most common gastrointestinal complaints in Europe, with estimates of prevalence ranging from 5 to 35 % of the general population depending on the definition criteria used( Reference Peppas, Alexiou and Mourtzoukou 57 ). Definitions generally encompass aspects of defecation frequency with or without measures of stool consistency( Reference Peppas, Alexiou and Mourtzoukou 57 ). Although the causes of constipation are variable, including consequences of diseases, medication effects, increasing age and lifestyle aspects including dietary habits and physical activity, dietary fibre plays a clear role in maintaining gastrointestinal health through increasing faecal weight.
In 2007, Elia & Cummings( Reference Elia and Cummings 58 ) summarised the results of 150 separate studies published between 1932 and 1992 on the effects of various types and sources of dietary fibre on faecal weight in humans. The summary results, expressed as the weighted mean increase in stool weight per g of fibre fed, indicate the greatest increase in faecal weight with raw wheat bran, which for each 1 g consumed, increases wet stool weight by 7·2 g. Cooked wheat bran is somewhat less effective (4·4 g/g), as were other cereal sources (oats 3·4 g/g and maize 2·9 g/g)( Reference Dukas, Willett and Giovannucci 59 ). Fruit and vegetable sources were also very effective at increasing faecal weight (6 g/g), but soya and other legume fibre and pectin feeding generated the smallest increases (1·5 and 1·3 g/g, respectively)( Reference Dukas, Willett and Giovannucci 59 ). Some of this evidence forms the basis for the authorised health claims listed in Table 9 for increasing faecal bulk.
Despite long-standing evidence of an impact of dietary fibre on faecal weight, reports of an association between dietary fibre and risk of constipation are sparse and inconsistent( Reference Dukas, Willett and Giovannucci 59 , Reference Markland, Palsson and Goode 60 ). Yang et al. ( Reference Yang, Wang and Zhou 61 ) undertook a meta-analysis of five good-quality randomised controlled trials that compared the effects of dietary fibre interventions with placebo in patients with constipation. Three of the included randomised controlled trials used glucomannan, one wheat bran, and one cocoa husk. One of the five studies was on adults, the others on children. The studies were therefore rather heterogeneous in nature. Despite this, results indicated an increased bowel movement frequency per week in the fibre-treated group compared with the placebo group (OR 1·19; P<0·05), with no significant heterogeneity among the studies. The authors concluded that dietary fibre intake can increase stool frequency in patients with constipation. The evidence for an impact of dietary fibre on stool consistency, treatment success, laxative use and painful defecation is limited, and inconsistent.
A small number of observational studies have explored the relationship between dietary fibre and bowel frequency or risk of constipation. A cross-sectional study( Reference Sanjoaquin, Appleby and Spencer 62 ) of more than 20 000 men and women from EPIC-Oxford reported that NSP intake was significantly associated with having seven or more bowel movements per week, the OR being 1·43 for women who consumed >20·9 g/d compared with those who consumed <11·3 g/d. However, there was no further analysis of the sources of dietary fibre( Reference Sanjoaquin, Appleby and Spencer 62 ). Using detailed dietary data from more than 10 000 middle-aged women in the UK Women’s Cohort Study, and follow-up information on stool frequency and consistency, Alrefaai et al. ( Reference Alrefaai, Cade and Burley 63 ) observed a 40–50 % reduction in the odds of constipation in women in the highest NSP intake quintile compared with the lowest. Further exploration of the association between constipation and sources of dietary fibre in this prospective follow-up analysis found that constipation odds were significantly lower with increasing consumption of all sources of dietary fibre (cereal, fruit, vegetable and legume), using a constipation definition based on faecal frequency. When employing a definition based on both frequency and consistency, however, the odds for constipation were statistically lower only for vegetable sources of fibre (OR 0·42; P<0·01) when comparing the highest consumers with the lowest.
Diverticular disease
Diverticular disease occurs when small pouches (diverticula) develop in the wall of the large bowel at points of weakness, caused by excessive intra-luminal pressure. These diverticula may become inflamed, may bleed and, in complicated cases, form abscesses, fistula, cause bowel obstruction, peritonitis and septicaemia. Diverticular disease was one of the first conditions that Painter & Burkitt( Reference Painter and Burkitt 64 ) highlighted in the 1970s as being potentially linked to low dietary fibre consumption. A relatively small number of cohort studies have subsequently explored the relationship between dietary fibre intakes and risk of diverticular disease; these have consistently found evidence of a lower incidence with higher total fibre consumption( Reference Aldoori, Giovannucci and Rimm 65 – Reference Crowe, Balkwill and Cairns 67 ). In the most recent analysis conducted using participants of the UK-based Million Women study, Crowe et al. ( Reference Crowe, Balkwill and Cairns 67 ) reported a 25 % lower risk of diverticular disease in women consuming 18·6 g/d compared with the women in the lowest consumption quintile (9·5 g/d or less). In this and other cohort studies, there have also been indications of difference in risk according to source of dietary fibre. After adjustment for other sources of dietary fibre, Crowe et al. found the greatest reductions in risk with dietary fibre derived from cereal and fruit sources (per 5 g/d increment, relative risk (RR) 0·84, and 0·81, respectively), but no association with non-potato, vegetable fibre (RR 1·03) and an increased risk with potato fibre (RR 1·04)( Reference Crowe, Balkwill and Cairns 67 ).
Oesophageal cancer
Dietary fibre has been suggested as a potentially protective dietary component with regard to cancer of the oesophagus due to its likely role in the prevention of obesity and amelioration of symptoms of gastro-oesophageal reflux. Coleman et al. ( Reference Coleman, Murray and Hicks 68 ) undertook a systematic review and meta-analysis of the relationship between dietary fibre and the risk of precancerous lesions and cancer of the oesophagus. Using eight case–control studies, the pooled estimate of risk indicated a significant inverse association with the highest TDF intakes (OR 0·66). Just two studies explored fibre from specific food groups and the risk of oesophageal adenocarcinoma. Whilst vegetable and cereal fibre sources tended to be inversely associated with risk, no consistent associations were observed with fruit fibre sources. However, overall, too few studies provided data on the food groups contributing to dietary fibre intakes to permit conclusions to be drawn.
Gastric cancer
Zhang et al. ( Reference Zhang, Xu and Ma 69 ) recently explored whether TDF, or source and type of fibre is associated with risk of gastric cancer by pooling the risk estimates from two prospective cohort and twenty-four case–control studies( Reference Zhang, Xu and Ma 69 ). With each study design, there was an inverse association with dietary fibre intake, though the size of effect was greater for the case–control studies (OR 0·53) than cohort (RR 0·89) when comparing the highest with the lowest intake categories. In the comparisons by source of dietary fibre, the pooled OR of four to six studies were all inverse and statistically significant (for cereal fibre, 0·58; for fruit fibre, 0·67; for vegetable fibre, 0·72). The OR for insoluble and soluble types of fibre were similar (0·42 and 0·41, respectively).
Colorectal adenomas and colorectal cancer
The WCRF report( 70 ) on updated evidence for colorectal cancer was published in 2011, and the resultant meta-analysis for the relationship between incident colorectal cancer risk and TDF intake included fifteen prospective cohort studies. For each 10 g/d of TDF consumed, the risk of colorectal cancer was decreased by 10 %. This led to the conclusion that the evidence is convincing that high-fibre-containing foods decrease the risk of colorectal cancer. Sources of fibre in relation to risk of colorectal cancer risk were also explored in ten cohort studies, and whilst the summary risk estimates for all sources (cereal, fruit, vegetable) tended to be lower with increased consumption, only in the case of cereal fibre was this statistically significant (summary RR 0·90). For whole grains there was a 21 % decreased risk per three servings per d for colorectal cancer and 16 % decreased risk for colon cancer.
More recently, and since the publication of the meta-analysis by Aune et al. ( Reference Aune, Chan and Lau 71 ), the results from EPIC on the relationship between total and fibre sources and risk of colorectal cancer have been published( Reference Murphy, Norat and Ferrari 72 ). After 11 years of follow-up, in which more than 4000 cases occurred, a 13 % reduction in risk for each 10 g/d increment consumed was observed. With regard to the source of dietary fibre, similar reductions in colon cancer risk were found for cereal, fruit and vegetable fibre. However, for rectal cancer the associations were statistically significant only for cereal sources of dietary fibre.
With regard to the relationship between dietary fibre consumption and development of colorectal cancer precursor lesions, Ben et al. ( Reference Ben, Sun and Chai 73 ) undertook a random-effects meta-analysis of twenty case–control studies that reported the risk of colorectal adenoma incidence in relation to total fibre, fruit, vegetable and cereal sources of dietary fibre. The summary relative risks were broadly supportive of the findings for colorectal cancer risk, although the evidence base was more limited and was dominated by case–control, rather than prospective cohort, studies. The summary RR of colorectal adenoma were 0·84 for fruit fibre (six studies), 0·93 for vegetable fibre (six studies), and 0·76 for cereal fibre (nine studies) in analyses comparing the highest v. lowest intake groups. Thus, whilst there is apparent benefit in consuming a high-fibre diet generally with regard to reduction in risk of colorectal cancer and its precursors, cereal sources of dietary fibre seem to be particularly beneficial compared with fruit and vegetable sources.
Neoplastic diseases other than gastrointestinal tract
Breast cancer
According to the WCRF Second Expert Report( 37 ), the relationship between dietary variables and risk of postmenopausal breast cancer, other than the well-recognised positive association with adiposity and alcohol, is generally rather variable and weak. However, in a subsequent publication prepared by members of the WCRF continuous update project team, prospective cohort study results published up to August 2011 were pooled, permitting the synthesis of results from sixteen studies( Reference Aune, Chan and Greenwood 74 ). This revealed an inverse association between dietary fibre intake and breast cancer risk (in the dose–response analysis, a 5 % reduction in risk for each 10 g/d of dietary fibre consumed) and some apparent differential influence of the sources of dietary fibre on extent of risk reduction (see Table 19). The summary relative risks for all sources of dietary fibre were less than unity, but were not individually statistically significant. Soluble dietary fibre was associated with a lower summary risk estimate for each 10 g/d consumed (RR 0·74).
Endometrial cancer
It has long been recognised that dietary habits are associated with risk of endometrial cancer, with strong evidence that obesity is a major risk factor( Reference Kaaks, Lukanova and Kurzer 75 ). Less research has been conducted on the role that dietary fibre consumption may play, despite the fact that it may modulate insulinaemia and insulin resistance and reduce the risk of type 2 diabetes, all of which are aetiologically implicated in endometrial cancer( Reference Hjartaker, Langseth and Weiderpass 76 ). However, results from 288 428 women in the EPIC cohort( Reference Cust, Slimani and Kaaks 77 ), which identified 710 incident cases diagnosed during a mean 6·4 years of follow-up, suggested no association between TDF consumption and endometrial cancer risk. Data on sources of dietary fibre were not reported. In 2007, Bandera et al. ( Reference Bandera, Kushi and Moore 78 ) also undertook a synthesis of the epidemiological studies available at that time. Their dose–response meta-analysis of seven case–control studies contrasted with the results from EPIC, and the other prospective cohort study identified in that review( Reference Jain, Rohan and Howe 79 ). The summary pooled estimate was indicative of a reduction in risk with increasing TDF consumption (RR 0·82, per 5 g/1000 kcal (4184 kJ)). Whilst some of these individual studies reported associations for specific sources or types of dietary fibre, overall the results were too few, and too inconsistent to permit any conclusions about whether associations vary by fibre source or type.
Prostate cancer
To date, there are few links between the incidence of prostate cancer and dietary variables, and limited exploration of the relationship between dietary fibre consumption and risk of the disease. The WCRF Second Expert Report, published in 2007( 37 ), located just one cohort study and eighteen case–control studies, with no evidence of association in the majority of the studies, and inconsistencies in direction of association.
Pancreatic cancer
In the WCRF Second Expert Report, published in 2007( 37 ), only two case–control studies were identified that described the association between sources of dietary fibre and risk of pancreatic cancer. A meta-analysis was not conducted and the inconsistent results from these two studies that were conducted in the USA and Canada did not indicate a clear impact of dietary fibre source on risk( Reference Howe, Jain and Miller 80 , Reference Silverman, Swanson and Gridley 81 ).
Ovarian cancer
The WCRF/American Institute for Cancer Research (AICR) Continuous Update Project systematic review of the Associations between Food, Nutrition and Physical Activity and the Risk of Ovarian Cancer, which was published in 2013( Reference Norat, Aune and Rosenblatt 82 ), provided a dose–response pooled estimate of the risk of incident ovarian cancer in relation to TDF intake. Three cohort studies, with 566 cases overall, were included in a random-effects meta-analysis, with no evidence of heterogeneity between the studies. The pooled estimate for each 5 g/d increment of TDF was 0·94, indicating no association. However, the number of included studies was very small and the overall number of cases rather low. Accordingly, the WCRF panel judged that the evidence was limited and that no conclusion could be drawn on the strength of causality of the association( Reference Norat, Aune and Rosenblatt 82 ). No meta-analyses of dietary fibre source were reported here or elsewhere.
Renal cancer
Kidney cancer (which is mainly renal cell carcinoma) is among the 10th most common presenting cancers in the Western world, with suspected lifestyle and dietary aetiology( Reference Ferlay, Parkin and Steliarova-Foucher 83 , Reference Ljungberg, Campbell and Cho 84 ). Relatively few studies have addressed potential associations with dietary fibre consumption, but a recent review by Huang et al. ( Reference Huang, Ding and Chen 85 ) synthesised the evidence from two cohort and five case–control studies in a meta-analysis. When comparing highest against lowest dietary fibre consumers, the pooled estimate of risk for renal cell carcinoma indicated a lowering of risk in the highest TDF consumers, with also some differential associations according to source of dietary fibre (greatest risk reductions for fibre from legume and vegetable sources, rather than grains or fruit). However, using a dose–response meta-analysis approach, the authors were unable to report any evidence of diminishing risk with increasing intakes of dietary fibre. This points to the need for further, large prospective cohort studies to explore potential links between dietary habits and kidney cancer.
Summary of evidence linking total dietary fibre consumption and fibre sources to cardiometabolic disease and risk factors
Multiple prospective cohort studies have provided evidence that individuals consuming diets rich in dietary fibre have a lower risk of CVD, including both CHD and cerebrovascular disease outcomes. Pooled risk estimates derived from meta-analyses indicate that for each additional 7 g dietary fibre consumed, the risk of CVD is reduced by about 7–9 %. With regard to the strength of association for major sources of dietary fibre, there is consistent evidence of a reduction in risk of CVD with grain sources, some evidence for a reduction with vegetable sources, but little suggestion that fruit sources are associated with reduced risk. Too few studies have explored the association with legume sources to permit conclusions to be drawn. With regard to risk of type 2 diabetes incidence, as with CVD risk, the evidence is most conclusive for a reduction in risk with grain sources, rather than fruit or vegetable sources.
There are multiple potential mechanisms through which sources of dietary fibre may make an impact on CVD risk, and data from intervention studies have provided evidence of effects via impact on CVD risk factors, including reduction in blood pressure and blood lipids. However, the majority of trials exploring CVD risk factors have utilised dietary fibre isolates, such as gums, brans and other fibre extracts rather than investigating the effects of food sources per se. Obesity is a well-recognised risk factor for increasing risk of CVD; however, despite some evidence of increased satiety with consumption of certain viscous types of dietary fibre, there is a lack of definitive evidence that particular sources of dietary fibre make an impact differentially on energy intake or body weight, at least in the short term. Longer-term observational studies are supportive of a greater impact of grain sources of dietary fibre rather than fruit and vegetable sources, but as with all observational study associations there remains uncertainty around whether the links exist due to associated lifestyle correlates, such as greater levels of physical activity or another property of the high fibre sources such as displacement of high-energy foods.
Summary of the evidence on total dietary fibre and sources of fibre on gastrointestinal health
Human feeding studies indicate that fruit, vegetable and grain sources are all effective at increasing faecal weight, with the greatest benefits being achieved from grain and vegetable sources. Data on constipation risk or alleviation of symptoms of constipation are more sparse, but generally supportive of the feeding trials which found that vegetable sources of fibre have a strong impact on faecal weight. In terms of gastrointestinal tract disease, diverticular disease risk appears to be lower in high fibre consumers generally, and particularly in those obtaining fibre from grain and fruit sources. With regard to cancers of the gastrointestinal tract, the evidence base is strongest for cancers of the colon and rectum, and here there is evidence suggestive of a causal association with both total and particularly grain sources of dietary fibre, the latter particularly so for cancers of the rectum and for the precursor lesion, colorectal adenoma. Fewer prospective cohort studies have been conducted on the risk of oesophageal and gastric cancers, but there is some evidence of a lower risk of these neoplastic diseases in higher total fibre consumers and some indication that grain and vegetable sources of dietary fibre are beneficial.
Summary of the evidence on total dietary fibre, sources of fibre and neoplastic disease of non-gastrointestinal sites
Overall, the evidence relating dietary fibre and fibre sources to the risk of neoplastic diseases at sites other than the gastrointestinal tract is weak. This is because generally fewer studies have been conducted, and meta-analyses are therefore based on smaller numbers of studies and often include both prospective cohort as well as case–control studies, with the inherent risk of respondent bias in dietary reporting. Results are generally less consistent or based on too few studies on which to base an opinion. However, there does seem to be some evidence of a lower risk of breast cancer with increasing TDF consumption, but little evidence of a substantially greater risk reduction by source or type of dietary fibre.
Discussion
This project set out to provide the current state of knowledge about the definitions, sources, recommendations, intakes and health effects of dietary fibre around Europe. Overall, through much searching of national websites and Government publications, as well as the refereed published literature, a comprehensive overview of the state of fibre knowledge has been acquired, which may be of use to researchers or authorities looking to review or revise guidelines on dietary fibre in their respective countries or overall in Europe. A recent review of health effects of carbohydrates published by the SACN in the UK( 34 ) has been particularly helpful for summarising the situation regarding health effects and this plus the WCRF report from 2007, plus updates, dispensed with the need to carry out a review of the original literature of the relationships between fibre and health. Other aspects of the review, however, required considerable searching of websites and contact with authorities to find up-to-date information about definitions and analyses used, recommendations, health claims, and intakes from national surveys. The work has been a joint effort of all the authors, each undertaking a different aspect of the review and analysis.
In terms of definitions, there is now substantial agreement throughout the world to include within the dietary fibre definition, intrinsic and non-digestible carbohydrates from fruit, vegetables, cereals and tubers and non-digestible compounds associated with cell walls and quantified by most accepted analytical methods, as well as non-digestible carbohydrates obtained by synthesis or modified by enzymic, chemical or physical means when scientific evidence of beneficial physiological effects on health is provided. There is still discussion about whether or not to include RO (non-digestible) of degree of polymerisation 3–11, intrinsic to plant foods or obtained by extraction, synthesis or modified by enzymic, chemical or physical means. While perfect uniformity would be desirable, this is a step forward from earlier decades when the definition of dietary fibre occupied many hours of debate at scientific conferences and extensive commentary in the literature.
Depending on their degree of polymerisation, chemical composition and linkages, dietary fibre sources have varying physicochemical characteristics, such as solubility and viscosity and physiological properties, including fermentability, bulking effects, blood glucose-lowering and blood lipid-modifying effects which can explain their beneficial impacts on health. However, there remain huge gaps in our knowledge about the relationships between the chemical and physical characteristics of dietary fibre types and their physiological properties to be able to explain their effects on disease risk. In other words, the mechanistic links between the chemistry and physical nature of fibre and the subsequent impacts on health remain underexplored and there is a great need to fill these gaps in our understanding. There is also a need for adequate characterisation (qualitative and quantitative) in food composition databases of all fibre sources used in nutrition research. This would allow correct estimates of fibre intakes, so recommendations about types of fibre to consume could be based on much firmer evidence than is currently possible.
Throughout Europe the recommendation for total fibre intake is about 3–4 g/MJ per d, corresponding to 25–32 g/d for adult women and 30–35 g/d for adult men, and less for children and elderly depending on age. Most countries have developed their recommendations on an amount per MJ and extrapolated to g/d. This is partly due to the reasoning used in developing the recommendations in terms of the disease entities considered. Some have used CHD as the main disease examined, while other countries, most specifically the UK, developed their recommendation on the effect on colonic function which is unrelated to energy intake and hence the amount recommended does not vary with energy intake nor by sex. As mentioned by the EFSA Panel on Dietetic Products, Nutrition and Allergies( 86 ), a fibre intake of 25 g/d would be adequate for normal laxation in adults (and 2 g/MJ in children) whereas more than 25 g/d would be necessary to reduce risk of CHD, type 2 diabetes and improved weight maintenance. Fibre recommendations based on energy intake result in larger amounts needed by young males compared with females and lesser amounts for older adults who consume less energy, but this may or may not be appropriate. A clear challenge to a recommendation based on energy can be seen in the requirements in older age where more fibre may be needed to compensate for impaired gastrointestinal function with age. Some examination of the recommendations based on energy intake is therefore warranted and is further emphasised by the fact that in most countries fibre intakes did not reach the recommended average intakes and in many cases were a long way distant. This is particularly the case where the recommendation is high because of the energy intake it accompanies. It has also been found in some surveys where multiple age groups have been studied that intakes of dietary fibre match the recommendations more closely in some age groups and this may simply be because energy intakes are lower in that group. It may therefore be worthwhile to re-examine fibre recommendations set as a function of energy and in particular recommendations for older age.
No recommendations were found for intake of specific fibre types in any countries. However, approved health claims on fibre-containing foods in the EU would suggest that an intake of the naturally occurring β-glucans from oats and barley of 3 g/d, wheat fibre/arabinoxylan of 10 g/d, pectin of 6 g/d, and RS replacing 14 % of total starch could be recommended. However, these amounts would largely be difficult to achieve through foods with naturally occurring fibre content. What also needs to be taken into consideration is that the health claims permitted for several materials are for the same physiological effect or health benefit. Such is the case for 4 g glucomannan per d, 3 g chitosan per d, and 10 g guar gum per d – and hence they need not each be eaten daily or a combination at lower doses should suffice. Evidence of the benefits of these various types could be incorporated into more detailed health advice for dietary fibre consumption from foods, but again this is difficult without the links between chemistry, physical properties and physiological effects.
Very few data on intakes of types of fibre were located from the surveys and studies examined. Only epidemiological studies using FFQ report intakes of soluble and insoluble fibre but this method of assessment of intake is more prone to measurement error than detailed methods and hence was not considered in the intakes examined for this review. The subdivision into soluble and insoluble fibre also has many difficulties, such as methodological variation and lack of consistent association between physiological effects and solubility and has received minimal acceptance as a useful measure. Other physical characteristics, such as viscosity, are difficult to measure and unsuitable for mixed sources of fibre, as in common foods. As a result, and in the absence of a reliable and universally accepted measure to subdivide fibre into different types, food sources that provide the fibre have been used to obtain estimates of fibre quality.
A number of surveys have reported the contribution from the major sources of dietary fibre in the diet. Unfortunately, these are not all directly comparable with different foods in different categories in different countries. Some uniformity exists and hence some general statements about quality can be made. Grain products provide the largest proportion of fibre in the diet for all countries studied, with bread by far the largest grain source, with smaller contributions from breakfast cereals, pasta and biscuits and pastries. Vegetables, potatoes and fruits also contribute substantially, but these vary more widely from country to country, depending on climate and cultural norms. Recommendations about types of fibre to consume are therefore difficult as ‘not one size fits all’, with some foods more likely to be consumed in some countries compared with others. What is needed are recommendations with alternatives which provide similar fibre quality, based on physiological properties such as fermentability or SCFA pattern when fermented, or physicochemical effects in the small intestine, and their effect on type 2 diabetes mellitus and cardiometabolic health, to enable a more uniform set of recommendations which could cover many countries with differing dietary habits. With such limited information about types of fibre and their comparative physical properties and physiological effects, however, such a scheme is currently not possible.
Without a subdivision of fibre by chemical or physiological characteristics, recommendations based on type are best indicated by examination of food sources, both in terms of those consumed by high fibre consumers and those shown to be related to improved health outcomes and reduced disease risk. One way to examine this is to explore differences in sources of fibre between those who consume adequate fibre and meet the recommendations v. those who do not. In studies from Ireland, it has been found that those who meet the fibre recommendation in absolute terms, that is in g/d, tend to consume more food overall than those who do not( Reference Galvin, Kiely and Harrington 87 ). This confirms the suggestion that guidance to reduce energy intake for obesity concerns is likely to result in reduced fibre intake, and emphasises the need for increased energy expenditure to enable not only higher energy intakes but higher intakes of other necessary nutrients, such as fibre. In another analysis from the same group, in a survey of Irish teenagers, it was also found that consumption of most foods containing fibre was higher in those meeting the recommendation, but more so fruit and vegetables, rather than staples like potatoes, which appear to have a daily limit in consumption( Reference Bannon, Walton and Flynn 88 ). It is surprising that more analysis of this type has not been done, that is examination of the diets of those who actually reach recommendations in various countries and it would be very extremely helpful in providing insights into how recommended intakes might be achieved.
Considering the evidence on associations between dietary fibre, dietary fibre sources and disease outcomes, it is apparent that although there are benefits from consumption of all sources of fibre, associations and degree of protection conferred are generally greater for grains. Grain sources of fibre are not all equivalent, however, and there are marked differences in composition between wheat, rye, oat and rice and this may explain some of the heterogeneity between studies and for those conducted in different parts of the world with different grain consumption patterns. Some of this apparent benefit may, however, be an artifact of methodological aspects of dietary assessment such as potentially less measurement error for grains than for fruit and vegetables or the quantitatively greater amounts consumed compared with other fibre sources. There is a need for more evidence on legume sources of dietary fibre and health outcomes. Intervention studies suggest that legume fibre may have an impact on short-term health outcomes including glycaemia and blood lipids, but there is less evidence available of long-term association of legume-based diets with health, perhaps because of low consumption levels or inadequacies of dietary assessment methods to capture these small amounts.
In summary, there is now a fair degree of uniformity in the definition of dietary fibre, the method used for analysis, the recommended amount to be consumed and a growing literature on the effects of fibre and food sources of fibre on digestive health and disease risk. However, intakes do not reach recommendations and there remains little detailed guidance on the types of fibre that are preferable and the types of foods that should be eaten to achieve the recommended intake and have the beneficial health outcomes that fibre is purported to bring about. More detailed advice about the food sources of fibre that should be consumed is needed and efforts should be made to provide the public with such advice. This paper has provided a number of areas where further work may provide additional information to enable such guidance to be given. In particular, in-depth analysis of dietary intakes to understand how those who meet recommendations do so would be extremely useful to aid public health guidance to increase fibre intake.
Acknowledgements
The present review was conducted by an expert group of the European branch of the International Life Sciences Institute (ILSI Europe). This publication was coordinated by L. v. L., Scientific Project Manager at ILSI Europe.
The expert group or their institute received funding from the ILSI Europe Nutrient Intake Optimisation Task Force. Industry members of this task force are listed on the ILSI Europe website (www.ilsi.eu). For further information about ILSI Europe, please email info@ilsieurope.be or call +32 2 771 00 14. The opinions expressed herein and the conclusions of this publication are those of the authors and do not necessarily represent the views of ILSI Europe or those of its member companies.
All authors commented on the final manuscript but each section had a main author who wrote the first draft, as follows:
M. M.-J. C. – definitions, classifications and analytical methods; H. M. – recommendations, guidelines and health claims; A. M. S – intakes, abstract, introduction and discussion; V. J. B. – health effects
S. J. C. is an employee of Kellogg Company. M. F. is an employee of Nestlé Research Foundation.


 Open access