A large body of evidence from prospective and intervention studies suggests that a diet rich in oats could significantly reduce the risk of bowel disease( Reference Haboubi, Taylor and Jones 1 , Reference Thies, Masson and Boffetta 2 ) and CVD( Reference Ye, Chacko and Chou 3 – Reference Ruxton and Derbyshire 5 ) and lowers high blood cholesterol levels( Reference Thies, Masson and Boffetta 4 – Reference Bao, Cai and Xu 7 ). Recent reports suggest that oats may act as a prebiotic, modulating the gut microbiota (GM) and impacting on metabolic disease risk( Reference Connolly, Tzounis and Tuohy 8 , Reference Connolly, Lovegrove and Tuohy 9 ). To date, it is believed that the protective effect of whole grain oats is mainly due to the presence of dietary fibre, in particular, soluble β-glucan( Reference Whitehead, Beck and Tosh 6 , Reference Tosh 10 – Reference Tappy, Gugolz and Wursch 12 ) and resistant starch( Reference Drzikova, Dongowski and Gebhardt 13 ). β-Glucan is known to lower cholesterol and bile acid absorption through formation of viscous gels in the upper gut( Reference Zhang, Zhang and Wang 14 ) and/or directly binding of cholesterol or bile acids. Resistant starch leads to the production of SCFA in the colon and may also increase the growth of some health-promoting bacterial genera within, such as Bifidobacterium and Lactobacillus ( Reference Ovando-Martínez, Whitney and Reuhs 15 – Reference Gibson, Probert and Loo 18 ). Species of these genera influence the cholesterol metabolism through increasing bile-salt hydrolase enzyme activity and the deconjugation of bile acids( Reference Oner, Aslim and Aydas 19 ).
Oats, however, are also rich dietary sources of polyphenols, including avenanthramides and phenolic acids( Reference Shewry, Piironen and Lampi 20 ). These are likely to contribute to the health effects of a diet rich in oats( Reference Chen, Milbury and Kwak 21 – Reference Kern, Bennett and Mellon 23 ) but have not yet been examined in detail. Phenolic acids are found in three different forms within the oat food matrix: as soluble free acids, as soluble conjugates esterified to low-molecular-weight components such as sugars and as insoluble-bound acids esterified to high-molecular-weight components including lignin, cell wall polysaccharides and storage proteins( Reference Shewry, Piironen and Lampi 20 ). A large proportion of oat polyphenols are bound via an ester bond, hence are poorly absorbed in the upper intestine and reach the colon( Reference Del Rio, Rodriguez-Mateos and Spencer 24 ), where they may beneficially modulate the microbiota( Reference Connolly, Tzounis and Tuohy 8 ). There are no esterases in human tissues that break these ester links( Reference Andreasen, Kroon and Williamson 25 ); therefore, the main catalytic site is in the colon through cinnamoyl esterase activity of human faecal microbiota, such as Escherichia coli (three isolates), Bifidobacterium lactis and Lactobacillus gasseri (two strains)( Reference Couteau, McCartney and Gibson 26 , Reference Raimondi, Anighoro and Quartieri 27 ).
Gut microbiota (GM) alterations by whole grain oats have been observed in a number of in vitro fermentation models( Reference Connolly, Lovegrove and Tuohy 9 , Reference Hughes, Shewry and Gibson 28 – Reference Chappell, Thies and Martin 32 ) and animal studies( Reference Drzikova, Dongowski and Gebhardt 13 , Reference Zhou, Hergert and Rompato 33 – Reference Immerstrand, Andersson and Wange 35 ). The fermentation of oats has led to increased Bifidobacterium, Lactobacillus ( Reference Connolly, Tzounis and Tuohy 8 , Reference Connolly, Lovegrove and Tuohy 9 , Reference Kedia, Vazquez and Charalampopoulos 30 , Reference Connolly, Tuohy and Lovegrove 31 , Reference Zhou, Hergert and Rompato 33 , Reference Berger, Falck and Linninge 34 ) and Bacteroides ( Reference Chappell, Thies and Martin 32 ) populations and, at the same time decreased Clostridium ( Reference Kedia, Vazquez and Charalampopoulos 30 , Reference Zhou, Hergert and Rompato 33 ).
The soluble β-glucans have been one of the most commonly studied components of oats( Reference Hughes, Shewry and Gibson 28 , Reference Cloetens, Ulmius and Johansson-Persson 36 , Reference Ibrugger, Kristensen and Poulsen 37 ). However, oat-derived isolated β-glucan only impacted on Bacteroides growth, not on Bifidobacterium in 24 h pH-controlled anaerobic batch culture fermenters( Reference Hughes, Shewry and Gibson 28 ). Furthermore, Crittenden et al. ( Reference Crittenden, Karppinen and Ojanen 38 ) reported that β-glucan was fermented by Bacteroides spp. but not by Lactobacillus or Bifidobacterium. The viscosity and molecular weight of β-glucan may strongly influence its ability to lead to SCFA production and act as a prebiotic( Reference Kim and White 39 ). In addition, these studies have used the relatively high concentrations of 1 % v/w of β-glucans dose( Reference Connolly, Tuohy and Lovegrove 31 , Reference Hughes, Shewry and Li 40 ) which is much higher than the physiological β-glucans concentration delivered from eating oats. To date, none of the oat or β-glucan in vitro fermentation studies assessed the polyphenol content of their treatment( Reference Connolly, Lovegrove and Tuohy 9 , Reference Hughes, Shewry and Gibson 28 , Reference Chappell, Thies and Martin 32 ). Thus, little information exists on the ability of oat-derived avenanthramides, hydroxycinnamic and hydroxybenzoic acids to influence the GM.
The main purpose of the present in vitro study was to examine whether a physiologically relevant dose of polyphenol mix (avenanthramide, hydroxycinnamic acids and benzoic acid derivatives), β-glucan extract (BG) or digested oat bran as whole food matrix beneficially modulates the GM. Second, the study aimed to assess the impact of different doses of digested oat bran on the GM, notably using an oat bran that was well characterised in terms of physicochemical properties.
Methods
Reagents
All chemicals and reagents were purchased from Sigma-Aldrich Chemical Co Ltd or Fisher unless stated otherwise. Mixed-linkage β-glucan kit was supplied by Megazyme Co. The anaerobic jar (Anaerojar™ 2·5 L) and gas-generating kit (AnaeroGen™) were obtained from Oxoid Ltd, the dialysis tube from Spectrum (VWR International). Media and instruments were autoclaved at 121°C for 15 min. HPLC column and guard cartridges were obtained from Phenomenex. PowerSoil® DNA Isolation Kit was purchased from Mo Bio Laboratories Inc., the primers for the 16S rRNA gene amplification from Integrated DNA Technologies, BVBA, AccuPrime™ SuperMix II from Life Technologies, AMPure XP beads from Beckman Coulter Genomic.
Oats and controls
The oat bran was purchased from White’s. The oat macronutrient composition was analysed by Campden BRI Laboratories (total carbohydrate, available carbohydrate, total dietary fibre – AOAC 991.43 method, total fat – BS 4401 and protein – AOAC 981.10 method), whereas the detailed polyphenol content was measured in our laboratory at the University of Reading based on a previous method( Reference Schär, Corona and Soycan 41 ). The β-glucan method used was employed specifically to quantify 1,3:1,4-β-d-glucan. Synergy 1 the oligofructose-enriched inulin was supplied by Beneo and 94 %-BG from Megazyme Co. Polyphenols were purchased from Sigma-Aldrich Chemical Co Ltd.
In vitro digestion of oat bran (from mouth to small intestine)
The method employed was adapted from Mills et al. ( Reference Mills, Tuohy and Booth 42 ). Oat bran was digested in vitro in three phases: the oral phase, the gastric phase and the small intestinal phase. A total of 60 g of oat bran was mixed with 150 ml of sterile and distilled water and homogenised, transferred into a 500 ml Duran bottle and microwaved for 1 min. In the oral phase, 20 mg of α-amylase was dissolved in 6·25 ml CaCl2 (1 mm, pH 7·0) and added to the solution, then incubated at 37°C for 30 min on a shaker set at 120 g . After incubation, the pH was adjusted to 2·0 with 6 m HCl solution and the gastric phase introduced by adding 2·7 g pepsin in 25 ml HCl (0·1 m) and further incubated for 2 h under the same conditions. In the small intestinal phase, 560 mg pancreatin and 3·5 g bile were mixed with 125 ml NaHCO3 (0·5 m) and dispensed into the mix. The pH was adjusted to 7·0 then incubated for 3 h at 37°C with shaking. Finally, the sample solution was transferred to a seamless semi-permeable 100–500 Dalton molecular weight cut-off regenerated cellulose dialysis tubing and dialysed against NaCl (0·01 m at 5°C) to remove low-molecular-mass digestion products. After 15 h, the dialysis fluid was changed and the process continued for an additional 2 h. The digested oat bran mix was collected and transferred into several 250 ml clear plastic containers, frozen to –80°C and freeze-dried for 5 d to remove all fluid content.
Extraction and analyses of polyphenols from undigested and digested oat bran
Polyphenols were extracted from undigested (raw) and digested (after in vitro digestion) oat bran in two separate fractions (i.e. free and conjugated or bound) using the method of Schar et al. ( Reference Schär, Corona and Soycan 41 ) The phenolic acids and avenanthramides in oat extracts were identified and quantified using a HPLC Agilent 1100 series (Agilent Technologies Ltd) equipped with a quaternary pump, autosampler, column thermostat, sample thermostat and photo diode array detector. Compound separation was achieved by a Kinetex biphenyl column (100A 250 × 4·6 mm length, 5 μm particle size; Phenomenex) and using a gradient elution. Mobile phase A consisted of 0·1 % (v/v) formic acid in HPLC water (A), while mobile phase B was 0·1 % (v/v) formic acid in methanol. The following optimised gradient protocol was run as follows: 0 min, 95 % A, 5 % B; 20 min, 75 % A, 25 % B; 25 min, 74 % A, 26 % B; 30 min, 65 % A, 35 % B; 40 min, 64 % A, 36 % B; 53 min, 30 % A, 70 % B; 56 min, 5 % A, 95 % B; 61 min, 5 % A, 95 % B; 62 min, 95 % A, 5 % B; 65 min, 95 % A, 5 % B. The flow rate of the mobile phase was 1·0 ml/min and the sample injection volume was 20 μlReference Shewry (43) . The absorbance was recorded at 254, 280 and 320 nm and quantification was based on 12-point linear calibration curves (mean R 2 >0·99) and as a ratio to the internal standard (i.e. 3,5-dichloro-4-hydroxybenzoic acid) to account for losses during extraction (R 2 ≥ 0·99).
Determination of the β-glucan content
The β-glucan content was analysed with the 1,3:1,4 mixed-linkage β-glucan kit. The assay uses lichenase and β-glucosidase to metabolise β-glucan to β-gluco-oligosaccharides and subsequently glucose. Glucose then reacts with GOPOD (glucose oxidase/peroxidase) reagent and its absorbance was measured at 510 nm by UltroSpec 1100 photo spectrometer (Scinteck Instruments LLC). The final β-glucan content was calculated by the Megazyme Mega-Calc™ tool( Reference Zygmunt and Paisley 44 ).
The molecular weight of the β-glucan was determined by size-exclusion HPLC. The chromatography system consisted of three serially connected columns (Shodex SB-G, Shodex SB-806M, Shodex SB-804 HQ) and an UV-MALLS-Viscometer-dRI detector. The column temperature was set at 40°C, the mobile phase was MiliQ water (Millipore) containing 0·02 % sodium azide, and the flow rate set at 0·5 ml/min. Samples were prepared at a concentration of 10 mg/ml, heated at 60°C for 3 h under constant shaking, syringe filtered (0·45 μm polyvinylidene difluoride membrane; Whatman) and diluted to a concentration of 1 mg/ml before injection.
pH controlled faecal batch culture fermentation
Substrate ability to modulate GM was determined using anaerobic, stirred, pH- and temperature-controlled faecal batch cultures. Batch culture fermentation vessels (300 ml volume: one vessel per treatment) were sterilised and filled with 135 ml of sterile basal medium (g/l: 2 g peptone, 2 g yeast extract, 0·1 g NaCl, 0·04 g K2HPO4, 0·04 g KH2PO4, 0·01 g MgSO4.7H2O, 0·01 g CaCl2.6H2O, 2 g NaHCO3, 2 ml Tween 80, 0·05 g hemin (dissolved in a few drops of 1 m NaOH), 10 μl vitamin K, 0·5 g l-cysteine HCl, 0·5 g bile salts and 4 ml of resazurin solution (0·02 %)). Before addition to the vessel, the medium was adjusted to pH 7·0 and autoclaved. The sterile medium was gassed overnight with O2-free N2 (15 ml/min) to establish the anaerobic conditions. To mimic the proximal region of the human large intestine, pH was held in the range of 6·7–6·9 by automatic addition of 0·5 m NaOH or 0·5 m HCl and controlled via pH metre controllers (Electrolab) and the temperature was kept at 37°C. Faecal samples were collected from three healthy female donors, who were between 25 and 40 years of age, with no history of bowel disorders, who had not received antibiotic treatment for at least 6 months before the study and who had not consumed pre- or probiotic supplements 1 month before the study. All donors were informed of the study aims and procedures and provided their verbal consent for stool samples to be used for the experiments in compliance with the ethics procedures required at the University of Reading. Samples were collected in anaerobic jars and used within 1 h of collection. Samples were diluted 1:10 (w/v) with anaerobic phosphate buffer (0·1 m, pH 7·4) and homogenised in a stomacher for 2 min; the batch culture systems were inoculated with 15 ml faecal slurry from an individual sample. The vessels were treated with the following substrates: 1 % (w/v), 1·5 g digested oat bran (OAT1·5); 3 % (w/v), 4·5 g digested oat bran (digestibility of oats see McCance et al. ( Reference McCance and Glaser 45 )) (OAT4·5); 0·12 % (w/v), 180 mg 94 % BG; 0·01 % (w/v), 1·7 mg polyphenol mix (same profile as 4·5 g digested oats) (POLY); 1 % (w/v), 1·5 g Synergy 1 (positive control, PC); an additional vessel was prepared under the same conditions but without any substrate, which served as the negative control (NC) (Table 2). The Synergy 1 is an inulin enriched with oligofructose, which has been proved for its prebiotic effects( Reference Stiverson, Williams and Chen 46 ). The 3 % (w/v) oat was chosen as the highest dose, since it would be the concentration reached by an average person consuming 60 g oat bran (i.e. assuming 30 g oat bran reaches the colon and colonic total volume is 1 litre)( Reference McCance and Glaser 45 ). Based on this calculation, BG and polyphenol mix treatments were matched to the dose present in 3 % (w/v) oat bran. Treatment with OAT1·5 was added to the experiment to monitor the impact of the oat dose on the prebiotic effect. In all, 5 ml samples were collected at 0, 5, 10, 24 h, of which 1 ml aliquots were centrifuged at 13 000 g for 10 min. Supernatants and pellets were stored separately at –20°C until analysis.
High-throughput sequencing of the gut microbiota
The GM compositions and dynamics were determined using tag-encoded 16S rRNA gene MiSeq-based (Illumina) high-throughput sequencing. DNA was extracted from 2 ml of faecal samples from fermentation vessel using power soil DNA isolation kit. The bead-beating was performed in three cycles of 15 s each at 6·5 pulse/s (the FastPrep-24™ 5G Instrument; MP Biomedicals). DNA concentrations and purity were determined using Nanodrop 1000 (ThermoScientific). The V3 region of the 16S rRNA gene was amplified using primers compatible with the Nextera Index Kit NXt_338_F: 5’-TCGTCGGCAGCGTCAGATGTGTATAAGAGACAGACWCCTACGGGWGGCAGCAG-3’ and NXt_518_R: 5’-GTCTCGTGGGCTCGGAGATGTGTATAAGAGACAGATTACCGCGGCTGCTGG-3’( Reference Ovreås, Forney and Daae 47 ). PCR and library preparation were conducted as described in Kristensen et al. Reference Kristensen, Wiese and Rytter (48) . Briefly, PCR containing 12 μl AccuPrime SuperMix II, 0·5 μl of each primer (10 μm), 5 μl of genomic DNA (approximately 10 ng/μl) and nuclease-free water to a total volume of 20 μl were run on a SureCycler 8800 (Agilent). Applied cycling conditions were as follows: denaturation at 95°C for 2 min; thirty-five cycles of 95°C for 15 s, 55°C for 15 s and 68°C for 40 s; followed by final elongation at 68°C for 5 min. To incorporate primers with adapters and indices, PCR contained 12 μl Phusion High-Fidelity PCR Master Mix, 2 μl P5 and P7 primer, 2 μl PCR product and nuclease-free water for a total volume of 25 μl.
Cycling conditions applied were as follows: 98°C for 1 min; twelve cycles of 98°C for 10 s, 55°C for 20 s and 72°C for 20 s; elongation at 72°C for 5 min. The amplified fragments with adapters and tags were purified using AMPure XP beads. Before library pooling, clean constructs were quantified using a Qubit fluorometer (Invitrogen) and mixed in approximately equal concentrations to ensure even representation of reads per sample; 180 bp pair-ended MiSeq (Illumina) sequencing was then performed according to the instructions of the manufacturer. The raw data set containing pair-ended reads with corresponding quality scores was trimmed using CLC Genomic Workbench (CLC bio). Trimming settings were set to a low-quality limit of 0·01, with no ambiguous nucleotides allowed, and trimming off the primer sequences. Merging overlapped reads was performed using the ‘Merge overlapping pairs’ tool by default settings. The Quantitative Insight Into Microbial Ecology (QIIME) tool (version 1.8.0; Open Source Software) was used for further analysis( Reference Caporaso, Kuczynski and Stombaugh 49 ).
Purging the data set from chimeric reads was performed using USEARCH, while the usearch61 method was used for operational taxonomic units (OTU) selection( Reference Edgar, Haas and Clemente 50 ). The Greengenes (version 12.10) 16S rRNA gene database and EzTaxon were used as reference( Reference McDonald, Price and Goodrich 51 , Reference Kim, Cho and Lee 52 ).
High-throughput sequencing yielded 12 465 219 sequences free from chimeric reads, providing an average of 178 202 (sd 80 036) sequences per sample (range 292–447 040), five baseline samples and one 10 h sample were excluded due to low reads (292–509).
SCFA analysis
The defrosted supernatant samples were filtered (0·22 μm; Millipore) and spiked with 50 μl internal standard (2-ethyl butyric acid, 100 mm). SCFA were measured in an ion exclusion HPLC system (Agilent 1100 Series) equipped with a diode array detector (G-1315B), autosampler (G1316A) and Aminex HPX-8711 column (300 × 7·8 mm) heated to 84°C. Samples (20 μl) were injected in duplicate, and UV absorption was measured at 214 nm. The mobile phase was 2·5 mm aqueous sulphuric acid run at a flow rate of 0·6 ml/min. Peaks were integrated using Agilent ChemStation software (Agilent Technologies) and single-point internal standard method. Peak identity and quantification were determined using a mixture of standards of acetic, butyric, iso-butyric, propionic, lactic, formic, valeric and isovaleric acids. Quantification was based on the 10-point calibration curve of analytical standards (R 2 ≥ 0·99).
Statistics
For calculation of α and β diversity measurement of the sequencing data, the d and e values were set to 9800 reads/sample (85 % of the sequence number of the most indigent sample). α-Diversity measures expressed with an observed species, Chao1, the sequence similarity 97 % OTU value were computed for rarefied OTU tables using the α rarefaction workflow. Differences in α diversity were determined using a t test-based approach employing the non-parametric (Monte Carlo) method (999 permutations) implemented in the compare α diversity workflow with QIIME.
The relative distribution of the genera registered was calculated and summarised at the genus level OTU tables, followed by principal coordinates analysis (PCoA) plots generated with the Jackknifed β diversity workflow based on ten distance matrices calculated using ten subsampled OTU tables with QIIME. The P value and the conservative false discovery rate (FDR)-corrected P value for multiple comparisons are reported. Three-dimensional plots were constructed using the three primary PC from the PCoA of the MiSeq analysis to visualise group differences in the GM composition.
For the rest of the data analysis, GraphPad Prism statistics software package version 7 was used. One-way ANOVA was used to determine the differences between fermentation treatments (OAT1·5, OAT4·5, POLY, BG) at the same time point (0, 5, 10 or 24 h), followed by the least significant difference (Bonferroni) post hoc test. A repeated-measures ANOVA was used to explore the differences within the same treatment (OAT1·5, OAT4·5, POLY, BG) with all the time points (0, 5, 10 and 24 h) with Bonferroni as the post hoc test. In addition to these analyses, the P values were corrected using FDR, and P ≤ 0·05 was considered statistically significant.
Results
The composition of undigested and digested oat bran
The macronutrient, fibre and phenolic content of undigested and digested oat bran are reported in Table 1. The in vitro oral, gastric and small intestine digestion reduced the carbohydrate content by 53 %, available carbohydrate by 62 %, while the dietary fibre and β-glucan content remained stable, losing only 2 and 12 %, respectively. Free and conjugated, bound polyphenol compounds decreased by 48 and 26 %, respectively.
Table 1 Macronutrient, fibre and phenolic content of oat bran before and after in vitro digestion and bioaccessibility (%) through digestion *
ND, not detected.
* Bioaccessibility – evaluated following in vitro upper gut digestion procedures, we have used the term bioavailability to indicate the percentage of compound remaining, thus available to the large gut microbiota. This term was first defined by Dall’Asta et al. Reference Mills, Tuohy and Booth (42) .
Polyphenols and β-glucan content in oat bran and extract
The OAT4·5 contained 1·73 mg polyphenols (total amount of free+conjugated and bound), the POLY intervention were matched to OAT4·5 (Table 2). OAT1·5 and OAT4·5 delivered 56·67 and 170 mg β-glucan, respectively; the BG vessel to match OAT4·5 180 mg of 94 % BG was added (Table 2). The molecular weight of the β-glucan in the digested oat bran and the extract was similar (335·5 (sd 1·0) and 387·3 (sd 1·0) kDa; P >0·05).
Table 2 In vitro fermentation treatments
OAT1·5, 1·5 g digested oat bran; OAT4·5, 4·5 g digested oat bran; BG, β-glucan extract; POLY, polyphenol mix; ND, not detected; PC, positive control; NC, negative control.
Changes in α- and β-diversity
Independent of the donor, α-diversity decreased with oat treatments over the 24 h fermentation period (Chao1 2618 (sd 15) at 0 h v. 1577 (sd 22) at 24 h for OAT1·5) but was constant over time in the NC (Chao1 2639 (sd 87) at 0 h v. 2488 (sd 77) at 24 h) and POLY (Chao1 2655 (sd 138) at 0 h v. 2241 (sd 320) at 24 h).
PCoA analyses based on unweighted UniFrac distance matrices of all samples showed a clear donor effect (Fig. 1(a)). However, the donor effect was no longer significant when using weighted UniFrac distance matrix analysis (analysis of similarity test, donor 1 v. donor 2 P = 1, donor 1 v. donor 3 P = 1, donor 2 v. donor 3 P = 1, Fig. 1(b)).
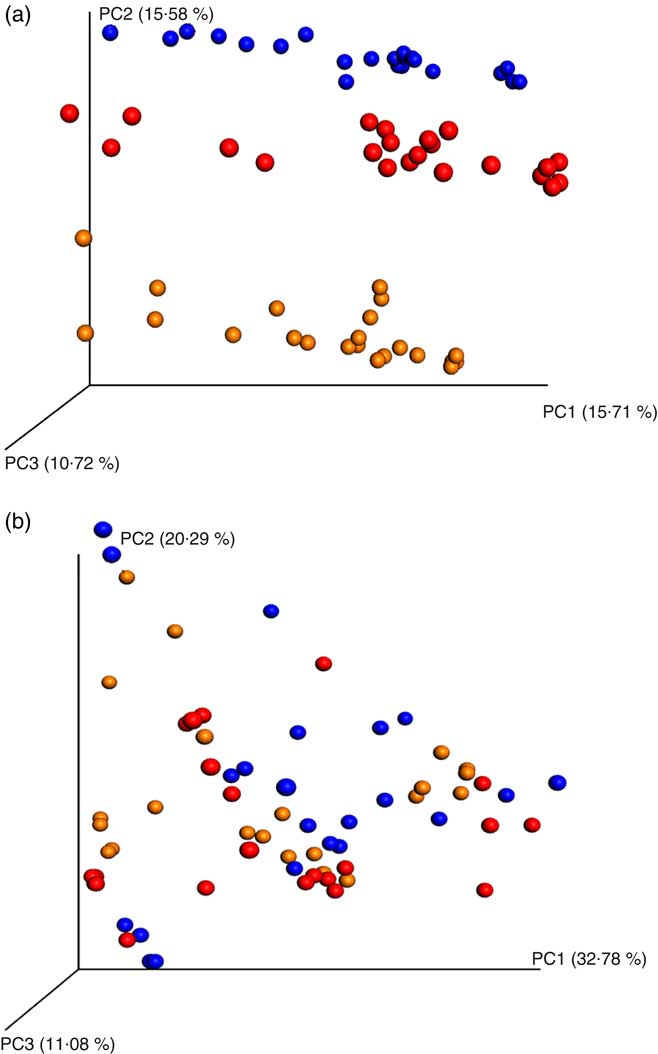
Fig. 1 Principal coordinates analysis (PCoA) plots of 16S rRNA gene profiles based on (a) unweighted and (b) weighted phylogenetic Unifrac distance matrices calculated from ten rarefied operational taxonomic unit tables (9800 reads/samples); unweighted (a) showing clear clustering according to donors (analysis of similarity (ANOSIM) test, P = 0·01). The degree of variation between ten jackknifed replicates of PCoA is displayed with confidence ellipsoids around each sample. Weighted (b) quantitative information used to generate the bacterial relative abundance of donors showed no clear clustering (ANOSIM test, P >0·05) for a whole dataset (24 h in vitro batch culture fermentation inoculated with three healthy donors faeces and administered with digested oat bran 1·5 g (OAT1·5) and 4·5 g (OAT4·5), β-glucan extract (BG), polyphenol mix (POLY), Synergy 1 (positive control (PC)) and negative control (NC) as the substrates). ![]() , Donor 1;
, Donor 1; ![]() , donor 2;
, donor 2; ![]() , donor 3.
, donor 3.
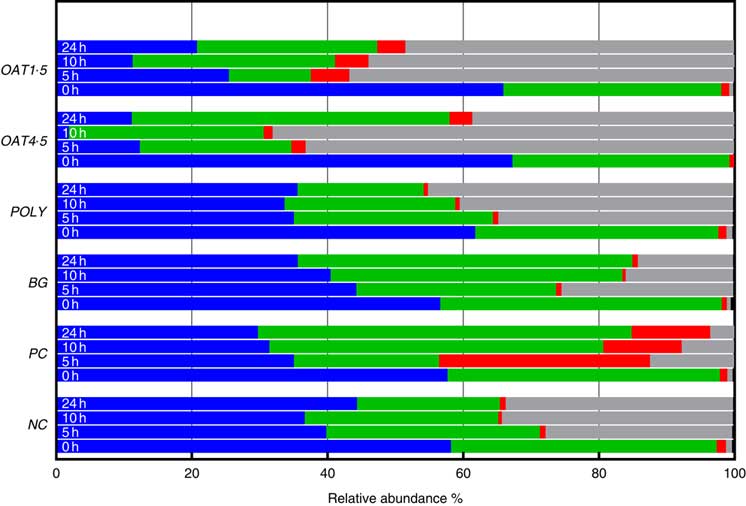
Across all samples, seven bacterial phyla were classified and one phylum designated as unassigned. Phyla composition was similar for all donors (P <0·06), although at baseline the third donor had lower Tenericutes (P <0·01), while the second donor had higher Actinobacteria (P <0·05). At baseline, the bacterial communities were dominated by Firmicutes (57–67 %) and Bacteroidetes (32–41 %), while the remaining five phyla including Actinobacteria (0·8–1·4 %), Verrucomicrobia, Cyanobacteria, Tenericutes and Proteobacteria (0·4–0·9 %) constituting <1·5 % of the community (Fig. 2).
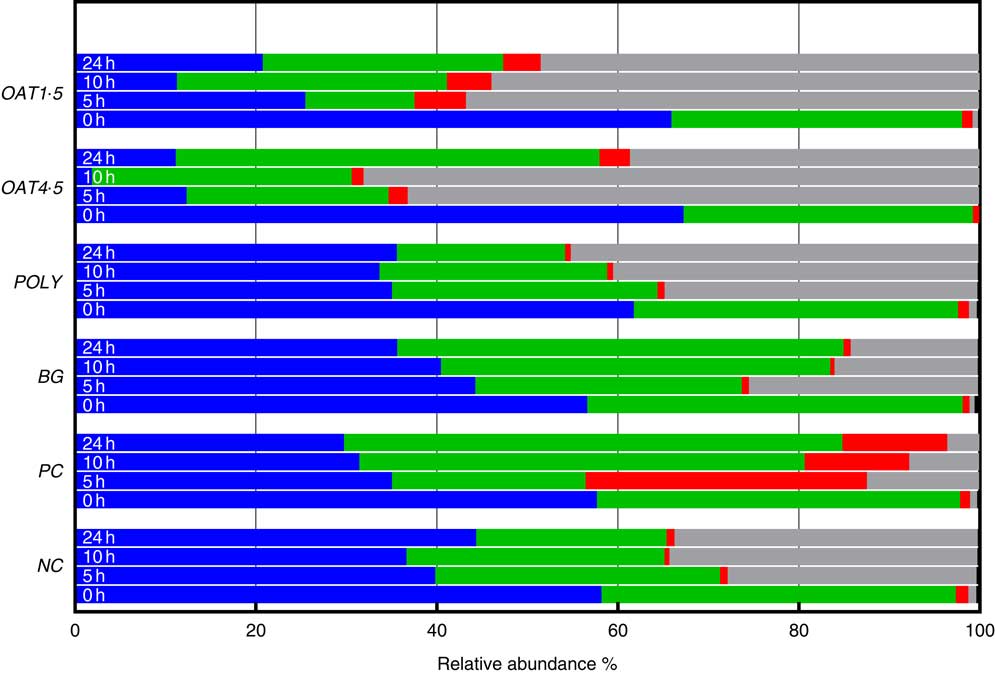
Fig. 2 Changes in bacterial phyla (relative abundances (%)) 0, 5, 10 and 24 h in vitro batch culture fermentation. This experiment was conducted three times, with a different faecal donor used for each run. The media was supplemented with digested oat bran 1·5 g (OAT1·5) and 4·5 g (OAT4·5), β-glucan extract (BG), polyphenol mix (POLY), Synergy 1 (positive control (PC)) and negative control (NC). Samples were analysed at 0, 5, 10, 24 h. Values are means (%). ![]() , Firmicutes;
, Firmicutes; ![]() , Bacteroidetes;
, Bacteroidetes; ![]() , Actinobacteria;
, Actinobacteria; ![]() , Proteobacteria and
, Proteobacteria and ![]() , other (<1 %)
, other (<1 %)
Compositional shifts
Supplementation with OAT4·5 led to a lower abundance of Firmicutes (P <0·02) at 5–24 h and to an increased abundance of Proteobacteria (P <0·01) and Bacteroidetes at 24 h compared with NC. A similar trend was observed for OAT1·5 (P values) (Fig. 2).
The OAT1·5 treatment had a significant effect on the relative abundance of Actinobacteria at 10 h. The relative abundance of Actinobacteria differed between OAT1·5 and OAT4·5 at baseline (1·1 and 0·8 %, respectively). Following 10 h fermentation, Actinobacteria were almost four times higher in OAT1·5 compared with OAT4·5 (4·9 and 1·3 %, respectively), however, differences did not persist over 24 h (4·2 v. 3·4 %, respectively). The treatment of BG and POLY did not promote the growth of Actinobacteria, even though their dose was matched to the OAT4·5 treatment. The PC, Synergy 1, resulted in the strongest bifidogenic effect and the relative abundance of Actinobacteria (baseline 1·1 % v. 5 h at 31·1 %, 10 h at 11·5 %, P <0·05) (Fig. 2).
Focusing on changes over 24 h, the abundance of Bacteriodetes increased with BG (49·3 % v. NC for 21 %), whereas Proteobacteria significantly decreased in comparison with the NC (14 v. 33·5 %). In POLY treatment, the abundance of Proteobacteria increased over the course of fermentation (45 % v. NC for 33·5 %) and decreased for Bacteriodetes (P <0·04) (18·6 v. 46·8 % for OAT4·5). The oats and BG treatments promoted the growth of Bacteriodetes (Fig. 2).
At the lower taxonomic level and across all samples, fifty-nine genera and sixty-nine species were identified when setting the cut-off at a relative abundance above 0·1 % of the community (Table 3). At 5 h, the OAT4·5 treatment led to a significantly lower abundance of Ruminococcus (0·1 %) and Coprococcus (0·1 %) genus and, at the same time, increased the proportion of unassigned Enterobacteriaceae (61·2 %) compared with NC (25·8 %) (Table 3). Most notably, OAT1·5 increased the abundance of Bifidobacterium unassigned (1·5 v. 0·2 % for NC, P <0·05) at 10 h and Bifidobacterium adolescentis at 10 h (1·9 v. 0·3 % for NC, P <0·04) and at 24 h (2 v. 0·4 % for NC, P <0·02) (Table 3), whereas OAT4·5 did not significantly impact the relative abundance of these species due to the high standard deviation among donors. Using EzTaxon database, we were able to further identify the species designation of several OTU at 24 h with BG and POLY treatments. At 24 h, the BG treatment had higher abundances in Bacteroides ovatus (13·5 %), Bacteroides uniformis (12·9 %) and Bacteroides xylaniosolvens (3·7 %) species, while POLY led to the most abundant levels of Enterobacteriaceae species, Hafnia alvei (21·7 %). However, these changes mediated by BG and POLY treatments were not significantly different compared with NC.
Table 3 Significant changes (false discovery rate (FDR) P <0·05) in relative abundance (%) of bacterial taxa at 5, 10 and 24 h of in vitro batch culture fermentation inoculated with faeces and administered with digested oat bran 1·5 g (OAT1·5) and 4·5 g (OAT4·5), β-glucan extract (BG), polyphenol mix (POLY), Synergy 1 (positive control (PC)) and negative control (NC) as substrates (this experiment was conducted three times, with a different faecal donor used for each run) (Mean values with their standard errors)

* Mean values were significantly different (P <0·05) to NC at the same time point.
† The difference in relative abundance of taxa between treatments within the same time points was assessed by ANOVA. The P value after correction for multiple tests (sixty-nine taxa) with the FDR method.
Production of SCFA
OAT4·5 led to a high production of total SCFA compared with NC at 10 h (98·2 (sd 22) v. 12·8 (sd 4) mm, respectively) and 24 h (151·5 (sd 43) v. 28·1 (sd 5) mm). The concentration of butyric acid was significantly increased after 24 h fermentation of OAT1·5 (P <0·05), and PC at 10 h (P <0·05) and 24 h (P <0·01) compared with NC (Fig. 3). Acetic acid was the most abundant SCFA. Both oat treatments resulted in a significant increase in acetic acid at 10 h (P <0·01), and 24 h (P <0·01) compared with baseline and NC (Fig. 3). At 24 h, OAT4·5, OAT1·5 and PC significantly increased the concentration of propionic acid compared with NC (48 (sd 24), 16·7 (sd 3), 21 (sd 9) and 4·5 (sd 0·3) mm, respectively, P <0·01, 0·05 and 0·05, respectively). Lactic and formic acids increased upon fermentation of OAT4·5 after 10 h compared with baseline but did not reach significance due to the large variation among donors. BG led to a small production of acetic and butyric acids (not significant), whereas POLY did not induce SCFA production. Overall, there was a dose–response effect between the two oats doses in total SCFA at 10 h (98·2 (sd 22) v. 58 (sd 19) mm, respectively, P <0·05) and 24 h (151·5 (sd 43) v. 86·1 (sd 27) mm, P <0·05).
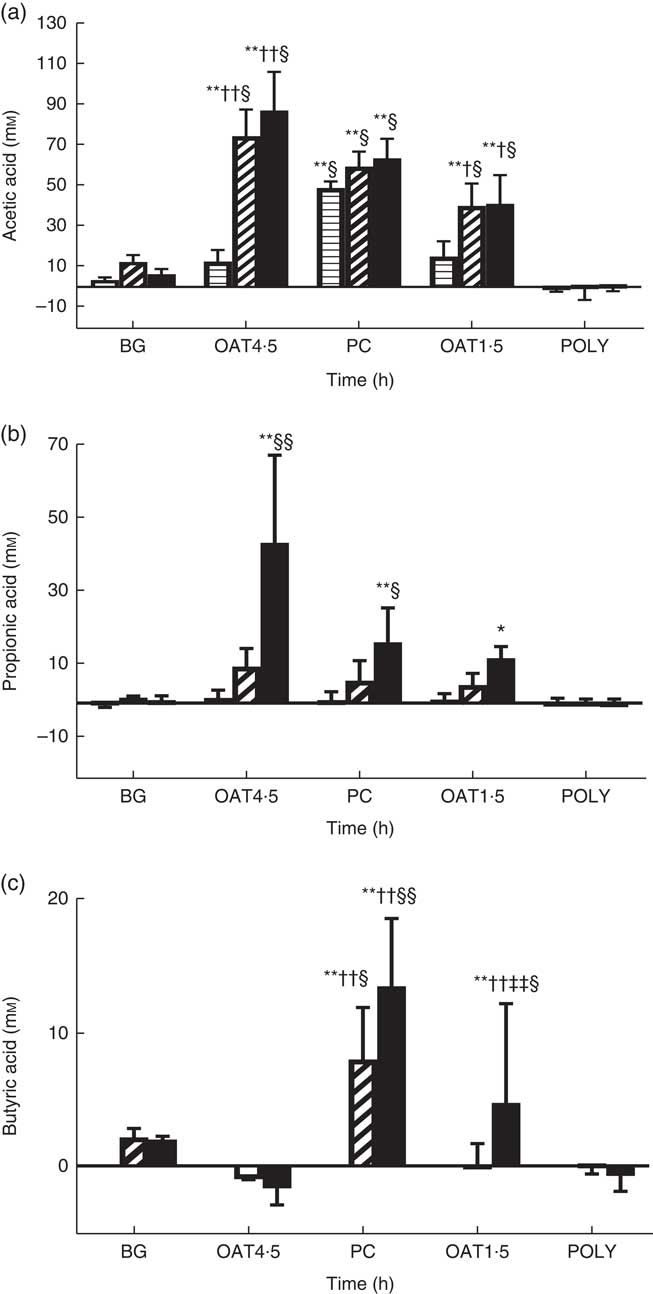
Fig. 3 Change in concentrations of acetic acid (a), propionic acid (b), butyric acid (c) from negative control (mm) throughout 24 h in vitro batch culture fermentation. This experiment was conducted three times, with a different faecal donor used for each run. The media supplemented with digested oat bran 1·5 g (OAT1·5) and 4·5 g (OAT4·5), β-glucan extract (BG), polyphenol mix (POLY), Synergy 1 (positive control (PC)) as the substrates. Samples were analysed at 0, 5, 10, 24 h. Values are reported after subtracting negative control value. Significantly different from initial value *P <0·05, **P <0·01; significantly different from 5 h value †P <0·05, ††P <0·01, significantly different from 10 h value ‡‡P <0·01; significantly different from negative control value at the same time point §P <0·05, §§P <0·01. ![]() , T5;
, T5; ![]() , T10;
, T10; ![]() , T24.
, T24.
Discussion
This study aimed to identify the impact of different doses of oats and its isolated bioactive compounds (i.e. β-glucan or polyphenols) on the faecal GM using in vitro systems. Digested oat bran decreased α diversity and had a bifidogenic effect but isolated β-glucan or polyphenol mix given at a matched dose did not induce a similar effect (Fig. 2). This is likely to be because these compounds alone did not provide enough energy for bacterial growth. We have demonstrated that OAT1·5 significantly increased the proliferation of B. adolescentis (Table 3). An increase in Bifidobacterium (genus level) was reported by Connolly et al. ( Reference Connolly, Lovegrove and Tuohy 9 ) and Kedia et al. ( Reference Kedia, Vazquez and Charalampopoulos 30 ) after fermentation of 1 and 5 % oat grains in similar in vitro studies. B. adolescentis has a number of benefits including prevention of the development of diabetes by stimulating insulin secretion. Furthermore, B. adolescentis has the ability to synthesise and secrete the neuroactive substance γ-aminobutyric acid (GABA). GABA facilitates communication between bacteria and the human nervous system, enabling release of other neurotransmitters from specific epithelial intestinal cells( Reference Dyachkova, Klimina and Kovtun 53 , Reference Averina and Danilenko 54 ). Our main findings suggest that oat bran could have beneficial effects on the host through increasing the relative abundance of B. adolescentis.
In accordance with the literature( Reference McCleary, DeVries and Rader 55 , Reference Knudsen, Jensen and Hansen 56 ), the compositional analysis of digested oat bran showed limited degradation of β-glucan in the stomach and the small intestine (Table 1). BG (180 mg – 387 kDa) did not introduce changes to Actinobacteria phyla (Fig. 2), which is supported by previous studies on β-glucan( Reference Hughes, Shewry and Gibson 28 , Reference Crittenden, Karppinen and Ojanen 38 ). However, BG tended to promote the growth of beneficial B. uniformis, B. ovatus and B. xylaniosolvens compared with NC (Table 3), which is in line with the reports of Wang et al. ( Reference Wang, Ames and Tun 57 ). In addition, Hughes et al. ( Reference Hughes, Shewry and Gibson 28 ) used a similar anaerobic batch culture system for fermentation of 0·5 g β-glucan and also showed an increase in a member of Bacteroidetes, specifically in the Bacteroides–Prevotella group following 24 h fermentation. However, the dose of β-glucan used by Hughes et al. was almost three times higher in concentration compared with what was found in 60 g oat bran (containing 0·17 g β-glucan), which would equate to the consumption of 150 g oat bran.
While human digestive enzymes cannot degrade plant cell wall polysaccharides, gut xylanolytic bacteria (e.g. B. xylaniosolvens, B. uniformis and B. ovatus) can, while producing SCFA with potential health-beneficial effects( Reference Ulsemer, Toutounian and Schmidt 58 – Reference Beckmann, Simon and Vahjen 60 ). Certain strains of B. uniformis down-regulate gene and protein expression of pro-inflammatory cytokines, notably isoform of nitric oxide synthase and PPAR-γ and interferon-γ, resulting in reduced inflammatory status( Reference Fernández-Murga and Sanz 61 ), suggesting that oat β-glucan could have beneficial effects on human health. More powered studies should be applied to confirm this effect.
In vitro upper gut digestion (mouth to small intestine) reduced polyphenols in the free-conjugated, bound fractions by 48 and 26 %, respectively (Table 1). This is in agreement with the findings by Dall’Asta et al. ( Reference Dall’Asta, Bresciani and Calani 62 ) on phenolic bioaccessibility in durum wheat aleurone fractions where caffeic and sinapic acids appeared as the most bioaccessible (83·3 and 79·5 %), while total ferulic acid and p-coumaric acid were less bioaccessible (29·5 and 40·7 %) with in vitro digestion. Moreover, several phenolic metabolites, including vanillic acid, 4- and 3-hydroxyhippuric acids, sulphate conjugates of benzoic and ferulic acids, are derived from the hepatic and microbial metabolism of oat brans( Reference Schär, Corona and Soycan 41 ). Schar et al. ( Reference Schär, Corona and Soycan 41 ) found relevant concentrations in urinary excretion of thirty different phenolics and amounted to a total excretion of 33·7 (sd 7·3) μmol, suggesting that a high proportion of oat phenolics are bioavailable with absorption occurring both in the small intestine and then in the large intestine within 8 h of consumption.
In the current study, POLY did not change the abundance of the Actinobacteria phyla, which is similar to the research conducted by Gwiazdowska et al. ( Reference Gwiazdowska, Jus and Jasnowska-Malecka 63 ), which showed that 20 μg/ml polyphenols had an effect on Bifidobacterium after 1 h incubation, but no effect at 24 h. The effects of polyphenols on microbial composition may also be related to the fact that there is no carbohydrate energy available for this fermentation. Therefore, at least part of the change may also be due to utilisation of protein as an energy source. However, in the current study a POLY-induced increase in Enterobacteriaceae phyla and H. alvei species was detected( Reference Lindsay and Priest 64 ). Several studies connected this group with polyphenol-degrading metabolism( Reference Grbić-Galić 65 , Reference Huang, Chen and Xue 66 ). While Gu et al. ( Reference Gu, Yang and Lou 67 ) and Hunter et al. ( Reference Hunter, Manter and van der Lelie 68 ) observed that Enterobacter strains could transform ferulic acid to vanillin via the non-oxidative decarboxylation, Kuntz et al. ( Reference Kuntz, Kunz and Domann 69 ) believed that the H. alvei significantly attenuated the expression of adhesion molecules and cytokine secretion (IL-8 and IL-6), resulting in reduced inflammation( Reference Kuntz, Kunz and Domann 69 ). The higher relative abundance of Enterobacteriaceae phyla and H. alvei species in POLY and digested oat bran treatments might be associated with the metabolic activity of these microbial groups towards plant-derived polyphenols and saccharides( Reference Wust, Horn and Drake 70 ).
Previous oat fermentation studies have not shown significant increases in the growth of Enterobacteriaceae phyla and H. alvei species( Reference Kedia, Vazquez and Charalampopoulos 30 ), most likely because the fluorescence in situ hybridisation method used did not target Enterobacteriaceae or allow analysis at the species level. We have detected an increased presence of Proteobacteria phyla (Fig. 2) in all three vessels including NC, which might be due to the artificial conditions of batch culture systems( Reference Saulnier, Gibson and Kolida 71 , Reference Kemperman, Gross and Mondot 72 ). Facultative anaerobic microbes are indeed less abundant in the human colon( Reference Eckburg, Bik and Bernstein 73 ), but this batch culture model may not be able to achieve a strict anaerobic environment, causing an increase in Proteobacteria phyla( Reference Kemperman, Gross and Mondot 72 ).
Despite in vitro enzymatic digestion (mimicking the digestion in the upper intestine before colon fermentation), the available carbohydrate content of the oat bran remained high (62 %) (Table 1). Wholegrain oats are a source of starch (60 % of the total DM of the oat grain), consisting of 7 % rapidly digestible starch, 22 % slowly digestible and 25 % resistant starch( Reference Menon, Gonzalez and Ferruzzi 74 ) all of which contribute to the available carbohydrates. The findings of Englyst & CummingsReference Englyst and Cummings (75) suggest that human digestive enzymes do not break down dietary resistant starch. Strikingly, 30 % resistant starch type 4 also led to species-level alterations in a colon and increases in B. adolescentis ( Reference Martínez, Kim and Duffy 76 ). A previous study( Reference Hughes, Shewry and Li 40 ) reported that 1 % (w/v) arabinoxylan, a dietary fibre found in wholegrain including oats, has a bifidogenic effect using a similar 24 h batch culture fermentation in vitro model, yet oats generally have about 3·8–13·2 % of arabinoxylan( Reference Shewry, Piironen and Lampi 20 ). This, in combination with our findings, suggests that interactions among a wide range of dietary polysaccharides may explain the bifidogenic effect of oats( Reference Grootaert, Delcour and Courtin 77 ).
The current results indicate that digested oat bran treatments increase SCFA production dose dependently, with a higher dose inducing higher acetate and propionate production but lower butyrate (Fig. 3). Lactic acid disappeared at 24 h, possibly because it can be further metabolised by bacteria to acetic and propionic acids( Reference Macfarlane and Macfarlane 78 ). Acetate and lactate are widely produced by different bacteria; however, bifidobacteria has a distinct pathway, transforming glucose to acetate and lactate( Reference Pokusaeva, Fitzgerald and van Sinderen 79 ). SCFA can create acidic conditions in the human colon, inhibiting the growth of pathogens and reducing harmful enzyme activities in the human intestine, while they also act as an energy source for gut epithelial cells( Reference Fooks and Gibson 80 , Reference Russell, Hoyles and Flint 81 ). Furthermore, propionate derived from carbohydrate fermentation is a substrate for gluconeogenesis in humans and also inhibits the utilisation of acetate for cholesterol synthesis in the colon and liver( Reference Wolever, Spadafora and Eshuis 82 , Reference Alvaro, Sola and Rosales 83 ). Therefore, oat bran may have a beneficial impact on human health through SCFA production.
In previous studies( Reference Cheickna and Hui 84 , Reference Grundy, Quint and Rieder 85 ), differences were observed between the activity of pure and food matrix-derived β-glucan on small intestine digestion and lipolysis. Purified β-glucan was observed to have less gel-forming capacity and a lesser effect on lipolysis and cholesterol metabolism than the matrix-derived β-glucan. In addition, dietary fibre-induced SCFA production has been shown to interact with phenolics( Reference Ziegler, Kerimi and Poquet 86 ), where butyric acid increased the ferulic acid absorption in the colon, potentially translating to higher concentrations of ferulic acid in systemic circulation in vivo. These findings indicate positive interactions of fibres and polyphenols within the food matrix on cholesterol metabolism and the bioavailability of phenolics and also highlight the importance of considering the structure and physicochemical properties of foods and not just the nutrient content.
In conclusion, our study has shown that oat bran as a complex food matrix beneficially increases the number of B. adolescentis and the amount of SCFA production. In contrast, a matched dose of the isolated bioactive compounds, β-glucan and other polyphenols did not show any effect on the abundance of Actinobacteria. However, by regulating the Bacteroides and Enterobacteriaceae families, they may also contribute to further health benefits.
Acknowledgements
The authors kindly thank Professor Dennis Sandris Nielsen Department of Food Science, University of Copenhagen, Denmark, for his support to conduct DNA extraction and amplification in his laboratory.
The present study was supported by a BBSRC research grant.
The authors’ contributions are as follows: A. K., M. Y. S. and G. W. designed the study; O. K. analysed the β-glucan molecular weight; A. K. and P. H. conducted the in vitro fermentation experiments; M. W. and A. K. conducted the 16S rRNA gene sequencing; A. K. and M. W. conducted the statistical analyses. A. K., M. W., M. Y. S., G. W., G. G. C. K., G. S., S. A. and J. P. E. S. interpreted the data and A. K., M. W., M. Y. S., G. W. and J. P. E. S. drafted the manuscript. A. K. had primary responsibility for the final content. All authors agreed on the final version of the manuscript.
The authors declare no conflict of interest.