


Changes in the food environment resulting from urbanization and globalization have led to a rise in food consumption away from home, not only in Western industrialized countries such as the USA, but also in rapidly industrialized countries including China( Reference Nielsen, Siega-Riz and Popkin 1 – Reference Zhai, Du and Wang 3 ). Between 2000 and 2008, the share of expenditures on food consumed at home in China’s urban population declined from 85·3 to 79·4 %, while that spent on food eaten away from home increased from 14·7 to 20·6 %, of which restaurant food comprised the majority( Reference Dong and Hu 4 ).
These shifts towards eating away from home have raised concerns that restaurant meals may negatively influence diet quality. Numerous studies report that eating away from home is associated with adverse patterns of nutrient intake due to a tendency to select less healthy foods in restaurants, and to consume larger portions, compared with home consumption( Reference Berkowitz, Marquart and Mykerezi 5 , Reference Lachat, Nago and Verstraeten 6 ). For example, a systematic review of twenty-nine eligible studies reported that eating away from home was associated with a higher total energy intake and a greater energy contribution from fat in the daily diet( Reference Lachat, Nago and Verstraeten 6 ). Burke et al. ( Reference Burke, McCarthy and O’Neill 7 ) and Burns et al. ( Reference Burns, Jackson and Gibbons 8 ) reported that eating away from home is associated with lower intakes of beneficial micronutrients, particularly vitamin C, Ca and Fe. Restaurant meals tend to contain higher levels of nutrients of concern, including energy, fat, saturated fat and Na, which have been shown to increase the risk of obesity, diabetes, hypertension and heart disease( Reference Setayeshgar, Ekwaru and Maximova 9 ). It has been reported that restaurant meals are higher in Na( Reference Lin and Guthrie 10 , Reference Lin and Frazao 11 ) and fat( Reference Zoumas-Morse, Rock and Sobo 12 ) compared with dishes prepared at home.
Recently, studies highlighting the poor nutrient profiles of commercially packaged foods and fast-food restaurant dishes( Reference Gillespie, Maalouf and Yuan 13 , Reference Paeratakul, Ferdinand and Champagne 14 ) – notably high energy density and Na content – have raised the concern that eating away from home may also negatively affect diet quality in part due to the inferior nutrient composition of similar foods prepared in restaurants v. at home. Such disparities may arise in part because of differences in preparation methods, ingredients and recipes. For example, restaurant dishes may differ in added sugars, salt, Na-containing sauces or condiments, amounts and types of cooking fats used, and reliance on key ingredients that may be pre-processed( Reference Lee, Song and Cho 15 ). To date, however, studies evaluating differences in the nutrient composition of similar foods prepared in restaurants v. households are extremely scarce.
To fill this gap in the literature, we conducted an exploratory study in Hunan Province, China, in which we compared the nutrient composition of eight commonly consumed dishes prepared in restaurants v. at home by chemically determining the nutrient contents of these dishes. In addition, we analysed the composition of two dishes frequently ordered from fast-food restaurants and food stalls. Analyses in the present study focused on total fat and SFA, protein, energy density, Na and the Na:K ratio, all dietary factors highly associated with cardiometabolic functioning and chronic disease risk( Reference Setayeshgar, Ekwaru and Maximova 9 ). Along with differences in mean contents, we examined variability in nutrient contents and evaluated disparities in nutrient contents at extremes in the distribution, where higher intakes of these non-beneficial dietary factors may be especially relevant for health( Reference Prentice 16 ).
Materials and methods
Study samples
We randomly selected twenty of each of the following types of preparation locations in Changsha, Hunan Province, China: (i) small restaurants, defined as dining areas smaller than 30 m2 (~323 ft2) in size, without private dining rooms, and offering a vegetable dish cheaper than 20 Yuan (~$US 4); (ii) large restaurants, defined as dining areas 30–100 m2 (323–1076 ft2) in size, with private dining rooms, and offering vegetable dishes costing 20–30 Yuan ($US 4–6); (iii) households in urban areas of Changsha, the provincial capital city; and (iv) households in rural areas near that city. We also randomly selected ten Kentucky Fried Chicken (KFC) outlets, ten McDonald’s outlets and ten food stalls in the city. We purchased eight dishes, identified as the most commonly consumed dishes in this area based on data from the China Health and Nutrition Survey( Reference Popkin, Du and Zhai 17 ), from each of the forty full-service restaurants and asked each of the forty households to make the same eight dishes using their usual cooking practices. These dishes included five animal food-based dishes (sliced pork with dried bean curd; shredded pork with green pepper; stir-fried beef with garlic scape; stir-fried shredded chicken breast with red chili pepper; stir-fried tomato and scrambled eggs), two vegetable- or legume-based dishes (pan-fried tofu; stir-fried sponge gourd) and one grain-based dish (fried rice with eggs). We purchased Youtiao (Chinese-style fried dough) from each of the ten KFC and ten food stalls, and chicken burgers from each of the ten KFC and ten McDonald’s (McDonald’s do not sell Youtiao). We collected all dishes in previously acid-washed and heat-dried ceramic plates, and fast-food items (fried dough and chicken burgers) in paper bags.
Sample preparation
Each collection day, we randomly chose five sampling sites from the twenty preparation locations of each type (small restaurants, large restaurants, urban households and rural households) and five from the ten KFC, McDonald’s and food stalls. We collected the eight commonly consumed dishes or two fast-food items from each location and immediately transferred them to the central laboratory. We photographed, coded and weighed all samples, and subtracted the weight of plates and paper bags when we calculated the weight of food samples. We then pooled the five samples of the same dish from the same type of location and mixed them thoroughly in an acid-washed and heat-dried glass container. We drew 300 g of the mixed samples and homogenized them at room temperature. After homogenization, we split the sample into four 50 ml tubes, two of which were immediately transferred on dry ice to the collaborating accredited laboratory for analysis. The other two homogenized samples were stored at −80°C. The remaining samples were discarded. A total of four composite samples of each dish from each type of preparation location were produced, except in the case of fried dough, for which we analysed two composite samples from fast-food restaurants or food stalls.
Measurement of nutrient concentrations
We conducted a variety of chemical analyses on each composite sample. A total of thirty-one fatty acids and two unseparated fatty acids were determined with hydrolytic extraction followed by GC (model GC-2010 gas chromatograph; Shimadzu, Japan) according to the Chinese National Standards of GB/T 22223-2008( 18 ). SFA, MUFA and PUFA were calculated by summing the content of corresponding fatty acids. In detail, SFA included butyric, hexanoic, octanoic, decanoic, undecanoic, dodecanoic, tridecylic, tetradecanoic, pentadecanoic, hexadecanoic, heptadecanoic, octadecanoic, eicosanoic, docosanoic, tricosanoic and tetracosanoic acids; MUFA contained 9-tetradecenoic, cis-10-pentadecenoic, 9-hexadecenoic, cis-10-heptadecenoic, cis,trans-oleic, cis-11-eicosenoic and cis-13-docosenoic acids; and PUFA involved cis,trans-linoleic, γ-linolenic, α-linolenic, cis-11,14-eicosadienoic, cis-11,14,17-eicosatrienoic, arachidonic, cis-5,8,11,14,17-eicosapentaenoic and cis-13,16-docosadienoic acids. Since it has been recommended to replace SFA with unsaturated fatty acids (UFA) in the diet to lower CVD risk( Reference Sacks, Lichtenstein and Wu 19 ), we also estimated UFA as the sum of MUFA, PUFA and the unseparated methyl docosahexaenoate and tetracosenoic acids. Total fat content was defined as the sum of SFA, UFA and the unseparated cis-8,11,14-eicosatrienoic acid methyl ester and heneicosanoic acid. Total N content was determined with the Kjeldahl method (model KDM-A digital thermostat heater; Huawei, China) based on the national standardized method (GB 5009.5-2010)( 20 ), then multiplied by a conversion factor of 6·25 to convert into protein content( Reference Garza, Scrimshaw and Young 21 ). Total carbohydrates were determined with a spectrophotometric method (model UV-1780 spectrophotometer; Shimadzu), according to the established standard of GB/T 9695.31-2008( 22 ). Energy content (kcal/100 g) was defined as the sum of values of all energy-producing nutrients, including protein, fat and carbohydrate, multiplied by their energy conversion factor (4 kcal/g (17 kJ/g) for protein or carbohydrate; 9 kcal/g (37 kJ/g) for fat)( Reference Xu, Byles and Shi 23 ). The percentages of energy from protein, fat and carbohydrate were calculated. Flame atomic emission spectrometry was used for Na and K content (model AA-6880 atomic absorption spectrophotometer; Shimadzu) according to the standard methods of GB/T 5009.91-2003 released by the Standardization Administration of China( 24 ), and Na:K ratios were calculated. All analyses of the composite samples were carried out in duplicate and externally validated using certified reference materials. Chemical analysis output was given in grams per 100 g of food analysed for protein, fat and carbohydrate, in milligrams per gram of food analysed for Na and K, and in micrograms per gram of food analysed for various fatty acids.
Data analysis
We classified the eight dishes into three types: animal food-based (five dishes); vegetable/legume-based (two dishes); and grain-based (one dish). Nutrient and energy contents of each of the three types of dish were expressed as the mean and standard deviation and as percentiles (10th, 25th, 50th, 75th and 90th). Primary analyses were performed by comparing all restaurants with all households; supplementary analyses were done among various locations by stratifying restaurants into small and large types, and households into urban and rural types. Concentrations of nutrients and energy for all dishes combined were also described and differences in content by preparation location were analysed. Differences in the mean nutrient and energy contents of dishes provided by restaurants and households were evaluated by ANOVA. If the data were not normally distributed or the variance was heterogeneous, a logarithmic or square-root transformation was performed before analysis. Kruskal–Wallis tests were used whenever parametric test assumptions could not be satisfied. We used quantile regression models to estimate the significance of differences in nutrient and energy contents at higher v. lower percentiles of the distribution by dish preparation location. In addition, using the above-mentioned methods, we described the nutrient contents of the two fast foods, and evaluated how the contents of chicken burgers differed from other meat-based dishes (animal food-based dishes excluding stir-fried tomato and scrambled eggs) prepared in restaurants or households. P values less than 0·05 were considered statistically significant. All analyses were performed using the statistical software package SAS version 9.3.
Results
Macronutrient and energy contents, restaurant v. household dishes
Tables 1 and 2 present differences by preparation location in the nutrient and energy contents of each type of commonly consumed dish (animal food-based, vegetable/legume-based and fried rice), as well as differences for all dishes combined. On average, restaurant-prepared dishes showed higher fat, both in absolute amount (3·66 v. 3·22 g/100 g; P = 0·029) and as a percentage of energy (21·03 v. 16·04 %; P = 0·001), as well as higher contents of SFA (1·10 v. 0·84 g/100 g; P = 0·003) and PUFA (1·13 v. 0·83 g/100 g; P = 0·020) than household-prepared equivalents. There was a 15 % greater protein content in household-made dishes with animal foods compared with restaurant-made counterparts (45·51 v. 39·53 g/100 g; P = 0·029), as well as a 9 % higher energy content (231·29 v. 211·51 kcal/100 g (967·72 v. 884·96 kJ/100 g); P = 0·043). Similar to all dishes combined, for vegetable/legume-based dishes, both absolute concentration of fat (3·03 v. 1·89 g/100 g; P = 0·041) and the percentage of energy from fat (30·81 v. 18·22 %; P = 0·004), as well as absolute SFA content (0·90 v. 0·39 g/100 g; P < 0·001), were higher in restaurant-prepared versions.
Table 1 Differences in nutrient content of dishes by preparation location, Hunan Province, China. The study was conducted in August 2013 and the chemical measurements were performed during August–October 2013
UFA, unsaturated fatty acids.
* Statistical significance of P value is less than 0·05.
† Animal food-based dishes consist of sliced pork with dried bean curd, shredded pork with green pepper, stir-fried beef with garlic, stir-fried tomato and scrambled eggs, and stir-fried shredded chicken breast with red chili pepper.
‡ Vegetable/legume-based dishes include pan-fried tofu and stir-fried sponge gourd.
§ A logarithmic or square-root transformation was performed before ANOVA.
║ Kruskal–Wallis test was performed.
Table 2 Differences in energy content of dishes by preparation location, Hunan Province, China. The study was conducted in August 2013 and the chemical measurements were performed during August–October 2013
* Statistical significance of P value is less than 0·05.
† Animal food-based dishes consist of sliced pork with dried bean curd, shredded pork with green pepper, stir-fried beef with garlic, stir-fried tomato and scrambled eggs, and stir-fried shredded chicken breast with red chili pepper.
‡ Vegetable/legume-based dishes include pan-fried tofu and stir-fired sponge gourd.
§ A logarithmic or square-root transformation was performed before ANOVA.
║ Kruskal–Wallis test was performed.
We also found significant differences in protein, SFA, percentage of energy from fat and energy content in dishes combined among small restaurants, large restaurants, urban households and rural households (P < 0·05 for all; see online supplementary material, Supplemental Tables 1 and 2). On average, for all dishes combined, both urban (35·26 g/100 g) and rural (34·59 g/100 g) households displayed significantly higher protein content than small (30·77 g/100 g) and large (30·08 g/100 g) restaurants, while dishes prepared in both small restaurants (1·11 g/100 g) and large restaurant (1·09 g/100 g) had significantly higher SFA content compared with that from urban households (0·72 g/100 g). Dishes from small restaurants (21·42 %) had a higher percentage of energy from fat than those prepared in urban (15·29 %) or rural (16·80 %) households; a higher percentage of energy from fat in large restaurants (20·63 %) was observed only relative to urban households. Dishes prepared in households displayed predominantly high protein content and a significantly higher estimated energy content when prepared in both urban (198·24 kcal/100 g (829·44 kJ/100g)) and rural (195·84 kcal/100 g (819·39 kJ/100 g)) households v. in large restaurants (182·32 kcal/100 g (762·83 kJ/100 g)); the higher energy content in dishes relative to small restaurants (185·67 kcal/100 g (776·84 kJ/100 g)) was significant only for urban households. Concentrations of SFA in vegetable/legume-based dishes from various preparation locations were consistent with those in total dishes.
Supplemental Table 3 in the online supplementary material summarizes the percentiles for the distribution of nutrient and energy contents for each type of dish. Descriptive analyses indicated that percentiles (10th, 25th, 50th, 75th and 90th) of protein in total dishes prepared in households were somewhat higher compared with those in restaurant-prepared counterparts. Across the percentile distribution, differences between restaurants and households in the protein and energy contents of animal food-based dishes were similar to those in total dishes. In contrast, the percentiles for the distribution of absolute and relative fat contents and those of SFA content distribution in total dishes, as well as for each dish subtype, were likely to be higher in restaurants relative to households.
We employed quantile regression models to examine the significance of the association between preparation location and nutrient composition overall. Figures 1–3 show estimates over the quantiles for each nutrient and energy along with the 95 % CI. At higher quantiles, dishes prepared in households had significantly higher protein (Fig. 1(a)), energy density (Fig. 2(a)) and energy percentage from protein (Fig. 2(b)), and significantly lower fat contribution to energy (Fig. 2(c)), compared with those prepared in restaurants, although this was not observed at lower quantiles. Moreover, estimates of the restaurant–household disparity generally increased at higher quantiles for the percentage of energy from fat (Fig. 2(c)). Restaurant preparation significantly and positively influenced concentrations of SFA distribution in total dishes at all but the highest quantiles (Fig. 3(a)). Restaurant preparation was also positively associated with PUFA content in dishes at lower percentiles (Fig. 3(d)). Table 3 presents tabulated results of the energy and nutrient contents of dishes for a selected set of quantiles (10th, 50th and 90th). Compared with households, restaurant preparation was associated with a decrease of 5·38 (95 % CI −13·18, −1·32) g/100 g and 27·77 (95 % CI −45·19, −9·59) kcal/100 g (116·19 (95 % CI –189·07, –40·12) kJ/100 g) in protein content and energy density, respectively, at the 90th quantile. However, restaurant-prepared dishes had a significantly higher fat contribution to total energy of 11·65 (95 % CI 3·99, 21·31 %) % at the 90th quantile. Restaurant preparation was also associated with a greater SFA content of 0·18 (95 % CI 0·01, 0·39) and 0·44 (95 % CI 0·23, 0·67) g/100 g at the 10th and 50th quantiles, respectively, as well as with a higher PUFA content of 0·20 (95 % CI 0·02, 0·44) g/100 g at the 50th quantile.
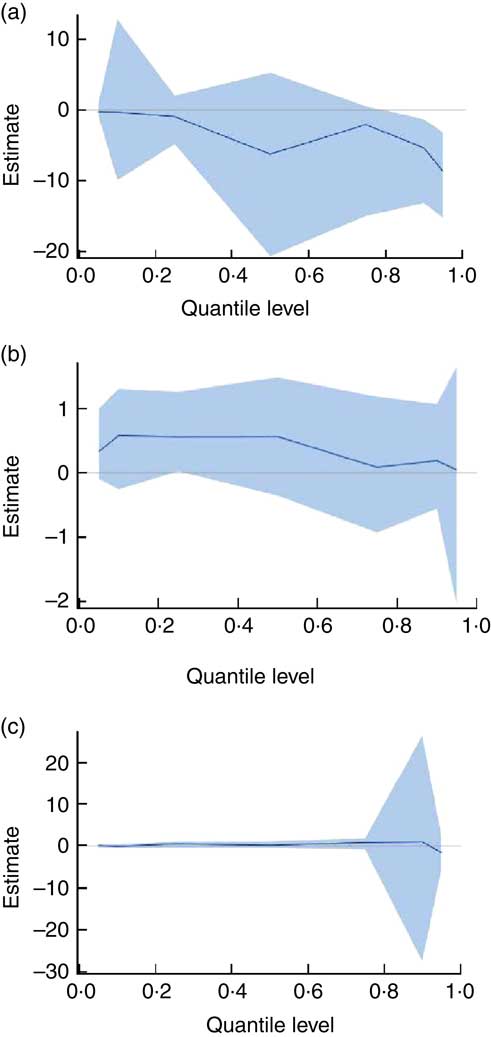
Fig. 1 (colour online) Effects of dish preparation location (restaurants v. households) on measured macronutrient content of dishes using quantile regression models, Hunan Province, China. Quantile regression estimates across quantiles of (a) protein, (b) fat and (c) carbohydrate are shown as the solid line. The shaded area around the estimates represents the 95 % CI for the estimates. Compared with household, restaurant negatively and positively influenced protein and fat content of total dishes across the quantiles, respectively. And restaurant positively influenced carbohydrate content at higher quantiles. The study was conducted in August 2013 and the chemical measurements were performed during August–October 2013
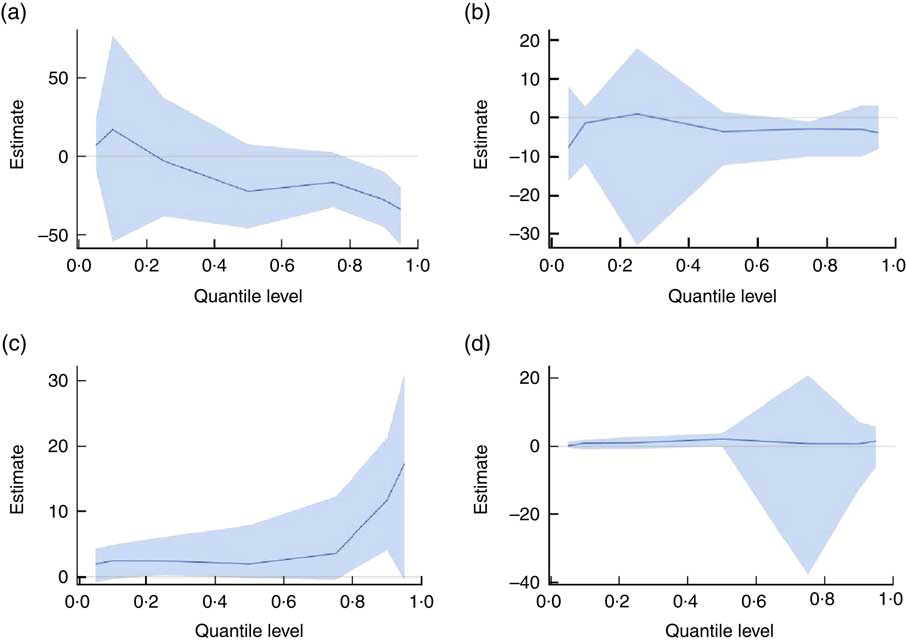
Fig. 2 (colour online) Effects of dish preparation location (restaurants v. households) on calculated energy content of dishes using quantile regression models, Hunan Province, China. Quantile regression estimates across quantiles of (a) energy, (b) percentage of energy from protein, (c) percentage of energy from fat and (d) percentage of energy from carbohydrate are shown as the solid line. The shaded area around the estimates represents the 95 % CI for the estimates. Dishes prepared in households seemed to have higher energy and energy from protein than those prepared in restaurants at higher quantiles. The findings of contribution of fat to energy were opposite. The study was conducted in August 2013 and the chemical measurements were performed during August–October 2013
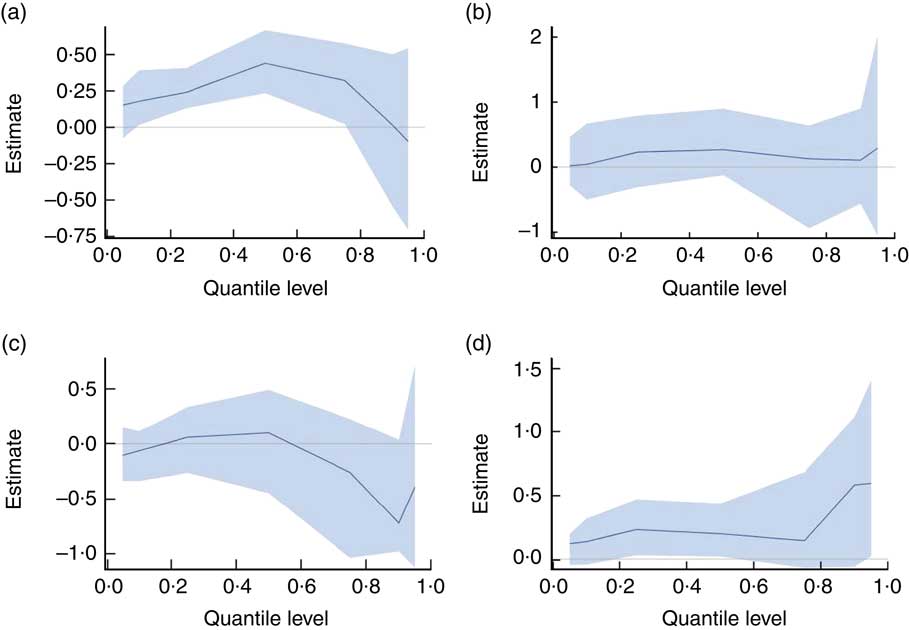
Fig. 3 (colour online) Effects of dish preparation location (restaurants v. households) on measured fatty acid content of dishes using quantile regression models, Hunan Province, China. Quantile regression estimates across quantiles of (a) SFA, (b) unsaturated fatty acids, (c) MUFA and (d) PUFA are shown as the solid line. The shaded area around the estimates represents the 95 % CI for the estimates. Restaurant-prepared dishes were likely to contain higher SFA and unsaturated fatty acids, especially PUFA, compared with household-prepared dishes. The study was conducted in August 2013 and the chemical measurements were performed during August–October 2013
Table 3 Effect of dish preparation location (restaurant v. household) on nutrient and energy contents: quantile regression estimates for selected quantiles of nutrient and energy distributions, Hunan Province, China. The study was conducted in August 2013 and the chemical measurements were performed during August–October 2013
UFA, unsaturated fatty acids.
* Statistical significance of P value is less than 0·05.
† Quantile regression estimate of the influence of restaurant on nutrient and energy content of total dishes relative to household as a reference.
Micronutrient contents, restaurant v. household dishes
On average, a lower concentration of K (3·78 v. 4·13 mg/g; P = 0·002) and higher Na:K (2·01 v. 1·74; P = 0·006) were found in restaurant-prepared total dishes relative to household-prepared counterparts as shown in Table 1. Dishes with animal foods prepared in restaurants showed higher Na:K than those from households (P = 0·049). Likewise, restaurant-made fried rice with egg displayed a significantly greater Na:K (P = 0·004) than household-prepared equivalents, although only marginal significance was observed for higher Na (P = 0·079) and lower K (P = 0·060) individually.
Similar analyses were employed to investigate differences in nutrient contents by subtypes of dish preparation location (see online supplementary material, Supplemental Table 1). On average, K content in total dishes was significantly different among four types of preparation location (P < 0·001); the highest K was found in urban households (4·31 mg/g), while the lowest in large restaurants (3·60 mg/g). Additionally, significantly different Na:K ratio among various preparation locations was found in both dishes with animal foods (P < 0·026) and fried rice with egg (P < 0·031). Na:K ratio in large restaurant-prepared dishes with animal foods (1·42) and fried rice (5·02) was higher than in urban household-prepared counterparts (1·10 and 3·76, respectively). Fried rice prepared in small restaurants also showed higher Na:K (4·94) relative to that prepared in urban households (3·76).
In general, the percentiles of Na in restaurant-prepared dishes, both for total dishes and dish types, tended to be high in comparison with household-prepared equivalents, although a negligible high Na content at more extreme percentiles (i.e. the 10th and 90th) was observed in some household-prepared dishes (see online supplementary material, Supplemental Table 3). Quantile regression models showed that in general coefficients for restaurant preparation increased with higher quantiles of Na, except at the extremes (Fig. 4(a)). However, there was no significant association with preparation location at any of the selected quantiles (10th, 50th and 90th) for Na, K or their ratio (Table 3).
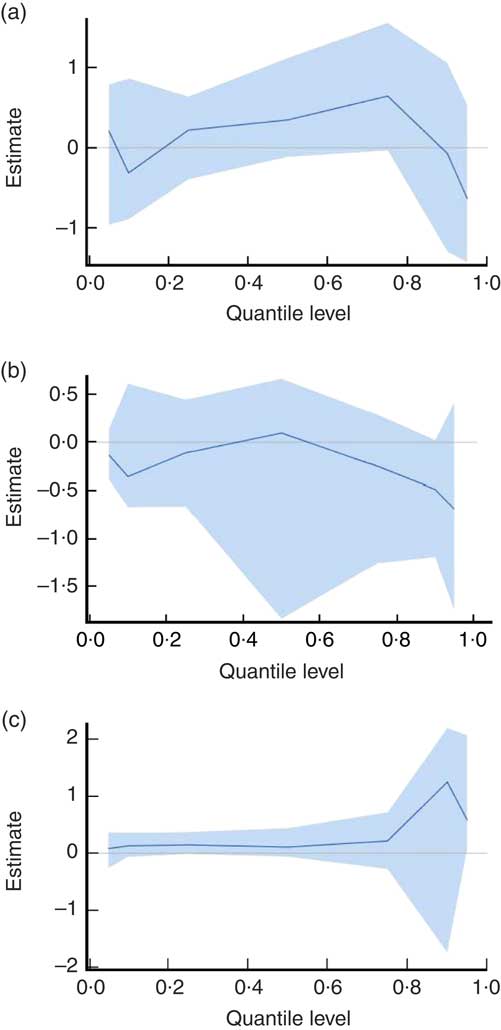
Fig. 4 (colour online) Effects of dish preparation location (restaurants v. households) on measured micronutrient content of dishes using quantile regression models, Hunan Province, China. Quantile regression estimates across quantiles of (a) sodium, (b) potassium and (c) ratio of sodium to potassium are shown as the solid line. The shaded area around the estimates represents the 95 % CI for the estimates. Restaurant-prepared dishes tended to have higher sodium and ratio of sodium to potassium than household-prepared counterparts. The study was conducted in August 2013 and the chemical measurements were performed during August–October 2013
Nutrient and energy contents of common fast-food dishes
We also examined the nutrient and energy contents of two common fast foods (chicken burgers and fried dough) typically obtained only in fast-food restaurants and food stalls (see online supplementary material, Supplemental Table 4), and compared the macronutrient and energy contents of chicken burgers with those of total meat-based dishes prepared either in full-service restaurants or at home in the present study (Supplemental Table 5). The mean estimated energy content of chicken burgers (283·89 kcal/100 g (1187·80 kJ/100 g)) was significantly greater than that of other common meat-based dishes prepared in restaurants (231·71 kcal/100 g (969·47 kJ/100 g); P = 0·001). In addition, the mean absolute (36·17 g/100 g) and relative (50·64 % of energy) concentrations of protein in chicken burgers were lower than those in meat-based dishes from either restaurants (45·07 g/100 g and 77·54 % of energy) or households (52·06 g/100 g and 80·73 % of energy; P < 0·05 for all). As expected given the high bread content, the opposite pattern was found for carbohydrate, with higher concentrations in chicken burgers than in other common meat-based dishes. No significant differences were observed for fat.
Regarding Chinese-style fried dough, the mean Na:K ratio and the absolute and relative energy from carbohydrate appeared to be higher in samples from fast-food restaurants compared with those from food stalls (4·20 v. 2·66 for Na:K, 50·04 v. 46·65 g/100 g for carbohydrate and 63·43 v. 59·30 % for energy contribution from carbohydrate). We further compared the nutrient composition of Chinese fried dough with US doughnuts (National Nutrient Database, No. 18253), as there was no comparable food from restaurants or households in the present study. The mean Na, K and protein content in our samples of fried dough were higher than levels reported in US doughnuts. Concentrations of these nutrients in fried dough v. in US doughnuts were 7·37 v. 3·45 mg/g for Na, 2·22 v. 0·78 mg/g for K and 23·56 v. 3·10 g/100 g for protein.
Discussion
With the exception of a few countries like the USA, which collect food composition data on branded foods, for most settings there is limited evidence on the extent to which commercial dishes, including those prepared in restaurants, may contain excessive concentrations of nutrients of concern such as Na and fat( Reference Ng and Dunford 25 ). This is particularly true for low- and middle-income countries, where there are few data on the potential differences in nutrient composition of dishes prepared in restaurants v. at home, despite an increase in food eating away from home( Reference Wang, Wang and Xue 26 ). The present study collected and chemically analysed samples of eight frequently consumed dishes prepared in multiple restaurants v. in households in Hunan Province, China to compare concentrations of nutritional components of public health concern. Our key finding was that on average, compared with those from households, dishes prepared in restaurants had a higher Na:K ratio, as well as higher absolute and relative contents of fat, most notably a greater SFA content, all nutrients identified as important dietary risk factors for chronic disease development( Reference Sacks, Lichtenstein and Wu 19 , Reference Whelton 27 , Reference Guasch-Ferre, Babio and Martinez-Gonzalez 28 ). Quantile regression models were employed to determine the extent to which differences in nutrient composition of dishes by preparation location varied not only at the mean, but also at the higher levels of the distribution where the influence on dietary intake may be especially potent. We found significantly lower levels of protein and energy, and a higher percentage of energy from fat, in restaurant- v. home-prepared dishes at the 90th quantile. A significant positive influence of restaurant preparation on SFA content was observed at the 10th and 50th quantiles. These findings from our study in China provide intriguing insights into the potential additional contribution – beyond the influence of food choices and portion sizes – of differences in nutrient composition to adverse nutritional impacts related to eating in restaurants as compared with the same dishes prepared in the home.
In supplementary analyses, we also found that dishes prepared in both small and large restaurants had a notably higher percentage of energy from fat than those prepared in urban and rural households (21·42 and 20·63 v. 15·29 and 16·80 %, respectively), and more pronounced SFA content than that in urban households (1·11 and 1·09 v. 0·72 g/100 g, respectively). Conversely, the protein content of dishes was considerably lower in small and large restaurants than in urban and rural households (30·77 and 30·08 v. 35·26 and 34·59 g/100 g, respectively). Dishes prepared in large restaurants also had the lowest K relative to other preparation locations. However, given our modest sample size and dish types, it is uncertain to what extent these findings may reflect variation in nutrient composition typical among dishes from these diverse types of restaurants and household settings.
There is considerable evidence that dietary Na and K intakes are associated with hypertension, which plays a key role in the development of CVD( Reference Okayama, Okuda and Miura 29 ). As a consequence, a growing body of research has focused not only on Na intake, but also on the Na content of foods prepared and consumed away from home, the frequency of which has risen steadily in recent decades( Reference An 30 – Reference Wu and Sturm 32 ). Increasing attention to the potential health hazard posed by Na may motivate food reformulation and recipe adjustments by commercial establishments( Reference Ahuja, Wasswa-Kintu and Haytowitz 33 ). In our study, at most percentiles, the Na content was higher in dishes prepared in restaurants relative to those prepared in households. However, it is also important to note that at the highest quantiles, the Na content in home-prepared dishes in our sample from China was also high, indicating that Na content may also be problematic in dishes prepared in some households.
Previous studies in a representative sample of Chinese adults estimated the mean Na intake to be 4700 mg/d( Reference Du, Batis and Wang 34 ), far above the current WHO recommendation of <2000 mg/d (5 g salt/d)( 35 ), the US dietary guideline of <2300 mg/d( 36 ) and the Chinese recommendation of <2400 mg/d (6 g salt/d)( Reference Wang, Lay and Yu 37 ). Studies in China have shown that 43·7 % of salt intake comes from household cooking and 43·4 % from eating out, or a total of about 90 % added during cooking (households plus cafeterias/restaurants)( Reference Zhang, Zhao and Zhang 38 , Reference Zhao, Zhang and Zhang 39 ). Thus both household eating and dining out are major sources of Na consumption in China, where most Na is from discretionary sources; that is, from the use of added salt and Na-rich condiments such as soya sauces to dishes during cooking( Reference Zhang, Zhao and Zhang 38 , Reference Anderson, Appel and Okuda 40 ).
In recent years, the prevalence of hypertension in China has increased to 25·2 % in adults over the age of 18 years, as the country experienced rapid economic development, urbanization, population ageing and changes in traditional dietary habits and lifestyle( Reference Hu, Huang and You 41 ). A higher dietary Na:K ratio is a significant risk factor not only for incidence of hypertension and CVD, but also for mortality from total and subtypes of stroke, CVD and all causes( Reference Okayama, Okuda and Miura 29 ). Our study found a greater mean Na:K ratio in total dishes, especially animal food-based dishes and fried rice with egg, prepared in restaurants v. households, with the greatest difference of 24·8 % found in egg fried rice. The higher Na:K ratio in restaurant-prepared versions of common dishes may exacerbate the adverse impact of frequent restaurant consumption on health, and is of special concern in China. An international study comparing intake of Na, K and their ratio using two 24 h urinary measures among Chinese, Japanese, UK and US populations found higher Na, lower K and hence a higher Na:K ratio in Asian diets, and especially the Chinese sample( Reference Zhou, Stamler and Dennis 42 ).
Regarding macronutrients, data from the present study showed a higher fat content as well as a higher contribution of fat to energy, largely as a result of differences in vegetable/legume-based dishes, for foods prepared in restaurants compared with at home. In addition, there was a significantly higher protein content in dishes with animal foods prepared at home. Numerous studies in the USA and Europe have reported that restaurant consumption was associated with an increase in intake of total fat rather than protein or carbohydrates( Reference An 30 , Reference Orfanos, Naska and Trichopoulou 43 ). Although these studies did not take account of a potential difference in food composition between restaurant and household versions of the same dishes, they indicated restaurant consumption could be a risk factor for higher total fat intake, driven by differences in food choices and portions. Moreover, the finding of higher fat content in restaurant-prepared dishes, especially vegetable/legume-based dishes, was especially linked to higher levels of SFA than to UFA, which may imply potentially greater adverse health impact of eating out. It has been recommended to decrease SFA in the diet based on its influence on LDL cholesterol, a leading cause of atherosclerosis( Reference Sacks, Lichtenstein and Wu 19 ). Dietary guidelines for both Chinese and American populations recommend consuming <10 % of energy from SFA for the general population and replacing SFA with UFA( 36 , Reference Wang, Lay and Yu 37 ). At present, SFA intake in China may be relatively low. The Chinese Nutrition and Health Survey 2002, based on dietary recall data, reported that the 75th percentile of the SFA contribution to energy in adults was 8·9 %, and that edible oils (contributing 44·7 % to total SFA intake, in which 36·7 % is from animal oil, a unique dietary habit for the Chinese population in previous years) and animal foods (43·2 %) were the top two sources of dietary SFA( Reference Zhang, Meng and Jiang 44 ). We found a significantly higher absolute concentration of SFA in restaurant-prepared dishes than in household-prepared counterparts, as well as a higher percentage of energy from SFA (data not shown, 0·72 v. 0·47 %, P = 0·002). These findings suggest that even without changes in food choices, increased eating in restaurants might lead to increased intake of SFA. Taken together, the macronutrient composition of common restaurant foods may exacerbate non-beneficial patterns of nutrient intake in China. The higher fat content we observed in restaurant-prepared non-animal dishes may be due to factors such as the addition of more edible oils, while the greater amount of protein in dishes with animal foods prepared in households might reflect the use of higher quality (i.e. lean) and/or larger amounts of meat relative to restaurant recipes. It was surprising that there was greater PUFA content in restaurant-prepared dishes, which may be attributed to differentiated availability of edible oils (67·2 %), plant foods (20·8 %) and animal foods (12·0 %), the top three sources of dietary PUFA in the general population in China( Reference Zhang, Meng and Jiang 44 ), between restaurants and households. Particularly, restaurants may use PUFA-rich edible oils, such as rapeseed, soyabean and salad oils, which are major contributors( Reference Zhang, Meng and Jiang 44 ).
Many fast-food dishes are typically considered ‘junk food’ due to their poor nutrient content and high energy density( Reference Bauer, Hearst and Earnest 45 ). To further evaluate the potential influence of restaurant fast-food consumption on diet quality, we also measured and compared the composition of popular foods from this type of restaurant with more traditional counterpart foods (chicken burgers v. other meat-based dishes) or with comparable US foods (Chinese fried dough v. US doughnuts). In the present study, we found a greater energy density in chicken burgers from fast-food restaurants (284 kcal/100 g (1188 kJ/100 g)) relative to other common meat-based dishes (232 kcal/100 g (971 kJ/100 g)) purchased from full-service restaurants, suggesting that frequent consumption of certain fast-food meals may potentially contribute to greater energy intake. In addition, compared with US doughnuts in the US Department of Agriculture’s food composition database, the Chinese-style fried dough analysed in samples collected for the current study had a considerably higher Na content, as well as a lower Na:K ratio, and a higher protein content. Together, these disparities in nutrient content suggest the possibility that, as reported in US studies( Reference Barnes, French and Mitchell 46 ), frequent consumption of common fast-food restaurant dishes may be associated with less beneficial nutrient intakes. However, further study of larger samples is warranted given that large variability in the energy and nutrient contents of similar fast foods has been reported both between and within countries( Reference Ziauddeen, Fitt and Edney 47 ). Although data are limited, food reformulation and shifts in products offered to improve nutritional profiles associated with eating in fast-food restaurants may be warranted to help improve diet quality worldwide.
A few limitations of the present study should be noted. After recruitment into the study, it is uncertain whether, and to what extent, households may have made potential changes in ingredients and recipes when preparing dishes compared with their usual methods. The study performed chemical determination of various nutrients in dishes. Unfortunately, fibre, an important contributor to energy which is also of interest due to its potential role in energy intake regulation, were not included. Although our data enabled us to analyse estimated total SFA concentrations, it is important to keep in mind that the health implications of specific SFA, such as those in coconut oils and dairy products, remain uncertain( Reference DiNicolantonio, Lucan and O’Keefe 48 – Reference Pimpin, Wu and Haskelberg 50 ). Additionally, we were only able to investigate a limited number of dishes and food preparation locations collected in one major metropolitan area, which limits our ability to generalize broadly from these findings.
Conclusion
In conclusion, the present study measured the nutrient content of common restaurant- and household-prepared equivalent dishes and found higher-quality dishes in the home. For example, the absolute and relative fat contents, SFA and Na:K ratio were higher in dishes prepared in restaurants than households, while the protein content was higher in animal food-based dishes prepared in households v. in restaurants. These findings provide important insight into food composition differences between restaurant- and home-prepared dishes, which may contribute to different diet quality between restaurant and household eating beyond the influence of restaurant eating on food choices and portions. With the rapid industrialization of the Chinese food supply, we might expect congruence with excessive Na and fat (SFA) from eating away from home; however, there is no programme to systematically examine Na or other nutrient contents in restaurant foods in China. More research is needed to understand how the transformation of food consumption patterns will affect the nutritional status and health of the Chinese people.
Acknowledgements
Acknowledgments: The authors wish to thank Ms Frances L. Dancy for administrative assistance, and Ms Denise Ammons for graphics support, and for research assistance. Financial support: The authors are grateful for funding from the National Institutes of Health (NIH) to the Carolina Population Center at the University of North Carolina at Chapel Hill (grant number P2C HD050924) and for research grants from the NIH (grant numbers R01 HD30880, P30 DK056350, R01 HD38700); the NIH Fogarty International Center (grant number D43 TW009077); and Hunan Center for Disease Control and Prevention for financial support. The funding agencies had no role in the design, analysis or writing of this manuscript. Conflict of interest: None. Authorship: X.J. and J.L. contributed equally to this work. M.A.M., S.D., J.L. and B.M.P. designed the study; J.L., D.J., Z.F. and H.L. collected and processed all samples; B.C. was responsible for all the laboratory measurements; X.J., S.D. and M.A.M. analysed the data and wrote the manuscript. All authors significantly revised and approved the final manuscript. Ethics of human subject participation: Not applicable.
Supplementary material
To view supplementary material for this article, please visit https://doi.org/10.1017/S1368980017003779


