Practical methods for use in clinics and in the field to measure fat-free mass (FFM) or lean body mass in infants and children are largely based on anthropometry (such as height or length and weight) and recently introduced bioelectrical impedance analysis (BIA) techniques. Based on these methods, equations have been developed for children in both developed and developing countries. We could identify two equations(Reference Mellits and Cheek1, Reference Morgenstern, Mahoney and Warady2) based on length or height and weight and three based on the BIA technique (Fjeld et al. (Reference Fjeld, Freundt-Thurne and Schoeller3), Bocage(Reference Bocage4) and Kushner et al. (Reference Kushner, Schoeller and Fjeld5)) for infants and children. Before we can use any of these equations with confidence on a population different from those on whom these equations were developed, it is important to validate them.
We have earlier reported our evaluation of the two equations above based on length or height and weight using stable-isotope (2H2O) dilution as the reference method(Reference Sen, Mahalanabis and Shaikh6). However, equations based on conventional anthropometry, i.e. length and weight, have the inherent limitation in that they do not critically distinguish between FFM and fat mass. On the other hand, the theoretical basis of bioelectrical impedance analysis indicates that it is well suited to assess total body water (TBW)(7). The method is based on the phenomenon that only water (containing electrolytes) in the human body can conduct electricity. Fat is relatively devoid of water and restricts the flow of current through it. At any given current frequency the impedance of a cylindrical system is a function of length and cross-sectional area. In a steady-state condition, TBW correlates well with FFM. The BIA equipment is easily carried to the community for population-based studies. In the present study, we have evaluated three published equations based on BIA for TBW in children in India aged between 6 and 24 months, using the 2H2O dilution technique as the reference method. The present report is based on our analysis of the data generated in our study reported earlier(Reference Sen, Mahalanabis and Shaikh6).
Subjects and methods
Subjects
As described previously(Reference Sen, Mahalanabis and Shaikh6), eighty-six children, aged 6–24 months, participated in the study. The study was done in apparently healthy children from among the urban poor attending an immunisation clinic of a large charitable government hospital in the city of Kolkata where free service is provided. The immunisation clinic is held once per week. Each week we interviewed the first four mothers who registered their children in the weekly clinic and we aimed to recruit up to two children each week. The recruitment was spread over a period of 1 year.
The eligibility criteria for inclusion in the study were: aged 6–24 months of either sex; absence of illness during the preceding 1 month; absence of gross congenital anomalies and chronic diseases; parents' willingness to participate. These children were of low socio-economic status, and records on birth weight and gestation were not available for consideration. The birth dates were precise as they were based on birth certificates. Written informed consent was obtained from the parents.
Sample size
As described previously(Reference Sen, Mahalanabis and Shaikh6), the sample size depended on the magnitude of deviation from zero of the difference in the measured quantity derived by the reference method (i.e. by 2H2O dilution) and the method under study and its CI, that would be acceptable for the purpose that the method would be used and therefore could only be indicative. The comparisons were paired, i.e. the results from the two methods on each subject were compared. We calculated the sample size to detect 1·5 % or more deviation from zero difference with a standard deviation of 2. To detect this degree of deviation with 95 % CI and 90 % power we needed a sample of seventy-one subjects in each group(Reference Pocock8). Since the same subject would provide data of TBW by both the criterion method and the comparison methods the calculated sample size remained the same (i.e. seventy-one subjects). We added 12 % to this number for possible dropout to give a sample size of eighty subjects.
Bioelectrical impedance analysis
BIA measures impedance of the body to a small electric current. The generic theoretical model treats the body as a single cylinder, with measurements made between electrodes placed manually on the wrist and ankle. Adjustment of bioelectrical data for height allows estimation of TBW. The theoretical relationship(Reference Nyboer9) is as follows:
where V is the volume of the body water in the subject, Z is impedance and L is the length of the subject. In the present study, impedance and resistance were measured with a multi-frequency bioelectrical impedance analyser (Xitron model 4000b; Xitrons Technologies Inc., San Diego, CA, USA) using a single frequency of 50 kHz. Children with dry light clothes lay supine(Reference Deurenberg, Weststrate and Paymans10, Reference Deurenberg, van der Kooy and Leenen11) with arms apart from the body and legs separated so that the thighs did not touch. After cleaning the skin contact area with alcohol, one pair of electrodes (foil disposable 5 cm2 electrocardiogram (ECG) electrodes) was placed on the dorsal surfaces of the right hand at the distal metacarpal joints and between the distal prominence of the right radius and ulna. Another pair was placed at the distal metatarsal joints and between the lateral malleoli of the right foot.
Anthropometric measurements
The anthropometric measurements were made using recommended protocols(Reference Lohman, Roche, Martorell, Lohman, Roche and Martorell12, Reference Cameron, Hauspie, Cameron and Molinari13) and are briefly described. The measurements were taken on the same day that the infant underwent the 2H2O dilution and BIA procedures.
Length
Recumbent length was measured with a wooden measuring board as described earlier(Reference Shaikh, Mahalanabis and Kurpad14). The board was made sufficiently broad to cover the shoulder blades. The reading was taken to the nearest 0·1 cm.
Weight
Weight was measured nude, using an electronic platform balance (model no. L111A; Avery India Ltd, Ballabgarh, India) with a precision of 10 g. The balance was checked regularly for accuracy using standard weights.
2H-labelled water dilution method
2H2O, water with a stable isotope of hydrogen, was used and has been described previously(Reference Sen, Mahalanabis and Shaikh6). This measurement took place between 09.00 and 14.00 hours. Because of their age, the infants were not fasted. A vast majority of them were breast-fed (88 %). No food other than breast-feeding was allowed for 3 h before administrating the 2H2O. Breast-feeding was stopped 1 h before administrating the 2H2O. As expected, the infants were normally hydrated, as judged clinically at the time of the test. Children's baseline saliva was collected by a disposable syringe. We took a measured volume of 2H2O (99·9 %; Sigma, St Louis, MO, USA) approximately equivalent to 50 mg/kg body weight in a disposable container (2H2O specific gravity = 1·107). We weighed the 2H2O dose using a precision balance and the weight with an accuracy of 0·1 mg was recorded and used in calculating TBW. It was then mixed with 20 ml distilled water and the child drank it from a disposable syringe. The empty container was rinsed with two consecutive lots of 15 ml distilled water and the child drank both lots from the same disposable syringe. Time was allowed to equilibrate the 2H2O into the body fluid. No food or fluid including breast milk and water was permitted during the equilibration period of 3 h. At the end of the equilibration period the second sample of saliva was collected and analysed for 2H-labelled water using a duel-inlet mass spectrometer (Europa Scientific, Crewe, Ches, UK), using the Zn reduction technique. The results of 2H2O concentration in the saliva samples were used for calculating the TBW.
The following equation was used(Reference Sen, Mahalanabis and Shaikh6):
TBW (mol) was calculated as follows:
(using concentrations in saliva samples).
In using 2H for estimating TBW, it should be noted that this isotope undergoes some exchange with non-aqueous hydrogen and a correction factor of 1·041 was used. The FFM was calculated as TBW divided by an age- and sex-specific hydration factor for FFM and for this age group that ranged from 80·7 to 77·0 for boys and from 80·7 to 78·0 for girls(Reference Butte, Hopkinson and Wong15).
Bioelectrical impedance analysis-based published equations
The prediction equations for TBW (measured in kg; TBWkg) using weight, length and resistance that we evaluated in the present study are given below.
BIA-based equation of Fjeld et al. (Reference Fjeld, Freundt-Thurne and Schoeller3) (BI-1) on Peruvian children aged 3–30 months:
BIA-based equation of Bocage(Reference Bocage4) (BI-2) on Jamaican children aged 3–18 months:
BIA-based equation of Kushner et al. (Reference Kushner, Schoeller and Fjeld5) (BI-3) on children aged 1–60 months:
where H is length in cm, W is weight in kg and R is resistance at 50 kHz.
The equation of Kushner et al. (Reference Kushner, Schoeller and Fjeld5) was derived on preschool children of Lima, Peru and on premature neonates in the USA.
We used the same age- and sex-specific hydration factors for FFM(Reference Butte, Hopkinson and Wong15) for calculating FFM from TBW derived by these BIA-based equations as was done for TBW measured by the 2H2O dilution technique.
Statistical analysis
Epi Info (version 6.0; Centers for Disease Control and Prevention, Atlanta, GA, USA) and Stata (version 7.0; StataCorp LP, College Station, TX, USA) were used for data entry and statistical analysis. For anthropometry data, a software package based on National Center for Health Statistics database as provided with the Epi Info software was used. As is conventionally done, correlation and regression analysis was used to compare the TBW based on BIA with the reference method, i.e. the 2H2O dilution technique. We plotted the results along the ‘line of equality’ (i.e. the line at a 45° angle) to visually examine the concordance(Reference Bland and Altman16). Further, the difference in TBW for each subject between each of the three BIA equations and 2H2O dilution (paired data) were evaluated for their difference from zero by t test. The mean of the difference ± 2sd was calculated to derive the range within which 95 % of the values were expected to lie(Reference Bland and Altman16).
Ethical approval
The present study was conducted according to the guidelines laid down in the Declaration of Helsinki and all procedures involving human subjects were approved by the Ethics Review Committee of the Society for Applied Studies, Kolkata, India. Written informed consent was obtained from the parents of all subjects.
Results
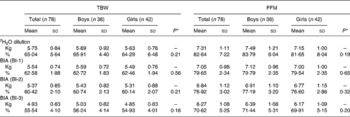
Eighty-six children participated in the present study and were described in an earlier study(Reference Sen, Mahalanabis and Shaikh6). In eight of them, the 2H2O procedures were incomplete because of vomiting or being fed during the equilibration period. They were dropped from the study. The study infants were predominantly breast-fed (88 %). They came from among the urban poor. Only 10 % of the families lived in houses of permanent structure. A total of 65 % lived and cooked in one room. The median monthly family income was 40 US$. Of the mothers, 13 % were illiterate, 35 % had 1–5 years, 42 % had 6–10 years and the remaining 10 % had more than 10 years of school education. Characteristics of the study children are shown in Table 1. Weight-for-age, length-for-age and weight-for-length standard deviation scores suggest some degree of underweight, wasting and stunting. Using the three published equations of BI-1, BI-2 and BI-3 and by 2H2O dilution we derived TBW in kg (TBWkg) (Table 2). Based on BI-1, BI-2 and BI-3 equations the mean TBW values were 2·46 % (P < 0·001), 4·62 % (P < 0·001) and 9·50 % (P < 0·0001) lower than the reference 2H2O method, respectively. Calculated TBW and FFM using the 2H2O dilution technique and the three BIA equations are shown in Table 2. The mean FFM values derived by BI-1, BI-2 and BI-3 were 2·98 % (P = 0·0002), 5·72 % (P < 0·001) and 12·02 % (P < 0·001) lower than the reference method, respectively (Table 3). However, there was no statistical sex difference in FFM or TBW. The mean and standard deviations of paired values of the difference in FFM in kg (FFMkg) and as percentage of body weight between those derived by 2H2O dilution and each of the three equations under study and 95 % CI of the difference are shown in Table 3. For comparison we have also given in Table 3 the results comparing the 2H2O reference method and each of the two anthropometry-based equations reported previously(Reference Sen, Mahalanabis and Shaikh6). The two anthropometry-based equations gave better agreement with the reference method than any of the three BIA-based equations. FFMkg derived by the equation BI-1 gave comparatively better agreement with the reference method than either of the other two equations; the 95 % limits of agreement with the reference method (i.e. mean difference ± 2sd) were − 0·87 to 1·38, − 0·66 to 1·60 and − 0·15 to 2·22 for BI-1, BI-2 and BI-3, respectively. Distribution of points for TBWkg along the line of identity (i.e. at 45°) between the 2H2O and BI-1, BI-2 and BI-3 method, respectively, are shown in Fig. 1(a)–(c). Similarly, FFMkg values are plotted in Fig. 2(a)–(c). Bland–Altman plots of the differences in TBWkg in each participant between 2H2O and each of the equations BI-1, BI-2 and BI-3 against average TBWkg are shown in Fig. 1(d)–(f); mean differences were 0·21, 0·38 and 0·82, respectively.
Table 1 Characteristics of subjects

WHZ, weight-for-length standard deviation score; WAZ, weight-for-age standard deviation score; HAZ, height-for-age standard deviation score.
* As measured by bioelectric impedance analysis at 50 kHz.
† WHZ, WAZ and HAZ standard deviation scores compared with National Center for Health Statistics (NCHS) reference (Epi Info, version 6.0; Centers for Disease Control and Prevention, Atlanta, GA, USA).
Table 2 Total body water (TBW) and fat-free mass (FFM) in kg and as percentage body weight derived by the three equations under study and by the 2H2O dilution technique (reference method)
(Mean values and standard deviations)

BIA, bioelectrical impedance analysis; BI-1, BIA-based equation of Fjeld et al. (Reference Fjeld, Freundt-Thurne and Schoeller3); BI-2, BIA-based equation of Bocage(Reference Bocage4); BI-3, BIA-based equation of Kushner et al. (Reference Kushner, Schoeller and Fjeld5).
* Between boys and girls.
Table 3 Difference in fat-free mass (FFM) (of paired values) in kg and as percentage body weight between those derived by 2H2O dilution and by each of the three equations under study and each of the two equations based on anthropometry as published previously(Reference Sen, Mahalanabis and Shaikh6)
(Mean values and standard deviations and 95 % confidence intervals of the difference)

BIA, bioelectrical impedance analysis; BI-1, BIA-based equation of Fjeld et al. (Reference Fjeld, Freundt-Thurne and Schoeller3); BI-2, BIA-based equation of Bocage(Reference Bocage4); BI-3, BIA-based equation of Kushner et al. (Reference Kushner, Schoeller and Fjeld5); AN-1, anthropometry methods of Mellits & Cheek(Reference Sen, Mahalanabis and Shaikh6); AN-2, anthropometry methods of Morgenstern et al. (Reference Sen, Mahalanabis and Shaikh6).
* The t test evaluates the difference of the paired values from zero.

Fig. 1 (a) Individual data points for total body water (TBW) in kg comparing values derived by the reference method (2H2O dilution method) with the bioelectrical impedance analysis (BIA) equation (Fjeld et al. (Reference Fjeld, Freundt-Thurne and Schoeller3); BI-1) under study are plotted along the ‘line of identity’ at the angle of 45° (R 2 0·72). (b) Individual data points for TBW in kg comparing values derived by the reference method (2H2O dilution method) with the BIA equation (Bocage(Reference Bocage4); BI-2) under study are plotted along the line of identity (R 2 0·74). (c) Individual data points for TBW in kg comparing values derived by the reference method (2H2O dilution method) with the BIA equation (Kushner et al. (Reference Kushner, Schoeller and Fjeld5); BI-3) under study are plotted along the line of identity (R 2 0·71). (d) Bland–Altman plots of the difference in each participant between TBW in kg derived by the 2H2O dilution method and the BI-1(Reference Fjeld, Freundt-Thurne and Schoeller3) method under study plotted against the average of the TBW in kg by the 2H2O method. The solid line and the dotted lines are the mean and 2 sd of the differences, respectively. Mean difference 2H2O − BI-1 = 0·21 (sd 0·44) kg (P = 0·0001). (e) Bland–Altman plots of the difference in each participant between TBW in kg derived by the 2H2O dilution method and the BI-2(Reference Bocage4) method under study plotted against the average of the TBW in kg by the 2H2O method. The solid line and the dotted lines are the mean and 2 sd of the differences, respectively. Mean difference 2H2O − BI-2 = 0·38 (sd 0·44) kg (P < 0·0001). (f) Bland–Altman plots of the difference in each participant between TBW in kg derived by the 2H2O dilution method and the BI-3(Reference Kushner, Schoeller and Fjeld5) method under study plotted against the average of the TBW in kg by the 2H2O method. The solid line and the dotted lines are the mean and 2 sd of the differences, respectively. Mean difference 2H2O − BI-3 = 0·82 (sd 0·47) kg (P < 0·0001).

Fig. 2 (a) Individual data points for fat-free mass (FFM) in kg comparing values derived by the reference method (2H2O dilution method) with the bioelectrical impedance analysis (BIA) equation (Fjeld et al. (Reference Fjeld, Freundt-Thurne and Schoeller3); BI-1) under study are plotted along the ‘line of identity’ at the angle of 45° (R 2 0·74). (b) Individual data points for FFM in kg comparing values derived by the reference method (2H2O dilution method) with the BIA equation (Bocage(Reference Bocage4); BI-2) under study are plotted along the line of identity (R 2 0·76). (c) Individual data points for FFM in kg comparing values derived by the reference method (2H2O dilution method) with the BIA equation (Kushner et al. (Reference Kushner, Schoeller and Fjeld5); BI-3) under study are plotted along the line of identity (R 2 0·73). (d) Bland–Altman plots of the difference in each participant between FFM in kg derived by the 2H2O dilution method and the BI-1(Reference Fjeld, Freundt-Thurne and Schoeller3) method under study plotted against the average of the FFM in kg by the 2H2O method. The solid line and the dotted lines are the mean and 2 sd of the differences, respectively. Mean difference 2H2O − BI-1 = 0·25 (sd 0·56) kg (P = 0·0002). (e) Bland–Altman plots of the difference in each participant between FFM in kg derived by the 2H2O dilution method and the BI-2(Reference Bocage4) method under study plotted against the average of the FFM in kg by the 2H2O method. The solid line and the dotted lines are the mean and 2 sd of the differences, respectively. Mean difference 2H2O − BI-2 = 0·47 (sd 0·57) kg (P < 0·0001). (f) Bland–Altman plots of the difference in each participant between FFM in kg derived by the 2H2O dilution method and the BI-3(Reference Kushner, Schoeller and Fjeld5) method under study plotted against the average of the FFM in kg by the 2H2O method. The solid line and the dotted lines are the mean and 2 sd of the differences, respectively. Mean difference 2H2O − BI-3 = 1·04 (sd 0·59) kg (P < 0·0001).
Similarly for FFMkg, the differences were plotted in Fig. 2(d)–(f); mean differences were 0·25, 0·47 and 1·04, respectively. In Fig. 3, individual data points for percentage FFM derived by the BIA equation of Fjeld et al. (Reference Fjeld, Freundt-Thurne and Schoeller3) and by the reference method are plotted against age in months. Age- and sex-specific reference data on percentage FFM in healthy American infants derived by multicomponent models(Reference Butte, Hopkinson and Wong15) are also plotted in Fig. 3 for comparison. As expected, the percentage FFM was consistently higher than the reference values for healthy infants from the USA.

Fig. 3 Individual data points for percentage fat-free mass (FFM) derived by the 2H2O dilution method (a) and the bioelectrical impedance analysis equation of Fjeld et al. (Reference Fjeld, Freundt-Thurne and Schoeller3) (b) are plotted against age in months. Age- and sex-specific reference values for percentage FFM in healthy American infants derived by multicomponent models (Butte et al. (Reference Butte, Hopkinson and Wong15)) are plotted for comparison (data points are connected). ( × ), Boys; (Δ), girls; (–○–), boys, Butte et al. (Reference Butte, Hopkinson and Wong15); (–□–), girls, Butte et al. (Reference Butte, Hopkinson and Wong15).
Discussion
Recent findings on the association of fetal growth, early postnatal growth and rate of growth in childhood(Reference Barker, Eriksson and Forsen17–Reference Lucas and Sampson20) with diseases in adults, such as hypertension, type 2 diabetes and CHD, have generated considerable new interest in studying postnatal growth and development. In South Asian countries, the rate of low birth weight is very high(Reference Black, Allen and Bhutta21), largely due to intra-uterine growth retardation. Further, the incidence of hypertension, type 2 diabetes and CHD is high among South Asians(Reference Yajnik, Lubree and Rege22). Population-based studies on growth and its components such as FFM in infancy should be useful in understanding these phenomena.
Impedance to the flow of current in body tissues is a function of resistance (R) and reactance. Cell membranes act as small capacitors and thus offer a reactive resistance (i.e. reactance) to the flow of current. Based on electrical theory, current at relatively higher frequencies passes through both extracellular and intracellular fluid and can provide an index of TBW. Thus the BIA method can distinguish between non-fat body mass (FFM) and fat mass(Reference Tang, Ridout and Modi23). Of the three BIA-based equations evaluated by us, the one by Fjeld et al. (Reference Fjeld, Freundt-Thurne and Schoeller3) was found to give a better prediction of TBW than either of the other two. The BIA equations of Fjeld et al. (Reference Fjeld, Freundt-Thurne and Schoeller3) were derived from thirty Peruvian undernourished children (height-for-weight z-score ranged from − 3 to+1 sd). Their method was similar to ours, except that they used 800 μA root mean square (RMS) current and we used 400 μA RMS current. As expected, the percentage FFM was consistently higher in the study infants (coming from low socio-economic group families) compared with those in the USA(Reference Sen, Mahalanabis and Shaikh6). This is so, by both the BIA methods and the reference method based on 2H2O dilution.
We, however, note that the difference between FFM derived by the better of the three equations, i.e. of Fjeld et al., and by the reference method is relatively large and equations with better precision are desirable. As stated earlier, the two anthropometry-based equations evaluated on these infants gave better agreement with the reference method than the BIA-based equations(Reference Sen, Mahalanabis and Shaikh6). FFM derived by the equation of Fjeld et al. (Reference Fjeld, Freundt-Thurne and Schoeller3) underestimates FFM by nearly 3 % and the difference is highly significant (Table 3). We have also plotted the mean reference values by age for healthy infants in the USA(Reference Butte, Hopkinson and Wong15). The latter values were derived by multi-component modelling. As expected, the percentage FFM values were consistently higher for the infants we studied. A question may be raised as to why we need a BIA-based equation where anthropometry-based equations were found to have good predictive ability in this population. The weight- or height-based indices (for example, BMI) or prediction equations cannot differentiate lean mass and fat mass(Reference Wells and Fewtrell24). There can be a twofold range of variation in fatness for a given BMI value in children(Reference Wells25). That these indices are predictive is due to the fact that the trajectory of growth of lean mass and fat mass usually go together. A problem arises when they take different trajectories. Such is the case for babies in South Asia who have a lower birth weight than their Western counterparts; recent studies have shown that their body fat is relatively preserved, leading to their description as a ‘thin–fat’ phenotype(Reference Yajnik, Lubree and Rege22, Reference Yajnik, Fall and Coyaji26), meaning that the fat mass and lean mass follow different trajectories of intra-uterine growth. Studies have also shown that this relatively low body mass with high body fat at birth tracks into childhood(Reference Krishnaveni, Hill and Veena27, Reference Bavdekar, Yajnik and Fall28). Further, adult populations in India have a higher percentage of body fat for a given BMI than Western population, suggesting that this thin–fat phenotype tracks into adulthood(Reference Dudeja, Misra and Pandey29, 30). Given the public health importance of this phenomenon, the BIA-based equations for lean mass measurement assume relevance. The value of BIA is largely as an epidemiological technique and, here, it is the only predictive technique that estimates lean mass(Reference Wells and Fewtrell24). Given that none of the published BIA-based prediction equations for children was found satisfactory we need to develop suitable equations to better predict lean mass in this population.
We used a stable-isotope dilution technique as the reference standard. Isotope-dilution methods use a two-component model to measure FFM and fat mass and are generally safe, reliable, accurate and feasible in infants and children. To derive FFM, one has to use age- and sex-specific hydration factors such as those derived by multicomponent models(Reference Butte, Hopkinson and Wong15). While the hydration of FFM changes with age and maturation, use of age- and sex-specific hydration factors minimises errors associated with maturation. The hydration factors for FFM proposed earlier for 1- to 5-year-old children give closely similar results(Reference Ziegler, O'Donnell and Nelson31, Reference Fomon, Haschke and Ziegler32). Measurement of TBW using 2H2O dilution methods has been used as a reference method in many of the classic studies of body composition in children(Reference Fomon, Haschke and Ziegler32–Reference Fomon and Nelson35).
As discussed earlier, valid equations based on BIA should assist in-depth studies to understand the early origin (i.e. fetal, neonatal and early childhood) of adult diseases of pubic health importance such as, diabetes, hypertension and CHD. Based on skinfold measurement, Yajnik et al. (Reference Yajnik, Fall and Coyaji26) have shown that Indian babies are not only small at birth but they also have less muscle mass and relatively more fat mass; the so called ‘thin–fat baby’ syndrome(Reference Yajnik, Lubree and Rege22, Reference Yajnik, Fall and Coyaji26). They further showed that thin–fat babies grow up to become thin–fat adults with thinner limbs and high waist:hip ratio; they appear to be fetally programmed and predisposed to diabetes. He also showed that the smallness and thinness of Indian babies is present at birth and an unusual thin–fat body composition is associated with the insulin resistance syndrome(Reference Yajnik19).
To conclude, the best of the three published BIA-based equations, i.e. by Fjeld et al. (Reference Fjeld, Freundt-Thurne and Schoeller3), gave an estimate of the mean FFM that was 2·98 (95 % CI 1·57, 4·40) % lower than that by the reference 2H2O method. Better equations for estimating FFM in South Asian infants are desirable. Development of new equations derived from population-specific data such as ours should be worthwhile.
Acknowledgements
This research received no specific grant from any funding agency in the public, commercial or not-for-profit sectors.
We thank Md. Jakir Hossain for statistical assistance.
B. S., a research fellow, carried out the study procedures, took part in the analysis and in writing the manuscript. D. M. conceived of the study design, experiment, 2H2O dilution test and statistical analysis, supervised B. S.'s work, took part in data analysis and interpretation and in writing the manuscript. S. S. assisted B. S. in standardisation of procedures for anthropometry and 2H2O dilution. S. S. also took part in study design, analysis and interpretation of the findings. A. V. K. carried out the 2H2O analysis in the laboratory, took part in the interpretation of the findings, and in critically reviewing the manuscript. K. B. took part in the study design, secondary supervision, interpretation and preparing the manuscript.
None of the authors has any conflict of interest to declare.