

10.1 Introduction
Phylogenetic trees are predominantly bifurcating tree diagrams that biologists use to represent evolutionary trajectories and patterns of shared ancestry. In the past two decades, phylogenetic trees have become more flashy, colourful and visually sophisticated compared with tree diagrams of the 1980s and 1990s. In addition to the basic structure of connected lines with taxa names, these filigreed trees contain other graphic and textual elements like images of animals or plants, coloured areas or lines and symbols. Several authors have discussed phylogenies from the perspectives of narrative science and historical explanation (e.g., Reference ClelandCleland 2011; Reference GriesemerGriesemer 1996; Reference O’HaraO’Hara 1988; Reference O’Hara1992). It has been argued that phylogenies are somewhat prior to evolutionary histories in the sense that they are more descriptive and therefore more objective or that they provide a scaffold for evolutionary histories. My chapter will show that, even if this is the case in some respects, phylogenetic trees are all the more interesting for it.
Robert Reference O’HaraO’Hara (1988), for example, claims that the relationship of phylogeny to evolutionary history is a relationship of chronicle to history.Footnote 1 According to him, a chronicle is a ‘description of a series of events, arranged in chronological order but not accompanied by any causal statements, explanations, or interpretations’ (Reference O’HaraO’Hara 1988: 144; emphasis original). Following Arthur Danto, he argues that histories, on the other hand, contain ‘a class of statements called narrative sentences’ (Reference O’HaraO’Hara 1988: 144; emphasis original). In addition to his view of phylogenies as chronicles, O’Hara advocates a scaffold viewFootnote 2 of phylogeny, meaning that he understands phylogenies as the basis for evolutionary histories. James Reference GriesemerGriesemer (1996) disagrees with O’Hara with respect to his view of phylogenies as interpretation-free chronicles. He argues that phylogenies are the result of several methodological decisions (e.g., the choice of phylogeny construction method, choice of outgroup) and claims that phylogenetic analysis ‘produces something more theoretically charged than chronicle’ (Reference GriesemerGriesemer 1996: 67). However, like O’Hara, Griesemer subscribes to the chronicle–history dichotomy and to the scaffold view of phylogeny and evolutionary history. He writes: ‘I agree that cladistic analysis aims at something prior to evolutionary narrative in the way that chronicle precedes history’ (Reference GriesemerGriesemer 1996: 67). Neither O’Hara nor Griesemer seems to believe that phylogenies do much, if any, explanatory work.
My discussion of a study conducted by Maria Nilsson and her collaborators (Reference Nilsson, Churakov, Sommer and Van Tran2010) shows that phylogenies and phylogenetic trees are much more interesting than interpretation-free chronicles. In fact, the phylogeny construction process requires several decisions (e.g., which taxa to include, which characters to use) that potentially affect the outcome of the analysis and is based on fundamental assumptions about molecular evolution. I show that the chronicle–history dichotomy is misleading in the case of phylogenetic trees and evolutionary histories because tree diagrams as the central and only comprehensive representation of phylogenies are read as evolutionary narratives, provided that the reader is familiar with the specialist conventions.Footnote 3 I argue that all phylogenetic trees, even plain ones, represent narrative explanations, and the informed reader can derive narrative sentences from them. My discussion of the filigreed marsupial tree constructed by Reference Nilsson, Churakov, Sommer and Van TranNilsson et al. (2010), and other examples of filigreed phylogenetic trees, shows that, by adding graphic and textual elements to the basic tree structure, narratives can extend beyond phylogenetic narratives of origin and divergence, including narratives of species migration and political and pedagogical narratives. I conclude that filigreed phylogenetic trees are used to represent integrated narratives, and so contain more epistemic features than have been recognized thus far.
10.2 Phylogenetic Analysis: Reconstructing the Past
As a historical science, evolutionary biology shares characteristics with other natural sciences, such as physics and chemistry, as well as other historical sciences, such as anthropology and archaeology (Reference Harrison and HeskethHarrison and Hesketh 2016; Reference Kaiser, Plenge, Kaiser, Scholz, Plenge and HüttemannKaiser and Plenge 2014; Reference Tucker, Kaiser, Scholz, Plenge and HüttemannTucker 2014). Just like human historians who study the origin and trajectory of events (e.g., wars, revolutions), evolutionary biologists are, among other things, concerned with accounting for unique, localized events that happened in the past – for example, the origin and evolutionary trajectory of species (see Beatty, Chapter 20; Reference CurrieCurrie 2014). Since the events of interest are not directly accessible or observable, both human historians and evolutionary biologists need to find other ways to gain knowledge of the past.
One way of reconstructing the past is to look for tracesFootnote 4 (Reference ClelandCleland 2002) or clues (Reference GardinerGardiner 1961: 74; Reference GinzburgGinzburg 1979) and infer past events from this evidence. This type of trace-based reasoning is frequently compared to detective work where the investigator tries to reconstruct the crime based on clues that they find at the crime scene (Reference ClelandCleland 2002: 490; Reference GinzburgGinzburg 1979: 276; see also Haines, Chapter 9). The investigation usually starts with the discovery of a puzzling phenomenon and the question of how, when or why it came to be as it is (Reference RothRoth 2017: 44). While historians visit archives to find records that can be used as clues, in molecular phylogenetics the traces are part of the organism itself, namely its genome which is seen as an archive containing the historical record of its lineage (Reference BromhamBromham 2016: 329). Since methods of phylogenetic analysis are comparative, scientists also need molecular data of closely related taxa to construct a phylogenetic tree. The main assumption is that the more similar the genomes of two populations are, the closer they are related to each other. If genomes of two populations are very similar to each other, researchers assume that they have diverged rather recently. In the following section, I will give a more detailed account of the different steps of a phylogenetic analysis by using Nilsson and her collaborators’ (Reference Nilsson, Churakov, Sommer and Van Tran2010) study as an exemplary case.
10.2.1 Constructing the Marsupial Tree
One of the first steps to construct any phylogenetic tree is to choose which organisms should be included in the analysis. In this case, Nilsson and her collaborators (Reference Nilsson, Churakov, Sommer and Van Tran2010) decided to include representative species of all seven marsupial orders. In total, the researchers ran their analysis with representative specimens of twenty species plus one outgroup (a reference species that is only distantly related with the group of interest). Another important step that needs to be made in the beginning of a phylogenetic analysis is the choice of characters, the traits or features of organisms taken to matter. While morphological characters are still used by some researchers, most phylogenetic trees that have been published in the last two decades are at least partially based on molecular characters (e.g., DNA or rRNA sequences). As phylogenetic markers, Reference Nilsson, Churakov, Sommer and Van TranNilsson et al. (2010) used retroposons, also called jumping genes, because these DNA fragments are transcribed into RNA, then ‘jump’ to a different place in the genome where they are inserted through reverse transcription. Once a retroposon has been inserted in the ancestral germline, it can become fixated in the ancestral population and is inherited by all descents. One can thus conclude that if a certain number of retroposons is present in two or more marsupial species, they are more closely related to each other than to species that do not share these retroposons. According to the researchers, retroposons exhibit low insertion site preferences, which makes it highly unlikely that the same retroposon was inserted twice in the same place in the genome of two different species (Reference Nilsson, Churakov, Sommer and Van TranNilsson et al. 2010). The scientists thus assume that when two marsupial species share a retroposon at a certain place in the genome, it was inherited from a common ancestor. On these grounds, they claim that ‘the shared presence of retroposed elements at identical orthologous genomic locations of different species, families, or orders is a virtually homoplasy-free indication of their relatedness’ (Reference Nilsson, Churakov, Sommer and Van TranNilsson et al. 2010).
The researchers used sequence data from databases but also received marsupial DNA samples from collaborators in Australia. The data were then used to preselect potential phylogenetically informative retroposon loci. Altogether, the group found 53 phylogenetically informative markers (Reference Nilsson, Churakov, Sommer and Van TranNilsson et al. 2010). These 53 characters were plotted in a presence–absence table, and analysed. Nilsson and her collaborators used parsimony analysis to find the most parsimonious tree (of all possible tree patterns, the tree diagram that minimizes the total number of character state changes is to be preferred). They used a program referred to as ‘PAUP* (Phylogenetic Analysis Using Parsimony *and other methods)’ to analyse the data and generate the tree topology. The procedure shows that phylogenetic analysis is a comparative approach, with similarity as the ordering principle. These similarities, however, were inherited from a common ancestor and can thus be used to reconstruct phylogenetic relationships.
10.2.2 Reading Tree Diagrams as Visual Narratives
If the researchers had decided to publish their results in a systematics journal that is devoted to phylogenetic theory and practice, they could have stopped here and published the plain tree diagram as a depiction of the phylogenetic narrative (Figure 10.1). But since the scientists published the article in PLoS Biology, they integrated the phylogenetic narrative with narratives from other fields to create an appealing story that is more likely to get published in journals with a broader thematic scope. To depict the integrated narrative, the researchers turned the plain tree that consists of connected horizontal lines and species names into an attractive image that contains additional visual elements (Figure 10.2). I use the labels basic structure or plain tree to refer to phylogenetic trees that only consist of connected lines and names of biological taxa, and filigreed tree to refer to tree diagrams that include the basic structure and additional visual and textual elements. While this is a type of scaffolding where the plain tree is used as the basis for the filigreed tree, I do not use the labels plain and filigreed to distinguish between chronicles and histories or to imply that phylogenies are prior to evolutionary histories. Instead, I argue that both plain and filigreed trees are read as narratives and depict evolutionary histories.
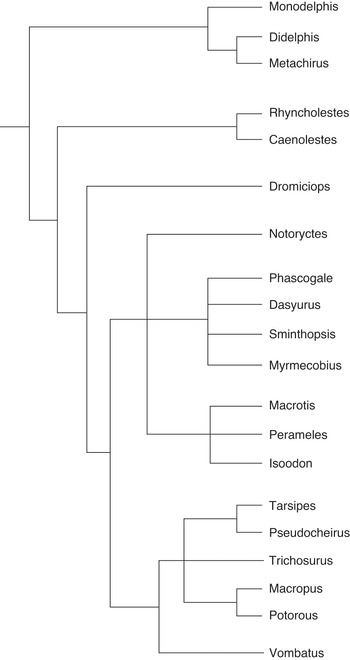
Figure 10.1 Plain marsupial tree
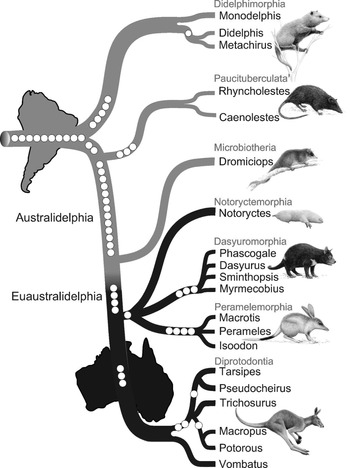
Figure 10.2 Filigreed marsupial tree
The original caption for Figure 10.2 is: ‘Phylogenetic tree of marsupials derived from retroposon data. The tree topology is based on a presence/absence retroposon matrix (Table 1 https://journals.plos.org/plosbiology/article/figure/image?download&size=original&id=info:doi/10.1371/journal.pbio.1000436.t001) implemented in a heuristic parsimony analysis (Figure S3 https://doi.org/10.1371/journal.pbio.1000436.s007). The names of the seven marsupial orders are shown in red, and the icons are representative of each of the orders: Didelphimorphia, Virginia opossum; Paucituberculata, shrew opossum; Microbiotheria, monito del monte; Notoryctemorphia, marsupial mole; Dasyuromorphia, Tasmanian devil; Peramelemorphia, bilby; Diprotodontia, kangaroo. Phylogenetically informative retroposon insertions are shown as circles. Gray lines denote South American species distribution, and black lines Australasian marsupials. The cohort Australidelphia is indicated as well as the new name proposed for the four ‘true’ Australasian orders (Euaustralidelphia)’ (Reference Nilsson, Churakov, Sommer and Van TranNilsson et al. 2010: 4).
The plain tree (Figure 10.1) is not part of the main paper by Reference Nilsson, Churakov, Sommer and Van TranNilsson et al. (2010) but can be found in the supplementary material. Given that phylogenetic trees are used within the framework of evolutionary science, the temporal aspect of these diagrams seems obvious. However, there are several misunderstandings about how to interpret the internal nodes, the relationship among taxa and the time axis (Reference GregoryGregory 2008). In the mid-twentieth century, most phylogenetic trees contained actual ancestors and depicted ancestor-descendant relationships (of extant or extinct species).Footnote 5 Today, however, phylogenetic analysis is focused on sister group relationships and it is assumed that contemporary species cannot be each other’s ancestors. Although the branching diagrams that do not contain any specified ancestors could be interpreted as cladograms that merely depict patterns of character distribution (Reference WileyWiley 1981: 98; Reference Eldredge and CracraftEldredge and Cracraft 1980: 10), most contemporary scientists who practise phylogenetic analysis understand the branching diagrams that they produce as phylogenetic trees, implying a process of change over time, and commonly refer to them as phylogenies. The internal and unnamed nodes of phylogenetic trees are interpreted as actual (but unknown) or hypothetical common ancestors. However, they also represent speciation events (the divergence of one cohesive population into two descendent populations), and/or the emergence of unique characters (Reference GregoryGregory 2008).Footnote 6 In any case, the internal nodes represent an event (speciation event) or species (extinct ancestor) that happened or existed at an earlier point in time. The tips of the branches represent the present and the rest of the tree represents the past. Regardless of the interpretation of the internal nodes, the connected lines of the tree diagram represent the pathways that eventually led to the currently existing species. In a phylogenetic tree that represents all living beings, one could trace all lines back to the so-called last universal common ancestor (LUCA). Since the root of the plain tree is on the left and the tips of the branches on the right, its timeline runs from left to right.Footnote 7
The basic structure of the marsupial tree (Figure 10.1) depicts the following phylogenetic narrative of origin and divergence that is similar for all phylogenetic trees: the marsupial clade originated, and over time the ancestral population underwent character changes. Then, the ancestral population diverged into separate populations that again underwent character changes. One of these populations eventually evolved into Didelphimorphia, with three extant species, and the other population underwent further speciation events. Further character changes and the next speciation event occurred and separated the population that eventually evolved into Paucituberculata, from the population that evolved into Microbiotheria and the Euaustralidelphian orders.Footnote 8
The filigreed tree (Figure 10.2) is the central element of the paper by Reference Nilsson, Churakov, Sommer and Van TranNilsson et al. (2010) and was created by Jürgen Schmitz, the project’s principal investigator. To create the filigreed tree, he added images of seven marsupials as representatives of each of the orders to the basic structure (e.g., the order Diprotodontia is represented by a kangaroo). The names of the marsupial orders were added in grey (red in the original figure); the phylogenetically informative retroposon insertions are shown as white dots and different shading was used for the South American and Australasian lineages. The grey lines represent South American and the black lines represent Australasian marsupial lineages, which is made clear by additional images of the continents South America and Australia. The names Australidelphia and Euastralidelphia were also added to the plain tree.Footnote 9
With the main narrative and target audience in mind, Schmitz first created the diagram and then constructed the text to provide more detailed information and explanation (Schmitz, personal communication, 11 April 2018). While the main function of the diagram is to depict a ‘narrative of nature’ (the evolution and spread of the marsupial clade), some visual elements have a dual function and also represent the researchers’ narrative of science (what the scientists did to get the results).Footnote 10 Representations of the retroposons, for example, show how many retroposons are shared by members of a clade but also tell the reader that retroposons were used as characters for the phylogenetic analysis. Some of the visual elements were added to make the diagram look more appealing and raise the readers’ interest. For this purpose, Schmitz hired a professional artist to draw pictures of marsupials. The main function of the additional elements, however, is to create an image that ‘speaks for itself’, meaning that the informed reader understands the central argument of the paper just by looking at the diagram (Schmitz, personal communication, 11 April 2018).Footnote 11
Schmitz created a diagram that emphasizes the most important findings of the analysis, namely that there is a clear divergence between Australasian and South American marsupials, that Microbiotheria is more closely related to South American marsupials than to Australasian marsupials and that the four Australasian orders share a single origin with Microbiotheria suggesting one single migration event from South America to Australia (Reference Nilsson, Churakov, Sommer and Van TranNilsson et al. 2010). Nilsson et al. take the finding that all Australasian marsupials share four retroposons that are not present in Dromiciops gliroides (the only extant species of Microbiotheria) as evidence that Microbiotheria is more closely related to South American marsupials than to Australasian marsupials. In the filigreed tree, these retroposons are represented as four white dots located at the transition area from grey to black. Schmitz emphasized the divergence between Australasian and South American marsupials by using grey lines for South American lineages and black lines for Australasian lineages. The analysis by Nilsson et al. suggests that the species Dromiciops gliroides, the only survivor of the order Microbiotheria, is not nested within the Australasian orders. Based on these findings, the researchers suggest nomenclatural changes and ‘propose the new name Euaustralidelphia (“true Australidelphia”) for the monophyletic grouping of the four Australasian orders Notoryctemorphia, Dasyuromorphia, Peramelemorphia and Diprotodontia’ (Reference Nilsson, Churakov, Sommer and Van TranNilsson et al. 2010: 4–5). The way the tree diagram was arranged horizontally instead of vertically, with South America to the left of Australia, visually represents the migration event from South America to Australia. Since the filigreed tree (Figure 10.2) represents both time and geographical information, it is read from top-left to bottom-right. Interestingly, the continents are represented in their current state as separate land masses, although the migration event supposedly occurred when South America, Antarctica and Australia were still connected by land bridges (Reference SchmitzSchmitz 2010).
By analysing the text of Reference Nilsson, Churakov, Sommer and Van TranNilsson et al. (2010), it becomes clear that the migration narrative is not only created on the basis of the phylogeny but through integration with narratives from other fields such as palaeontology and geology. The following excerpt illustrates that the group incorporated the fossil record and biogeographical evidence into the phylogenetic narrative.
The fossil Australian marsupial Djarthia murgonensis is the oldest, well-accepted member of Australidelphia. Thus, combined with the lack of old Australidelphian fossils from South America, the most parsimonious explanation of the biogeography of Australidelphia is of an Australian origin. However, the poor fossil record from South America, Antarctica, and Australia does not exclude that Djarthia, like Dromiciops, could be of South American origin and had a pan-Gondwanan distribution.
An integration of the phylogenetic narrative with narratives from other historical sciences like palaeontology and geology is facilitated by similar narrative conventions of a central subject (protagonist) that changes over time (Hopkins, Chapter 4; Huss, Chapter 3; see also section 10.3, below). The fact that researchers in other fields follow the same narrative conventions makes it easy to integrate heterogenous elements to form one coherent narrative. Broadening a narrative by integrating it with narratives from other fields is one way of creating a thicker scientific narrative (see Paskins, Chapter 13).
The integrated narrative that is represented by the filigreed marsupial tree can be phrased like this: the marsupial clade originated and over time the ancestral population underwent character changes. Then, the ancestral population diverged into separate populations that again underwent character changes. One of these populations eventually evolved into Didelphimorphia, with three extant species, and the other population underwent further speciation events. Further character changes and the next speciation event occurred and separated the population that eventually evolved into Paucituberculata from the other population, that again underwent character changes over time. Then the next speciation event occurred and one of the descendent populations eventually evolved into Microbiotheria. Members of the other descendent population migrated from South America to Australia, which constituted the origin of the superorder Euaustralidelphia.Footnote 13
While specialists can read these narratives directly off the diagrams, the untrained reader needs additional information to understand the trees’ narratives. To be sure, the filigreed tree’s caption provides information on how to interpret the added visual elements, but the authors assume that the reader understands the basic structure without further information. To be able to read the diagram as a narrative, the reader thus relies on background knowledge and needs to be familiar with the specialist conventions (see Andersen, Chapter 19; Merz 2011; Reference Vorms, Humphreys and ImbertVorms 2011). The resemblance of the basic structure of phylogenetic trees with human family pedigrees and the cultural practice of representing kinship and genealogy with tree images and branching diagrams might facilitate the understanding of phylogenetic trees as representations of shared ancestry (Reference GregoryGregory 2008; Reference HellströmHellström 2011; Reference RussellRussell 1979). However, there are common misunderstandings in the interpretation of phylogenetic trees that show how difficult it is for non-specialists properly to understand phylogenetic trees (Reference Meir, Perry, Herron and KingsolverMeir et al. 2007).Footnote 14
10.3 How Phylogenetic Trees Represent Narrative Explanations
So far, I have established that specialists read plain and filigreed phylogenetic trees as narratives. In this section, I argue that the informed reader can also derive narrative explanations from them. Or, from the perspective of the author, phylogenetic trees are used to represent narrative explanations.
Arguably, not every narrative is explanatory. However, when they offer solutions to puzzles, narratives qualify as explanations (Reference MorganMorgan 2017; Reference RothRoth 1989). As Mary Morgan puts it, ‘what narratives do above all else is create a productive order amongst materials with the purpose to answer why and how questions’ (Reference Morgan2017: 86). In the case of the phylogenetic analysis of marsupials, the material at hand (molecular sequences) was ordered in terms of similarity to answer the question of how the seven marsupial orders are related to each other (Reference Nilsson, Churakov, Sommer and Van TranNilsson et al. 2010). The phylogenetic tree of the marsupial clade represents an answer to this question. The scientists were particularly interested in the phylogenetic position of Microbiotheria. This relationship, however, is only one of the many evolutionary relationships that are represented in the tree diagram. In this sense, the diagram stands for itself because it is more detailed than the text and includes relationships that are not mentioned in the text. Thus, the visual narrative is more comprehensive than the written one that focuses only on the most disputed phylogenetic relationships.
In addition to being answers to puzzles, narrative explanations show ‘what happened at a particular time and place and in what particular circumstances’ (Reference GardinerGardiner 1961: 82). Thus, they are mostly concerned with token events – for example, a particular war or revolution – not with finding regularities of how wars or revolutions come about. They don’t merely explain an occurrence but show how things came to be as they are by referring to events that happened at an earlier point in time (Beatty, Chapter 20).Footnote 15 To be sure, the marsupial tree represents the origin and evolution of a particular clade and its exact branching pattern is probably unique to the marsupial clade. However, the tree diagram also represents type phenomena like speciation and emergence of traits. Moreover, it is ‘exemplary as a concrete problem solution that can be extended to give an explanation to similar phenomena elsewhere’ (Reference MorganMorgan 2017: 94). Phylogenetic trees not only represent explanations of the origin and evolution of biological taxa but are also used in other disciplines such as linguistics to represent the origin and diversification of languages (Reference Atkinson and GrayAtkinson and Gray 2005).
The events that are included in a narrative explanation are events that made a difference to the outcome (Reference BeattyBeatty 2016; Reference Beatty2017). In the temporal series, the outcome B is contingent upon at least one previous event A in the sense that B could not have happened if A had not happened in the past (Reference BeattyBeatty 2016). To be more precise, B is contingent upon the pathway that connects B with previous events (Reference DesjardinsDesjardins 2011). In the tree diagram, the difference-making events are represented as a temporal series of internal nodes (speciation events) and lines that connect the nodes (emergence of traits). The tree diagram by Reference Nilsson, Churakov, Sommer and Van TranNilsson et al. (2010) thus represents an explanation of how recent marsupial species came to be as they are by referring to speciation events and divergence that happened earlier in time. The existence of recent marsupial species is contingent upon the existence of their ancestors and the evolutionary pathway that eventually led to their occurrence. However, the tree diagram is rather thin on detail because it contains no exact information on ancestors or difference-making events such as speciation events (except for the migration event from South America to Australia) and loss or acquisition of traits.
Narrative explanations also include narrative sentences that ‘give descriptions of events under which the events could not have been witnessed, since they make essential reference to events later in time than the events they are about’ (Reference DantoDanto 1985: xii; see also Reference RothRoth 2017). An example is: ‘The Thirty Years War began in 1618’ (Reference DantoDanto 1985: xii). Thus, only in hindsight, when we know how the narrative ends, are we able to identify its beginning and unfolding (Reference MartinMartin 1986: 74). Narrative sentences can be derived directly from the tree diagram by Reference Nilsson, Churakov, Sommer and Van TranNilsson et al. (2010), and phylogenetic trees in general. For example, ‘Microbiotheria originated before Notoryctemorphia, Dasyuromorphia and Peramelemorphia’ or ‘The first divergence within the marsupial clade gave rise to Didelphimorphia’.
Narrative explanations are characterized as ‘connected account[s] of [an] entity’s development in time’ (Reference White and HookWhite 1963: 4), or, as Roth puts it (Reference Roth2017: 45), a narrative is ‘unified by showing the development of a subject over time’. These statements express a notion of coherence that is captured by the concept of central subject (Reference White and HookWhite 1963; Reference HullHull 1975; Reference Ereshefsky and TurnerEreshefsky and Turner 2020) and corresponds to the concept of protagonist in narratology (see Hajek, Chapter 2). The role of central subjects is ‘to form the main strand around which the historical narrative is woven’ (Reference HullHull 1975: 255). Examples for central subjects are Napoleon (Reference HullHull 1975: 262) and the Hawaiian Island archipelago (Reference Ereshefsky and TurnerEreshefsky and Turner 2020). The central subject in Reference Nilsson, Churakov, Sommer and Van TranNilsson et al.’s (2010) narrative is the marsupial clade because this entity forms the main strand of the evolutionary narrative. The migration event from South America to Australia is singled out as a particularly important event in the life of the clade because it led to the formation of a new superorder.
To be sure, the scientists present their explanation of the origin and evolution of marsupial orders in the text of the research paper; however, narrative explanations are also represented by phylogenetic trees in a more immediate manner. I have shown that they represent answers to a puzzle, temporal series with difference-making events, token phenomena, and revolve around a central subject. I have also argued that an informed reader can derive narrative sentences directly from the diagram. The basic structure depicts all elements of a narrative explanation discussed in this section and thus already represents a narrative explanation (phylogenetic narrative). The filigreed tree with additional elements (e.g., images of continents), however, represents a broader narrative explanation about migration. In the following section, I discuss examples that show further ways of modifying phylogenetic trees to represent narrative explanations.
10.4 Use of Phylogenetic Trees in Different Contexts
The use of phylogenetic trees extends beyond biological systematics. In this section I will give two examples of the use of phylogenetic trees in other fields to show their functions in different contexts. Like the marsupial tree (Figure 10.2), the diagrams discussed here are filigreed trees that include different types of additional textual and graphic elements. These examples illustrate two things. First, phylogenetic narratives are not always represented in the same form. Even though the diagrams discussed in this section are based on a branching structure, they are arranged and read in different ways, particularly with respect to the time axis. Second, filigreed trees are modified to represent narratives that extend beyond evolutionary histories or common ancestry and differ in terms of narrative content.
10.4.1 Phylogenetic Trees in Museums
Phylogenetic trees can be found in many museums, science centres, zoos, aquariums and botanical gardens. The phylogenetic tree entitled ‘vertebrate diversity’ (Figure 10.3) is part of a permanent exhibit at the University of Kansas Natural History Museum. The diagram contains a vertical tree diagram (root at the bottom), with schematic images of species at the eight tips (extant and extinct species represented by different shades).Footnote 16 The tips represent fishes, birds plus reptiles (in one group), mammals and amphibians. Unlike phylogenetic trees in scientific papers, this tree diagram includes an arrow indicating temporal directionality from bottom to top. The top of the diagram shows an extended mammal branch with seventeen tips. The tree designers included both common and scientific names of species. In addition to the legend with the two colours that represent living and extinct species, the diagram also contains a short explanatory text.

One of the functions of Figure 10.3 is to communicate scientific research to a broad audience. The tree diagram depicts phylogenetic relationships in accordance with scientific findings, and the explanation, that the branching pattern represents evolutionary relationships, enables people who are completely unfamiliar with phylogenetic trees to get a basic understanding of the diagram. The explanatory text states that some of the phylogenetic relationships are unresolved: ‘When three or more lineages come from the same point, this indicates that scientists are uncertain about which of those lineages are more closely related’ (Figure 10.3). This either means that scientists disagree about the respective phylogenetic relationships or that phylogenetic analyses produced inconclusive results. The authors also mention that new evidence can lead to revisions of phylogenetic relationships (Figure 10.3, bottom). These additional remarks help the audience understand what the diagram represents, but also informs about the character of scientific research and its results. The schematic images of vertebrates can easily be understood by a broad audience including young children. Another important function of the vertebrate tree is to teach ‘phylogenetic literacy’ (Reference GregoryGregory 2008) to a broad audience. Studies have shown that there are misconceptions about the representation of time in phylogenetic trees (Reference GregoryGregory 2008; Reference Meir, Perry, Herron and KingsolverMeir et al. 2007; Reference Omland, Cook and CrispOmland, Cook and Crisp 2008). Instead of reading the time axis from the root of the tree to the tips, many students believe that the location of the tips is a representation of temporality and read time from left to right, assuming older species are on the left and younger species on the right (Reference GregoryGregory 2008: 134; Reference Meir, Perry, Herron and KingsolverMeir et al. 2007: 72). To avoid misinterpretations, the authors of the vertebrate tree thus added an arrow labelled ‘time’ that indicates the time axis from bottom to top.
Another function of phylogenetic trees in museums is ‘to make links between specific exhibits and the broader tree of life’ (Reference MacDonaldMacDonald 2014). When scientists refer to the tree of life, they usually mean a phylogeny of all living beings, but also the concepts of common ancestry and biodiversity (Reference MacDonald and WileyMacDonald and Wiley 2012: 14). The bottom part of the vertebrate tree does not contain any details like species names because its main function is to show that all vertebrates are related to each other. The schematic images of different vertebrates depict the diversity within this group. Like many other phylogenetic trees in museums, the extended mammal branch of the vertebrate tree also includes humans. In contrast to other phylogenetic trees in museums or zoos, however, the human branch is not emphasized in any way and does not have a central position (see Reference MacDonald and WileyMacDonald and Wiley 2012 for examples). This way of representing humans in a phylogenetic tree allows visitors to see who our closest relatives are and at the same time communicates that humans are one species among many with no special position on the tree of life. In general, the arrangement of the branches might help to correct the common misconception of ‘ladder thinking’ with higher and lower species (Reference GregoryGregory 2008: 127–128; Reference Kummer, Clinton and JensenKummer, Clinton and Jensen 2016: 393; Reference O’HaraO’Hara 1992).
Compared to the marsupial trees (section 10.2), the vertebrate tree shows an alternative way of representing phylogenetic narratives. The trees differ with respect to the direction of time and the taxonomic level of the central subject. The marsupial trees are arranged horizontally, with the root on the left, but the vertebrate tree’s branching structure is arranged vertically, with the root at the bottom. Thus, time on the vertebrate tree is not read from (top-)left to (bottom-)right, but from bottom to top. While the marsupial trees show the evolutionary history of marsupial orders, the vertebrate tree represents the evolutionary history of four groups of vertebrates and a more fine-grained evolutionary history of mammals. This shows that phylogenetic narratives can be developed on different taxonomic levels. The trees also differ with respect to narrative content. The filigreed marsupial tree emphasizes an important turning point in the evolutionary history of the marsupial cade (migration event), but the vertebrate tree’s narrative was developed to include a narrative of connectedness thorough common ancestry. Thus, the vertebrate tree is read both as a narrative of evolutionary history (emphasis on time) and as an ancestor narrative (emphasis on shared ancestry). Elements of self-reference in the diagram (arrow, explanatory text) enable readers to interpret and understand not only this particular phylogenetic tree but phylogenetic trees in general.
10.4.2 Phylogenetic Trees in Animal Rights Debates
In a flyer entitled ‘Brother Chimp, Sister Bonobo: Rights for Great Apes!’ published by the Giordano Bruno Foundation, the authors included a phylogenetic tree of great apes (Giordano Bruno Foundation 2011: 5; Figure 10.4). In contrast to most phylogenetic trees in scientific papers the tree in the flyer contains information on taxonomic ranks (e.g., superfamily, family, genus/species) at the nodes. The prevailing phylogenetic classification identifies chimpanzees (Pan troglodytes) and bonobos (Pan paniscus) as the closest extant relatives of humans (Homo sapiens), with chimpanzees and bonobos as members of the genus Pan and humans as members of the genus Homo. Given the close phylogenetic relatedness of humans, chimpanzees and bonobos, the authors argue that the latter two should be placed into the genus Homo and renamed Homo troglodytes and Homo paniscus, respectively (Giordano Bruno Foundation 2011: 4–5). Interestingly, this demand is already implemented in their great ape tree. The ultimate demand of the Giordano Bruno Foundation, however, is not the renaming of chimpanzees and bonobos, but the recognition of fundamental rights for great apes (Giordano Bruno Foundation 2011: 6). According to the authors their updated classification ‘would not only be scientifically consistent, it would also have psychological knock-on effects – as it would deflate our exaggerated sense of importance and motivate us to grant our closest relatives the respect they deserve’ (Giordano Bruno Foundation 2011: 5).
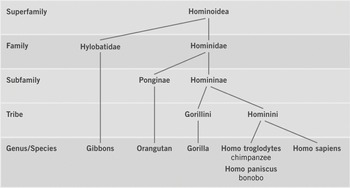
Figure 10.4 Great ape tree
Like the vertebrate tree (section 10.4.1), the great ape tree is arranged vertically, but with the root at the top. Similar to the marsupial trees (section 10.2), the vertebrate tree is also a phylogeny of a mammalian clade, but it is not used to represent a narrative of the origin and evolution of great apes. Instead, the great ape tree is read as a narrative of common ancestry of humans, chimpanzees and bonobos. Thus, the emphasis of the great ape narrative is not on the temporal aspect of evolution but on the genealogyFootnote 17 of great apes. Like phylogenetic trees in scientific papers, the great ape tree does not include ancestors, but the placement of taxonomic ranks at the nodes makes the diagram look more like a human family pedigree that includes ancestor names at the nodes. The narrative of common ancestry of humans, chimpanzees and bonobos is also expressed in the title of the flyer that refers to chimpanzees and bonobos as our brothers and sisters, implying that we share the same ‘parents’. The authors also refer to common ancestry when they argue that humans, chimpanzees and bonobos should be placed in the same genus: ‘Today it is an undisputed fact that humans are the closest living relatives of chimpanzees and bonobos. The genome of these three species differs only by a fraction – between 6.4 per cent and 0.6 per cent, depending on the methods of measurement. Some scientists would therefore like to unite them in a single genus, Homo’ (Giordano Bruno Foundation 2011: 5).
The phylogenetic tree represents the scientifically recognized phylogenetic relationships (chimpanzees and bonobos as the sister species of humans) but not the prevailing scientific nomenclature. The renaming of chimpanzees and bonobos places them in the same genus as humans (Homo), thereby distorting the prevailing scientific classification that places chimpanzees and bonobos in the genus Pan. The tree diagram represents an explanation of why chimpanzees and bonobos should be renamed (Giordano Bruno Foundation 2011: 4–5). However, the main purpose of including the great ape tree in the flyer is not to represent scientific findings, but first and foremost to represent a political narrative that explains why fundamental human rights (e.g., the right to life, the right to individual liberty) should be extended to other great apes. The example of the great ape tree thus shows how political and scientific narratives are woven together and represented in a visual representation. To be sure, the common ancestry of humans, chimpanzees and bonobos is only part of the narrative that explains why the ‘community of equals’ should be extended beyond humans,Footnote 18 but the flyer discussed here focuses on this particular aspect of the argument (Giordano Bruno Foundation 2011: 6).
10.5 Filigreed Trees and Integrated Narratives
The construction process of the marsupial tree clearly shows that phylogenies are not descriptive chronicles. In fact, there are many decisions that potentially affect the outcome of the analysis such as the choice of characters, species, outgroup and method of data analysis. There are also fundamental assumptions about molecular evolution (e.g., retroposon insertions) that form the basis of phylogenetic analysis and the interpretation of the tree diagram. I have argued that a specialist audience reads phylogenetic trees, even plain ones, as evolutionary histories and that all phylogenetic trees represent narrative explanations. The scaffold view of phylogeny and evolutionary history as advocated by O’Hara and Griesemer is thus misleading because it implies that phylogeny is something prior to or separate from evolutionary histories. It is true that plain trees are scaffolds for more filigreed versions of trees, but not in the sense that filigreed trees depict evolutionary histories while plain trees depict something prior to evolutionary histories. I have shown that the filigreed marsupial tree is read as a narrative that includes geographical aspects of the evolution of the marsupial clade, namely the divergence of South American and Australasian marsupials after a migration event. It is thus used to represent a coherent narrative that resulted from integration of a phylogenetic narrative with narratives from geology and palaeontology. The examples of the use of filigreed trees outside of academic evolutionary biology show that they are also used to represent narratives that extend beyond evolutionary histories of clades. These narratives are formed through integration of an ancestor narrative with political demands or integration of a phylogenetic narrative with a pedagogical narrative. All diagrams discussed in this chapter contain the basic branching structure of a phylogenetic tree but differ in narrative content and reading of the diagrams.Footnote 19


 Open access