


INTRODUCTION
The southwest Asian summer monsoon is one of the most powerful climatic phenomena on Earth. It is fundamental to controlling environmental conditions in South Asia. Erosion patterns in the Himalaya and the Indus River flood plains are largely influenced by variations in monsoon strength (Bookhagen et al., Reference Bookhagen, Thiede and Strecker2005; Clift and Giosan, Reference Clift and Giosan2014; Giosan et al., Reference Giosan, Clift, Macklin, Fuller, Constantinescu, Durcan and Stevens2012; Jonell et al., Reference Jonell, Carter, Böning, Pahnke and Clift2017a). Marine sediments supplied from rivers are often used to reconstruct continental erosion and the environmental evolution of the onshore drainage basins. However, the use of deep-sea deposits for such reconstructions is predicated on the assumption that marine sediments deposited at any given time are representative of the conditions of the onshore drainage basins from which they are sourced at that time. Debate continues regarding the degree to which storage and recycling of sediment in alluvial flood plains may homogenize or blend short-term variations (103–105 yr) in river sediment compositions (Castelltort and Van Den Driessche, Reference Castelltort and Van Den Driessche2003; Jerolmack and Paola, Reference Jerolmack and Paola2010; Métivier and Gaudemer, Reference Métivier and Gaudemer1999). Volume calculations indicate that around half of all sediment reaching the Indus River mouth during the Holocene may be reworked from older terrace and floodplain sediments (Clift and Giosan, Reference Clift and Giosan2014), although this still includes significant flux from newly eroded sources. Notable changes in detrital mica Ar-Ar and zircon U-Pb age populations on millennial times scales are seen in the Indus Delta since ~15 ka, apparently linked to changes in erosion controlled by monsoon strength (Clift et al., Reference Clift, Giosan, Blusztajn, Campbell, Allen, Pringle and Tabrez2008). This implies that, in a river with powerful erosional signals like the Indus, buffering processes are capable of being overwhelmed by a strong erosional signal. Different grainsize fractions may also behave differently. Dense, sandy sediments may be ponded close to the river mouth (Sweet and Blum, Reference Sweet and Blum2016) and travel more slowly as bed load prior to sedimentation in that region. Conversely, fine-grained, suspended sediments might be expected to travel more quickly from source to sink and be more readily transported far offshore. Clay mineral assemblages from the Indus Delta show that a basin-wide weathering response to climate change during the Holocene is preserved at the river mouth (Alizai et al., Reference Alizai, Hillier, Clift and Giosan2012), consistent with such a model. However, it still remains unclear whether such variations preserved in the delta are propagated into the deep-sea.
Most sediment reaching the final depocenter of the submarine fan passes through the submarine canyon cutting the continental shelf, which may affect the net sediment flux to deeper water through further potential buffering (i.e., short-term storage and recycling; Métivier and Gaudemer, Reference Métivier and Gaudemer1999; (Jerolmack and Paola, Reference Jerolmack and Paola2010; Métivier and Gaudemer, Reference Métivier and Gaudemer1999). Determining how sediment is fluxed through the canyon is important if deep-water sediments are to be used as archives of continental erosion and environmental evolution. Similarities between deep-water submarine fan sediments and the river mouth in the Mississippi have been used to infer a direct connection between the two and thus a relative lack of long-term recycling in that submarine canyon (Fildani et al., Reference Fildani, McKay, Stockli, Clark, Dykstra, Stockli and Hessler2016), but whether that is a common feature of submarine canyons is not clear, especially in places where the distance between river mouth and canyon is significant.
Recent studies of sediments in the Indus Submarine Canyon have shown that fine-grained Holocene sediments have essentially the same Nd isotope compositions as sediments stored at the river mouth since at least 8 ka (Li et al., Reference Li, Clift, Böning, Blusztajn, Murray, Ireland and Pahnke2018). This implies that, even if the canyon is buffered relative to the river mouth (i.e. sediment is stored and recycled in between), this effect lasts no more than 8 ka and is potentially much shorter, at least for finer-grained material in the Quaternary Indus Canyon. However, the U-Pb ages of coarse silt-sand zircon grains in the submarine canyon are resolvably different from those at the river mouth during the Holocene, implying a disconnection between the river mouth and the canyon at least until 6.6 ka for coarser sediments (Li et al., Reference Li, Clift and O'Sullivan2019). Sand and silt appear to have been stored near the river mouth as sea level rose, while finer-grained sediment was directly transferred into deeper water.
Clay mineral assemblages in marine sediments can record changes in onshore chemical weathering and environmental conditions in response to the evolving climate, especially the southwest Asian summer monsoon. Coevolution of clay mineralogy and monsoon strength has been documented elsewhere in Asia. For example, clay mineral records in the South China Sea correlate with East Asian Monsoon intensity over time scales of >106 yr (Wan et al., Reference Wan, Li, Clift and Stuut2007). Millennial-scale variations in clay mineralogy also correspond well with climatic proxies in sediments from other Asian continental margins (Colin et al., Reference Colin, Turpin, Bertaux, Desprairies and Kissel1999, Reference Colin, Siani, Sicre and Liu2010; Liu et al., Reference Liu, Clift, Murray, Blusztajn, Ireland, Wan and Ding2017). In the Arabian Sea, variations in clay mineral assemblages have been linked to changes in climatically modulated dust fluxes from Arabia, India, and Pakistan, along with changes in the input by major fluvial systems (Fagel, Reference Fagel, Hillaire-Marcel and Vernal2007; Sirocko and Lange, Reference Sirocko and Lange1991).
Existing reconstructions of monsoon climate variations since the last glacial maximum (LGM, ~20 ka; Fleitmann et al., Reference Fleitmann, Burns, Mudelsee, Neff, Kramers, Mangini and Matter2003; Wünnemann et al., Reference Wünnemann2010) make the Indus an ideal system for addressing the processes of sediment transport and their links with climate change. Chemical weathering is expected to speed up under wetter and hotter conditions (West et al., Reference West, Galy and Bickle2005). In this study, we use clay mineral assemblages, K/Al ratios, and the chemical index of alteration (CIA) as chemical weathering proxies, combined with the environmentally sensitive hematite/goethite ratio to constrain fine-grained sediment transport within the Indus Submarine Canyon and clinoform development on the shelf east of the Indus Canyon (Fig. 1). We compare them with matching data from the Indus Delta, floodplains (Alizai et al., Reference Alizai, Hillier, Clift and Giosan2012), and the western clinoform (Limmer et al., Reference Limmer, Köhler, Hillier, Moreton, Tabrez and Clift2012b). We further evaluate whether there is any linkage between marine sedimentary records and onshore climate change. The cores in this study were collected along the axis of the canyon from its head to the lower canyon, adjacent to where it incises the shelf edge, and also from the western and eastern clinoforms that flank the canyon (Fig. 1B and C).

Figure 1. (A) Satellite image of the Indus drainage basin, showing the main tributaries and the ranges from which sediment is derived and transported into the Arabian Sea. Image is from Google Earth. (B) Shaded bathymetric map of the northern Arabian Sea, showing the location of the Indus Canyon relative to other geographic features. Bathymetry is in meters below sea level. Dashed lines indicate top of clinoform foresets. WC, western clinoform; EC, eastern clinoform; KC, Kutch Clinoform. (C) Close-up of the Indus Canyon, showing the locations of the cores collected in the 2008–2009 RV Pelagia cruise. Map data plotted by GeoMapApp (www.geomapapp.org).
GEOLOGICAL AND DEPOSITIONAL SETTING
The Indus River drains the Western Himalaya, Karakoram, and associated ranges (Fig. 1A) and has likely been supplying sediment to the Arabian Sea since ~45 Ma (Clift et al., Reference Clift, Shimizu, Layne, Blusztajn, Gaedicke, Schüter and Clark2001). More than 11 km of sediment have been deposited under the shelf since that time. As the world's second largest submarine fan, the Indus extends ~1800 km from the shelf edge onto the abyssal plain, being bounded to the south by the Carlsberg Ridge, and to the west by the Owen and Murray Ridges (Kolla and Coumes, Reference Kolla and Coumes1987). The modern submarine canyon cuts the continental shelf into two sections, with a small clinoform on the western side and a much larger one developed on the eastern side (Giosan et al., Reference Giosan2006). The Indus Basin is suitable for examining the impact of climate change on sediment transport and chemical weathering because it is influenced by the southwest Asian summer monsoon and at the same time experiences fast rates of sediment supply. Well-established proxy records dating from the LGM provide a robust climate history. Correlating these with clay minerals, geochemical proxies, and the humidity-related hematite/goethite proxy allows us to understand the environmental response in marine sediments to climate change.
SEDIMENT TRANSPORT AND BUFFERING
Sediment transport can completely destroy (“shred”) environmental signals from the sediment supplied by the Himalayan sources, as a result of temporary storage and recycling, especially in long alluvial plains (continental scale, 100–1000 km long; (Jerolmack and Paola, Reference Jerolmack and Paola2010; Romans et al., Reference Romans, Castelltort, Covault, Fildani and Walsh2016). The lengthy flood plains (>1000 km) of the Indus basin (Fig. 1A) provide ample opportunities for sediment buffering. Furthermore, sediment storage in mountain terraces is well-documented (Blöthe et al., Reference Blöthe, Munack, Korup, Fülling, Garzanti, Resentini and Kubik2014; Jonell et al., Reference Jonell, Owen, Carter, Schwenniger and Clift2017c; Munack et al., Reference Munack, Blothe, Fülop, Codilean, Fink and Korup2016). A high fraction of Holocene sediment supply may be derived from reworking of these mountain terraces (Clift and Giosan, Reference Clift and Giosan2014), as well as large-scale incision of the northern half of the flood plains (Giosan et al., Reference Giosan, Clift, Macklin, Fuller, Constantinescu, Durcan and Stevens2012). In addition, the Indus River recycles sediment from the neighboring Thar Desert (Fig. 1A), which itself is supplied by eolian sediment from the delta, especially during interglacial times when the summer monsoon winds are powerful (East et al., Reference East, Clift, Carter, Alizai and VanLaningham2015). Further recycling has occurred on the western continental shelf, spanning millennial timescales and resulting in loss of coherent changes in sediment composition (Limmer et al., Reference Limmer, Boening, Giosan, Ponton, Köhler, Cooper and Tabrez2012a). Although the Nd isotope evidence indicates <8 ka of buffering of fine-grained sediment in the canyon, this method is unable to resolve the degree of coupling between river and canyon further. Here we employ clay mineralogy to look for detailed variations within the fine sediment flux to understand how this material is transported into deep water.
A high-resolution sediment record spanning ~95 yr has been established by coring in the Indus Canyon head (site Indus-21; Fig. 1C; (Li et al., Reference Li, Clift, Böning, Blusztajn, Murray, Ireland and Pahnke2018). This record lacks sandy sediments in the upper 5 m, which Clift et al. (Reference Clift, Giosan, Henstock and Tabrez2014) interpreted to reflect reduced sand transport to the river mouth following twentieth-century damming of the upstream Indus. This implies a direct connection between river and canyon (i.e., an unshredded signal), at least in the uppermost canyon, in the recent past because changing flux from the river is mirrored by changing sedimentation in the canyon. Slumping and reworking of sediment by super-critical turbidity currents in the upper canyon, however, may prevent fluvial signals from being propagated further offshore in a coherent form (Clift et al., Reference Clift, Giosan, Henstock and Tabrez2014).
METHODS
Piston cores were taken within and adjacent to the canyon in 2008–2009 (Table 1, Fig. 1B and C), together with swath bathymetry and shallow-penetrating, high-resolution, seismic reflection profiles during cruise 64PE300 of RV Pelagia (Clift et al., Reference Clift, Giosan, Henstock and Tabrez2014). We sampled selected cores along the canyon axis for accelerator mass spectrometry (AMS) radiocarbon dating, X-ray diffraction (XRD), major element geochemical analysis, and diffuse reflectance spectrophotometry (DRS). We sampled both the canyon thalweg (Indus-21, -25, -26, and -27) and raised terraces (Indus-29, -30, and -31), as well as an abandoned cutoff meander (Indus-28, previously dated as mid-Holocene; (Clift et al., Reference Clift, Giosan, Henstock and Tabrez2014)), to provide a relatively continuous record of sedimentation during sea-level rise and the subsequent high stand. We also took samples from Indus-5 in the eastern clinoform to better constrain the sediment supply to that area, corresponding to the records already generated from the western clinoform (Limmer et al., Reference Limmer, Köhler, Hillier, Moreton, Tabrez and Clift2012b). Canyon cores span water depths from ~300 to ~1300 m (Table 1).
Table 1. Location and water depth information for all core sites mentioned in this study.

Chronology by AMS radiocarbon dating
Radiocarbon dating was used to define when sedimentation was active at different water depths, supplementing dates generated using the same method by earlier studies. New age constraints for Indus-29 and -30 are generated from picked foraminifera, specifically Globigerinoides spp., from these two cores. 14C dating was completed at the National Ocean Sciences AMS facility (NOSAMS, Woods Hole Oceanographic Institution, USA) using their standard methodology, as presented in McNichol et al. (Reference McNichol, Gagnon, Osborne, Hutton, VonReden and Schneider1995). Raw data were calibrated to calendar BP ages (2-sigma uncertainty) using Calib 7.0.4 software (Stuiver and Reimer, Reference Stuiver and Reimer1993) and the dataset Marine 13 of Reimer et al. (Reference Reimer, Bard, Bayliss, Beck, Blackwell, Ramsey and Buck2013). These new radiocarbon dates and their calibrated equivalents, together with the sample location within the core and locations of the boreholes, are presented in Table 2. Other age controls used in this study were derived from Clift et al. (Reference Clift, Giosan, Henstock and Tabrez2014) for Indus-5, -21, -26, -28, and -31, which have been recalibrated in this paper, and from Li et al. (Reference Li, Clift, Böning, Blusztajn, Murray, Ireland and Pahnke2018) for Indus-25, -27, -29, and -30.
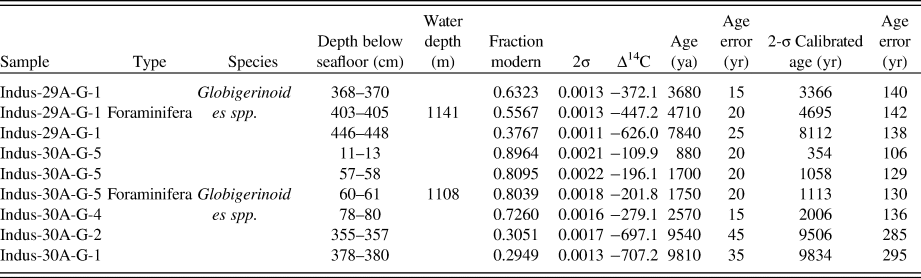
Table 2. New 14C accelerator mass spectrometry (AMS) ages for Indus-29 and -30, showing the measured and calibrated ages used to constrain depositional ages of the sediments.
Clay mineralogy
Clay mineral formation is in part a direct response to environmental conditions (Thiry, Reference Thiry2000). Illite and chlorite are the products of physical weathering of low-grade metamorphic and plutonic rocks with little chemical weathering. Kaolinite is frequently abundant in warm and wet tropical areas with high degrees of chemical weathering. Smectite is another product of chemical weathering, produced under the influence of a seasonal climate and is often, but not always, associated with alteration of volcanic rocks (Chamley, Reference Chamley1989). Therefore, relative mineral abundances and various mineral ratios can serve as weathering proxies.
All clay samples were prepared and analyzed by a Panalytical Empyrean XRD at Louisiana State University. Core samples were first soaked in water and 0.01 wt% Na3PO4 solution overnight until there was no flocculation. Samples were rinsed with deionized water to remove soluble salts and aid dispersion. The clay-sized materials were then syphoned from the sample liquid. The extracted fraction was then centrifuged in a Thermo Sorvall Legend XT Centrifuge at 12,500 rpm setting for 35 minutes to concentrate the < 2 µm clay-sized materials. Smear slides were made from the concentrated fraction of each sample and analyzed with the XRD after four different treatments: air-dried, glycolated, heated to 300°C and 550°C (after Biscaye (Reference Biscaye1965)). Slides were first analyzed in air-dried condition and then placed in an ethylene glycol desiccator overnight at 25°C to be reanalyzed. The third and fourth XRD patterns were collected after the slides were placed in a muffle furnace at 300 and 550°C for one hour, respectively.
In this study, we use the semiquantitative method of Biscaye (Reference Biscaye1965) to estimate the clay assemblage, which is based on peak-intensity factors determined from calculated XRD patterns, as measured by MACDIFF software. The uncertainty of XRD peak area after repeated measurements is typically ±5% at the 95% confidence level, with the smaller peaks having the highest uncertainties. Illite crystallinity, calculated from full width at half maximum height (FWHM) of the XRD illite 10 Å peak, is also used here as an index of chemical weathering (Chamley, Reference Chamley1989). The FWHM used in the calculation is the average of the four measured FWHMs under the different conditions explained above. The illite crystallinity is interpreted to reflect the hydrolyzing power of the soil from which the mineral was derived (Lamy et al., Reference Lamy, Hebbeln and Wefer1998). Higher temperatures and more rainfall lead to stronger hydrolyzation, more chemical weathering, wider XRD peaks, and higher values of illite crystallinity. As a result, illite crystallinity can be a good proxy for assessing whether monsoon intensity affects chemical weathering over time scales of thousands of years (Liu et al., Reference Liu, Colin, Huang, Le, Tong, Chen and Trentesaux2007), and whether those signals can be seen in the submarine canyon. Clay mineral XRD results are reported in Supplementary Table 1.
Major element chemistry
The major element chemistry, expressed through proxies like K/Al ratios and CIA, of siliciclastic sediments is effective for examining the state of chemical alteration and can be used for reconstructing environmental conditions (Hu et al., Reference Hu, Clift, Wan, Böning, Hannigan, Hillier, Blusztajn, Clift, Harff, Wu and Qiu2016; Nesbitt and Young, Reference Nesbitt and Young1982). Al is a relatively immobile element compared to K, which is preferentially removed from minerals during chemical weathering, so that K/Al decreases with increasing intensity of chemical alteration (Lupker et al., Reference Lupker, France-Lanord, Galy, Lave, Gaillardet, Gajured and Guilmette2012; Nesbitt et al., Reference Nesbitt, Markovics and Price1980). CIA is a proxy for chemical weathering intensity based on the molar ratio of relatively immobile Al compared to K, Na, and Ca, which are preferentially removed from minerals during chemical weathering (Nesbitt et al., Reference Nesbitt, Markovics and Price1980). CIA is calculated from the following equation.
 $${\rm CIA} = \left[ {\displaystyle{{Al_2O_3} \over {Al_2O_3 + Na_2O + K_2O + CaO^{^\ast}}}} \right]{^\ast}100$$
Unweathered granites have CIA values of 50, while values of 100 indicate complete loss of K, Na, and Ca. Ca here only relates to silicate Ca, not that in carbonates. We adopt the method of Singh et al. (Reference Singh, Sarin and France-Lanord2005) in correcting for excess Ca that remained even after decarbonation: when molar CaO is greater than Na2O, CaO* was assumed to be equivalent to Na2O. Because Ca is typically lost more rapidly than Na during weathering, this approach gives minimum CIA values (Singh et al., Reference Singh, Sarin and France-Lanord2005).
Bulk sediment samples taken exclusively from layers in the core interpreted by Li et al. (Reference Li, Clift, Böning, Blusztajn, Murray, Ireland and Pahnke2018) as being hemipelagic rather than the minor, sand-silt-graded turbidite layers. These samples were analyzed for their major element contents by inductively coupled plasma emission spectrometry (ICP-ES) at Boston University (BU) and the Institute for Chemistry and Biology of the Marine Environment (ICBM), University of Oldenburg. BU sediment samples were decarbonated with acetic acid, washed with distilled and deionized water with a purity of 9–12 MΩ, and hand-powdered at LSU before total fusion preparation at BU and ICBM. Glass beads for each sample were made in a muffle furnace under 1050°C by fusing 100 ± 0.5 mg of sample mixed with 400 ± 0.5 mg lithium metaborate (LiBO2). The melted mixture was then dissolved in 5% HNO3, sonicated, manually shaken (not stirred) until no visible grains were observed, and further diluted for analysis (after the method of Dunlea et al. (Reference Dunlea, Murray, Sauvage, Spivack, Harris and D'Hondt2015)). Precision for all elements was better than 1% of the measured value, and accuracy was confirmed by repeated analyses of International Standard Reference Materials. ICBM bulk sediment samples were pressure-digested with a mixture of HNO3, HClO4, and HF at 180°C and measured for major elements using ICP-ES (Thermo, iCAP 6300 Duo). A detailed description of the digestion procedure is given by Böning et al. (Reference Böning, Schnetger, Beck and Brumsack2018). The certified geostandard USGS BCR-2 (basaltic rock) as well as the inhouse standard TW-TUC (shale; (Böning et al., Reference Böning, Schnetger, Beck and Brumsack2018)) were used to check recovery (≥95% RSD) and precision (≤3% RSD). Results of the geochemical measurements are shown in Supplementary Table 2. Geochemical data for cores Indus-29 and -30 are from Li et al. (Reference Li, Clift, Böning, Blusztajn, Murray, Ireland and Pahnke2018).
Diffuse reflectance spectrophotometry
DRS is effective at estimating the relative concentrations of select minerals by collecting reflected light from the sediment surface (Balsam and Damuth, Reference Balsam, Damuth, Paull, Matsumoto, Wallace and Dillon2000; Balsam et al., Reference Balsam, Damuth and Deaton1999; Giosan et al., Reference Giosan, Flood and Aller2002). The iron-bearing minerals hematite and goethite have been used to reconstruct humidity variability of the Asian monsoon because hematite preferentially forms under dry and warm conditions, whereas goethite favors wet and cool environments (Schwertmann, Reference Schwertmann1971; Zhang et al., Reference Zhang, Jia, Balsam, Liu and Chen2007). As a result, the ratio of hematite to goethite can be used as an effective humidity proxy (Limmer et al., Reference Limmer, Köhler, Hillier, Moreton, Tabrez and Clift2012b; Schwertmann, Reference Schwertmann and Stucki1988). Hematite/goethite ratios can be estimated by dividing the first-derivative peak at 565 nm by the first-derivative peak at 435 nm (Balsam and Deaton, Reference Balsam and Deaton1991; Deaton and Balsam, Reference Deaton and Balsam1991; Limmer et al., Reference Limmer, Köhler, Hillier, Moreton, Tabrez and Clift2012b).
Cores were scanned at the British Ocean Sediment Core Research Facility (BOSCORF) at the National Oceanography Centre, Southampton, using a Geotek MSCL-XYZ with a Konica-Minolta CM2006d for spectrophotometry measurements. The archived halves of cores were lightly scraped and carefully rewrapped in polyethylene to limit air bubble formation. Scanning was conducted at 1-cm resolution to generate a sufficiently high-resolution record. By recording the wavelengths ranging from 360 to 740 nm at 10 nm intervals, the full visible light spectrum is achieved, eliminating the problems of water absorption associated with longer wavelengths (Jarrard and Vanden Berg, Reference Jarrard, Vanden Berg and Rothwell2006). Reflectance values were measured as a percentage compared to a barium sulfate calibration plate as a white standard (Balsam and Damuth, Reference Balsam, Damuth, Paull, Matsumoto, Wallace and Dillon2000). Results of DRS measurement are shown in Table S2.
RESULTS
Clay mineralogy and major element chemistry
The clay mineral compositions are compared with known clay mineral assemblages from the western clinoform (Limmer et al., Reference Limmer, Köhler, Hillier, Moreton, Tabrez and Clift2012b) and the Indus River mouth at Keti Bandar (Alizai et al., Reference Alizai, Hillier, Clift and Giosan2012)). The major clay mineral groups identified in all samples are a mixture of illite, chlorite, kaolinite, and smectite. They show uniformly lower proportions of kaolinite and a wider range of smectite than seen from the post-glacial core at Keti Bandar (the modern river mouth) or in the western clinoform. The samples from the canyon thalweg have a more restricted range than those taken from the canyon terraces (Indus-29, -30, and -31). The highest proportions of smectite are found on the lowest canyon terrace (Indus-29), whereas the lowest proportions of smectite are from the middle and highest terraces (Indus-30 and 31). In general, the clay mineral assemblages in the canyon and eastern clinoform have less smectite and more illite and chlorite than those at the river mouth or the western clinoform.
In all the measured sections, there is no clear correlation between clay mineralogy and core lithology (Fig. 3 and 4). Most of the variations in relative abundances of the clay minerals are caused by changes in the proportions of smectite and illite because these are the most abundant phases present. The subtler variations in the relative abundances of chlorite and kaolinite are more easily examined by clay mineral ratios, which are useful proxies of environmental trends. Here, we use the clays formed by chemical weathering (smectite and kaolinite) divided by those formed by physical erosion (chlorite and illite) as proxies of relative chemical weathering intensity. Smectite/(illite + chlorite) and kaolinite/(illite + chlorite) have been demonstrated to be effective proxies in similar Quaternary sediments from the Mekong Delta (Colin et al., Reference Colin, Siani, Sicre and Liu2010). Kaolinite-based values need to be used with caution, however, because of the low concentrations of this mineral in high uncertainties.
The ternary Al2O3-CaO + Na2O-K2O (A-CN-K) diagram from Fedo et al. (Reference Fedo, Nesbitt and Young1995) shows that the sediments of the Indus Canyon and from the eastern clinoform plot in a limited array that has low concentrations of K2O. This diagram also allows us to assess the CIA and demonstrates that the canyon sediments are comparable with the sediments on the eastern clinoform, suggesting similar compositions and probably sources.
At Indus-5 on the eastern clinoform, there are no stable, coherent, down-core trends in the clay mineral abundances or ratios (Fig. 3), or in illite crystallinity, K/Al, and CIA values during the short time period since ~800 yr BP. However, at Indus-21, clay mineral assemblages do show coherent variation with depth (Fig. 4A). There is a modest increase in chlorite and decrease in smectite towards the top of the core, postdating ~95 yr BP. Neither the upper canyon thalweg core Indus-25 (Fig. 4B) nor lower canyon meander cutoff core Indus-28 (Fig. 4C) shows coherent variabilities with depth.
The lower terrace core (Indus-29) shows generally consistent changes in down-core evolving clay mineral ratios (Fig. 4D). Smectite abundance is greatest at ~400 cm depth, where illite, chlorite, and kaolinite are at a minimum. Above this level, smectite abundance decreases and becomes more stable close to the top of the core, with a concomitant increase in chlorite and illite. kaolinite/(illite + chlorite) values are generally variable and do not always correlate with changes in smectite/(illite + chlorite) values, likely because of the low concentrations (higher uncertainties) and wide abundance range of kaolinite. Illite crystallinity is lower at the bottom and increases upwards. Variations in smectite/(illite + chlorite) with depth are generally mirrored by changes in illite crystallinity.
On the middle canyon terrace, sediments from core Indus-30 show coherent variations between clay mineral abundances, clay mineral ratios, illite crystallinity along with K/Al values (Fig. 4E). Clay mineral abundances show a shift between 90 and ~120 cm depth, where smectite starts to increase up-section and chlorite, illite, and kaolinite decrease. Clay ratios, illite crystallinity, and K/Al values are relatively constant below ~120 cm, but above this level they covary: smectite/(illite + chlorite), kaolinite/(illite + chlorite), and illite crystallinity increase whereas K/Al decreases. Values of smectite/(illite + chlorite) and kaolinite/(illite + chlorite) are generally lower in Indus-30 than in Indus-29 (Fig. 4D and E).
Diffuse reflectance spectrophotometry
The first-derivative values of the DRS data are calculated at 10-nm intervals for all studied cores. As example, the first-derivative values of six samples each from cores Indus-29 and -30 are plotted at the midpoint of each 10-nm intervals (i.e., the 360–370 nm value is plotted at 365 nm) in Supplementary Figure 2. There are clear peaks at 565 and 435 nm, indicating that both hematite and goethite are present in significant amounts in these cores. Their relatively significant concentrations are further confirmed in Supplementary Figure 3, which plots the temporal evolution of all the first-derivative values from cores Indus-29 and -30 instead of randomly picking individual samples. Both cores show strong signals at 565 and 435 nm, indicating the presence of hematite and goethite respectively throughout the record.
Hematite/goethite ratios are plotted against the sedimentary logs to explore links with sediment type (Fig. 3 and 4). There is no clear correlation between core lithology and hematite/goethite variations. The ratios decrease slightly towards the top of the core at Indus-5 on the eastern clinoform (Fig. 3) but do not vary much at Indus-21 (canyon head; Fig. 4A) or Indus-25 (upper canyon; Fig. 4B). At Indus-28 in the lower canyon meander cutoff, hematite/goethite ratios decrease sharply but briefly going up-section at ~440 cm depth and then increase from 0.7 to 1.6 up-section to 300 cm depth, indicative of a drying trend (Fig. 4C).
The lower terrace core (Indus-29) displays three phases of hematite/goethite ratios, correlating well with the clay mineral variations. Hematite/goethite ratios first increase in the bottom core catcher section, then start to decrease up-section from ~440 cm to ~360 cm depth, above which they remain relatively stable up-section to the core top (Fig. 4D). Despite small variations, hematite/goethite ratios are generally stable at Indus-30 from the bottom until ~120 cm depth, above which the ratios show a gentle increase to the top (Fig. 4E).
DISCUSSION
From upper canyon to lower canyon meander cutoff
The small variations and lack of coherent trends seen at Indus-5 on the eastern clinoform could indicate homogenization of the sediment by reworking since ~800 yr BP (Fig. 3). At Indus-21, located at the canyon head, all the chemical weathering proxies (clay ratios, illite crystallinity, K/Al, and CIA) show a gentle trend towards less chemical weathering towards the top of the core (Fig. 4A). This shift coincides with the disappearance of sandy layers in the top 5 m, which may be a result of twentieth-century damming or a change of sediment source due to avulsion of the Indus River mouth in the last 100 yr (Inam et al., Reference Inam, Clift, Giosan, Tabrez, Tahir, Rabbani, Danish and Gupta2007).
The lack of coherent changes in clay mineral assemblages, and thus chemical alteration intensities, at thalweg site Indus-25 (Fig. 4B) suggests some degree of reworking in the upper canyon thalweg, consistent with the inverted C14 age control over the past 300–500 yr. Despite small variations, the trend up-section towards increasing hematite/goethite ratios at Indus-28 after a sharp but brief decrease at ~400 cm depth implies a drying climate following a short-lived period of higher humidity (Fig. 4C). Clay mineral assemblages do not show coherent changes at Indus-28 in the meander cutoff, however, perhaps also as a result of reworking. We cannot exclude the possibility that the lack of clay mineral evolution was simply a reflection of rapid sedimentation (for which we have limited age control). Nonetheless, reworking at both Indus-25 and Indus-28 cannot have been so extreme to have mixed all signals, or we would not see consistent variations in the assemblages at different core cites.
Lower canyon terraces
Higher smectite/(illite + chlorite), lower K/Al, and higher CIA values all indicate stronger chemical weathering, potentially associated with a wetter summer monsoon. The lower terrace core (Indus-29) shows a rapid increase in chemical alteration intensity from ~440 up to ~400 cm depth according to smectite/(illite + chlorite), K/Al, and CIA, above which there is a gentle reduction and stabilization in chemical alteration intensity towards the seafloor (Fig. 4D). This trend correlates well with the humidity proxy hematite/goethite. The climate is interpreted to have been wetter during sedimentation over the depth range ~440 to 360 cm, and is associated with stronger chemical alteration. The chemical weathering intensity reaches a maximum at ~400 cm, an event which is dated back to ~5 ka. The stronger alteration indicated by smectite/(illite + chlorite), K/Al, and CIA, and the wet climate indicated by hematite/goethite before ~5 ka also correlates with the time of stronger monsoon compared with later drier conditions, as reconstructed from speleothem records (Fleitmann et al., Reference Fleitmann, Burns, Mudelsee, Neff, Kramers, Mangini and Matter2003; Wünnemann et al., Reference Wünnemann2010). However, the drop in kaolinite/(illite + chlorite) for one sample at ~400 cm at Indus 29 and the illite crystallinity trend seem to imply the opposite sense of chemical weathering (Fig. 4D). We consider these two proxies of kaolinite/(illite + chlorite) and illite crystallinity to be less reliable, particularly as kaolinite is only present in low abundances compared to smectite and is therefore more sensitive to uncertainties (Fig. 2). It is also possible that the decoupling of these proxies represents a sediment provenance effect, with more supply of sediment from smectite-rich areas in the middle Holocene. We discuss this further below.
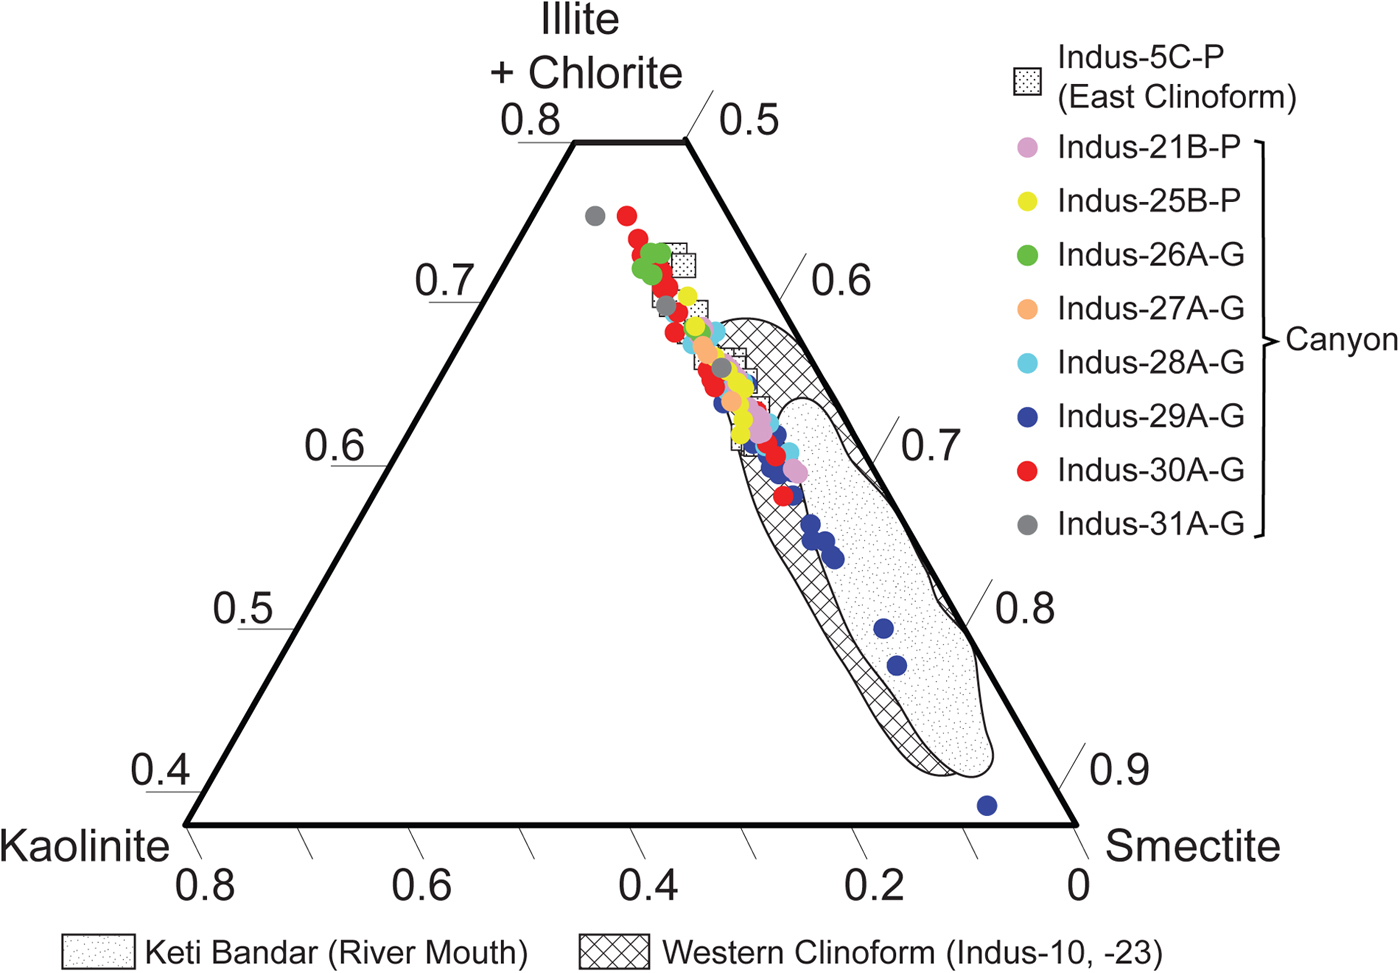
Figure 2. (color online) Ternary diagram of clay-mineral compositions from all the samples considered in this study. They show uniformly low proportions of kaolinite and a wide range of smectite versus physically weathered illite and chlorite. Clay mineral data from the western clinoform and the Indus River mouth as preserved at Keti Bandar are plotted as areas for comparison. Keti Bandar data are from Alizai et al. (Reference Alizai, Hillier, Clift and Giosan2012). western clinoform data are from Limmer et al. (Reference Limmer, Köhler, Hillier, Moreton, Tabrez and Clift2012b).

Figure 3. Down-core variations in clay minerals at Indus-5C-P, top of the eastern clinoform. Diagram shows the relative abundance of chlorite, illite, smectite, and kaolinite along with climate-sensitive proxies of smectite/(illite + chlorite), kaolinite/(illite + chlorite), illite crystallinity, K/Al, and hematite/goethite. Age control is recalibrated from original data of Clift et al. (Reference Clift, Giosan, Henstock and Tabrez2014).

Figure 4. Down-core variations in clay minerals at (A) Indus-21B-P, the head of the Indus Submarine Canyon, (B) Indus-25B-P, the thalweg of the upper canyon, (C) Indus-28A-G, the meander cutoff of the lower canyon, (D) Indus-29A-G, the lowermost terrace in the lower canyon, and (E) Indus-30A-G, the middle terrace in the lower canyon. The diagram shows the relative abundance of chlorite, illite, smectite, and kaolinite along with climate-sensitive proxies of smectite/(illite + chlorite), kaolinite/(illite + chlorite), illite crystallinity, K/Al, and hematite/goethite (five-point running average). K/Al for Indus-29 and -30 are shown with raw data in grey dots and a 5-point running average in black line to emphasize long-term changes. Age controls for Indus-21 and -28 are recalibrated from original data of Clift et al. (Reference Clift, Giosan, Henstock and Tabrez2014). Except for the new ages in Table 2, other age controls for Indus-25 and -29 are from Li et al. (Reference Li, Clift, Böning, Blusztajn, Murray, Ireland and Pahnke2018). Geochemical data for Indus-29 and -30 are from Li et al. (Reference Li, Clift, Böning, Blusztajn, Murray, Ireland and Pahnke2018). Inverted ages are seen in two cores: the calibrated age of 523 ± 114 yr at 5–7 cm depth at Indus-25 is older than the underlying 311 ± 161 years at 1095–1097 cm depth, and the calibrated age of 521 ± 104 yr at 34–36 cm depth at Indus-29 is older than the underlying 402 ± 104 yr at 99–101 cm depth, both are within the range of uncertainties. The age of 6251 ± 131 yr at 319–321 cm depth at Indus-29 is, however, resolvably older than the underlying age of 5450 ± 131 yr at 415–417 cm depth, which implies sediment reworking.
On the middle terrace at Indus-30 (Fig. 4E), chemical alteration increases significantly in the top 120 cm, which dates back to ~4–5 ka. This time coincides with a weakening of regional monsoon intensity (Dixit et al., Reference Dixit, Hodell and Petrie2014; Enzel et al., Reference Enzel, Ely, Mishra, Ramesh, Amit, Lazar and Rajaguru1999; Fleitmann et al., Reference Fleitmann, Burns, Mudelsee, Neff, Kramers, Mangini and Matter2003; Wünnemann et al., Reference Wünnemann2010), and is also marked by higher hematite/goethite ratios, as might be expected (Fig. 4E). Therefore, the change in clay mineral composition is not apparently a direct response to climate change, which would be predicted to have caused slower rates of chemical weathering (West et al., Reference West, Galy and Bickle2005). In any case, Alizai et al. (Reference Alizai, Hillier, Clift and Giosan2012) argued that clay mineral formation on the Indus floodplain takes 3–5 ka to respond to climate change. The sharp change in Indus-30 after 4–5 ka is therefore more likely related to a change in sediment source at that time rather than a direct response to climate change, especially when this was more gradual.
To compare our records with the monsoon history, we further consider temporal variations in the various clay and chemical weathering proxies in relation to climate proxies at Indus-29 (Fig. 5A) and Indus-30 (Fig. 5B). Both plots show generally coherent patterns of increasing chemical weathering around ~5 ka when smectite peaks at Indus-29 and is seen to rise to higher levels at Indus-30. Hematite/goethite ratios at Indus-29 gently decreased from 8 to 5 ka, indicating a rise in precipitation, correlating with the peak of chemical weathering indicated by smectite/(illite + chlorite), K/Al, and CIA. The fact that hematite/goethite values are generally higher before 5 ka than those after 5 ka, which is the opposite of the evolution defined by most climatic proxies, suggests that hematite/goethite is being driven by reworking of preexisting goethite-rich sediment from flood plains into the river as the climate dried, rather than indicating a direct response to climatic conditions. Chemical weathering decreased after ~5 ka at Indus-29 (Fig. 5A), returning to similar values of smectite/(illite + chlorite), K/Al, and CIA as seen before 7 ka. This transition correlates with the onset of drier climate conditions indicated by the increasing ratios of hematite/goethite after ~5 ka. Changes in smectite/(illite + chlorite) are largely driven by changes in the proportion of smectite. However, illite crystallinity fell from 7 to 5 ka before rising after that time. Typically, such a trend in illite crystallinity would be indicative of less than, rather than more, chemical weathering, the opposite is what is inferred from the smectite/(illite + chlorite) and K/Al proxies. This discrepancy at Indus-29 is likely attributable to changes in different sources for the different clay minerals and is further investigated below in the Sediment Provenance and Smectite Preferential Capture section.

Figure 5. Temporal evolution of clay minerals and climate-sensitive proxies at (A) Indus-29A-G, the lowest terrace in the lower canyon, and (B) Indus-30A-G, the middle terrace in the lower canyon. Hematite/goethite is shown as a five-point running average. K/Al is shown with raw data in grey dots and a five-point running average (black line) to emphasize long term trends. Except for the new ages in Table 2, other age controls for Indus-29 and -30 are from Li et al. (Reference Li, Clift, Böning, Blusztajn, Murray, Ireland and Pahnke2018).
A similar increase in chemical weathering, inferred from higher smectite concentrations is seen at Indus-30 starting ~5 ka (Fig. 5B). This switch to higher chemical weathering also appears to decay after 5 ka. The apparent increase in chemical weathering seen in these more continuous records shows a general correlation with decreasing summer monsoon intensity starting at ~5 ka (Dixit et al., Reference Dixit, Hodell and Petrie2014; Enzel et al., Reference Enzel, Ely, Mishra, Ramesh, Amit, Lazar and Rajaguru1999; Fleitmann et al., Reference Fleitmann, Burns, Mudelsee, Neff, Kramers, Mangini and Matter2003; Wünnemann et al., Reference Wünnemann2010), which is the opposite of what might be anticipated based on a reducing moisture supply. It is also the opposite of the trend reconstructed at Keti Bandar based on smectite/(illite + chlorite) values (Alizai et al., Reference Alizai, Hillier, Clift and Giosan2012). Therefore, we explore this disparity further by looking at the temporal evolution of kaolinite/smectite ratio, the humid-tropical/seasonal weathering proxy (Fig. 6), in the following section.

Figure 6. (color online) Temporal evolution of kaolinite/smectite for all the samples from the eastern clinoform (Indus-5) and the Indus Canyon (Indus-21,- 25, -27, -28, -29, and -30), compared with data from Keti Bandar (Alizai et al., Reference Alizai, Hillier, Clift and Giosan2012) and the western clinoform (Limmer et al., Reference Limmer, Köhler, Hillier, Moreton, Tabrez and Clift2012b). Higher values of kaolinite/smectite indicate more humid-tropical weathering. Note the rapid change in the canyon data shown by grey shading at ~5 ka. EC, eastern clinoform; WC, western clinoform.
Sediment Provenance and Smectite Preferential Capture
We include all the samples from the submarine canyon and eastern clinoform (Indus-5), as well as published data from the river mouth at Keti Bandar (Alizai et al., Reference Alizai, Hillier, Clift and Giosan2012) and western clinoform (Indus-10, -23; (Limmer et al., Reference Limmer, Köhler, Hillier, Moreton, Tabrez and Clift2012b) in Figure 6. There is a general decrease in kaolinite/smectite values for samples from the canyon since 12 ka, with a particularly sharp fall at ~5 ka, after which values stabilized. The river mouth and western clinoform, however, do not show a temporal trend. The trend in the canyon indicates strong but decreasing humid-tropical weathering prior to 5 ka. This interpretation is consistent with a strong monsoon in the early-middle Holocene (7–10 ka) weakening towards 5 ka (Fleitmann et al., Reference Fleitmann, Burns, Mudelsee, Neff, Kramers, Mangini and Matter2003; Wünnemann et al., Reference Wünnemann2010).
The river mouth (Keti Bandar) and western clinoform (Indus-10, -23) have lower kaolinite/smectite ratios than the canyon and eastern clinoform (Indus-5), especially before 7 ka (Fig. 6). The lower ratio may result from a rise in smectite or a reduction in kaolinite. It is difficult to understand why the kaolinite/smectite variation in the canyon would not be also recorded at the river mouth, assuming that the river is the dominant source of sediment to the deep water, as implied by the earlier Nd isotope work (Li et al., Reference Li, Clift, Böning, Blusztajn, Murray, Ireland and Pahnke2018). To investigate which clay mineral is the main factor controlling kaolinite/smectite variations, we next plot kaolinite and smectite contents, respectively, against age (Fig. 7). The low values of kaolinite at the river mouth and in the western clinoform are only reported to the nearest 1%, implying significant uncertainty at these low concentrations (Alizai et al., Reference Alizai, Hillier, Clift and Giosan2012; Limmer et al., Reference Limmer, Köhler, Hillier, Moreton, Tabrez and Clift2012b). It is the lack of resolution and variation in kaolinite that results in the constant kaolinite/smectite values seen at Keti Bandar and the western clinoform (Fig. 7). Kaolinite abundance in the canyon decreases slowly with time, whereas the canyon smectite abundance shows a rapid increase at ~5 ka. In addition, the range of smectite contents (17–57%; Fig. 7B) is much wider than that of kaolinite (0–7%; Fig. 7A). Therefore, the rapid fall of kaolinite/smectite values at 5 ka (Fig. 6) is mainly controlled by smectite, rather than kaolinite, abundances.

Figure 7. Temporal evolution of relative abundance of (A) kaolinite and (B) smectite for samples from eastern clinoform (Indus-5) and the Indus Canyon (Indus-21,- 25, -27, -28, -29, and -30), compared with data from Keti Bandar (Alizai et al., Reference Alizai, Hillier, Clift and Giosan2012) and western clinoform (Limmer et al., Reference Limmer, Köhler, Hillier, Moreton, Tabrez and Clift2012b). Smectite is in a much more abundance than kaolinite, with a wider range (17–57%) through time since 12 ka than kaolinite abundance (0–7%).
It is clear that the river mouth and western clinoform have uniformly higher smectite contents compared with sediment from the canyon and eastern clinoform. Kaolinite is slightly lower at Keti Bandar and western clinoform, although the uncertainties are high because of the low concentrations (Fig. 7A). We interpret the discrepancy, especially prior to 7 ka, between river mouth and canyon (Fig. 6) to be the result of preferential clay mineral transport. Smectite may not reach the canyon due to sequestering near the river mouth, or likely could be transported even further offshore beyond the canyon. Studies have shown that selective transport and preferential deposition of clay minerals occurs at river mouths when the fresh water mixes with ocean water (Whitehouse et al., Reference Whitehouse, Jeffrey and Debbrecht1960; Xue et al., Reference Xue2014). The differential settling of flocculated clays depends on a variety of parameters, including water density, salinity, slope gradient, turbulence, PH, content of organic matter, dissolved ions, hydrocarbons, and protein (Howell et al., Reference Howell, Bentley, Xu, Ferrell, Muhammad and Septama2014; Whitehouse et al., Reference Whitehouse, Jeffrey and Debbrecht1960). For example, there are French rivers entering the western Mediterranean that show a strong local increase of smectite in river mouth sediments compared to the upstream fluvial sediments (Monaco, Reference Monaco1971).
Although this difference continued after 7 ka, it is strongest during the time of Early Holocene sea-level rise (Camoin et al., Reference Camoin, Montaggioni and Braithwaite2004). Preferential transport appears to become less effective during the highstand itself. This might reflect the gradual progradation of the coast and river mouth through time, especially since the stabilization of sea level (Giosan et al., Reference Giosan2006), which reduced transport distance from the mouth to the canyon.
Smectite abundance is the key variable controlling many of the weathering proxies in this study. Smectite sharply increased in the submarine canyon and eastern clinoform (Indus-5) after 5 ka. The period since 5 ka is generally reconstructed as a time of weakening summer monsoon (Fleitmann et al., Reference Fleitmann, Burns, Mudelsee, Neff, Kramers, Mangini and Matter2003; Gupta et al., Reference Gupta, Anderson and Overpeck2003; Wünnemann et al., Reference Wünnemann2010). Typically, a weaker summer monsoon might be expected to reduce chemical weathering rates and therefore reduce the supply of smectite, but this is the opposite of what is observed in the canyon. It is likely that the weakening of monsoon intensity reduced fluvial discharge and slowed the sediment transport from the Himalaya through the flood plains to the submarine canyon. In doing so, more time is provided for sediment to be chemically weathered during transport, especially if storage on the flood plains is involved (Lupker et al., Reference Lupker, France-Lanord, Galy, Lave, Gaillardet, Gajured and Guilmette2012). However, clay minerals do not form instantly and typically a lag of 3–5 ka is estimated between the change of climate and significant change in soil clay mineral assemblages on the Indus flood plains (Alizai et al., Reference Alizai, Hillier, Clift and Giosan2012). It is thus questionable whether a rapid change in clay mineral assemblages at ~5 ka can be related to a change in climate at the same time.
Jonell et al. (Reference Jonell, Owen, Carter, Schwenniger and Clift2017c) found that phases of strong summer monsoon increased sediment storage in mountain valleys, whereas incision and erosion occurred during times of monsoon weakening. The same trends are also seen in the flood plains of the Indus (Giosan et al., Reference Giosan, Clift, Macklin, Fuller, Constantinescu, Durcan and Stevens2012). We suggest that the sediments in the canyon partly changed their sources away from direct delivery from the Himalaya to more reworking of floodplain sediments after ~5 ka, resulting in a shift in the balance of sediment supply. Attempts to mass balance the post-glacial Indus River indicate that 20–25% of the sediment reaching the delta was eroded from the flood plains (Clift and Giosan, Reference Clift and Giosan2014). Older floodplain sediments were stored and chemically weathered to produce smectite, potentially for tens of thousands of years (Giosan et al., Reference Giosan, Clift, Macklin, Fuller, Constantinescu, Durcan and Stevens2012). The clay mineral assemblages of floodplain sediments are known to contain >50% smectite (Alizai et al., Reference Alizai, Hillier, Clift and Giosan2012), making these a potentially important source that might drive the observed changes in canyon clay mineralogy.
Before 5 ka, the summer monsoon was relatively strong, and most sediments in the canyon were directly delivered from the Himalaya without long-term buffering on the floodplain. After 5 ka, when the monsoon reduced its intensity, incision and erosion on the floodplain resulted in more reworking of sediments, so that more smectite was delivered into the submarine canyon. Lastly, we cannot exclude the possibility that this increase in smectite is a result of human settlement of the floodplain. Increased smectite flux could be driven by the establishment of widespread agriculture by the Indus-Harappan civilization (2500–1900 BC; Possehl, Reference Possehl1993; (Madella and Fuller, Reference Madella and Fuller2006; Possehl, Reference Possehl1993). Farming activities such as deforestation, ploughing, irrigation, and cultivation would have enhanced large-scale soil erosion and sediment delivery to rivers both in Asia and across the world (Hu et al., Reference Hu, Clift, Böning, Hannigan, Hillier, Blusztajn and Wan2013; Jonell et al., Reference Jonell, Clift, Hoang, Hoang, Carter, Wittmann and Böning2017b; Montgomery, Reference Montgomery2007; Syvitski et al., Reference Syvitski, V., Kettner and Green2005).
Links to the monsoon
We assess possible linkage between clay mineral variations, chemical weathering intensity, and reconstructed monsoon histories in Figure 8. South Asian monsoon strength is based on a moisture-controlled pollen record from Tso (Lake) Kar in Ladakh (Wünnemann et al., Reference Wünnemann2010) and a speleothem record from the Qunf Cave in southern Oman (Fleitmann et al., Reference Fleitmann, Burns, Mudelsee, Neff, Kramers, Mangini and Matter2003). The Greenland ice core oxygen isotope record (Stuiver and Grootes (Reference Stuiver and Grootes2000) is shown as an indicator of global climate for comparison. The lake record indicates a strengthening of the summer monsoon after 11.4 ka, while the speleothem record dates the strengthening to be a little later, at ~10 ka. Both reconstructions indicate that the monsoon remained strong until a significant fall at ~5 ka, especially at Tso Kar, although drying on the Indus flood plains seems to have been slightly younger ~4 ka (Dixit et al., Reference Dixit, Hodell and Petrie2014; Enzel et al., Reference Enzel, Ely, Mishra, Ramesh, Amit, Lazar and Rajaguru1999). Temporal variations of kaolinite/smectite document a trend in the Indus Submarine Canyon and its eastern clinoform that is coherent with the monsoon history since ~12 ka, especially between Indus-30 clay and Tso Kar pollen records at 12–5 ka. After 5 ka, the sharp fall of kaolinite/smectite values coincides with weakening of monsoon intensities, suggestive of a sediment source change rather than a direct response to the weathering regime. As noted above, the rapid rise of smectite abundance might be a result of fluvial transport slowing and/or a change to more reworking of preexisting floodplain sediments. This response is the opposite of that expected from less intense summer rainfall, which might be predicted to form less smectite under drier and cooler conditions (West et al., Reference West, Galy and Bickle2005). Therefore, the obvious geochemical and mineralogical shift at 5 ka seen in the samples from the canyon and eastern clinoform shows a clear response to the onshore monsoonal climate change, in a hydrologic/provenance way instead of a more direct chemical weathering change.
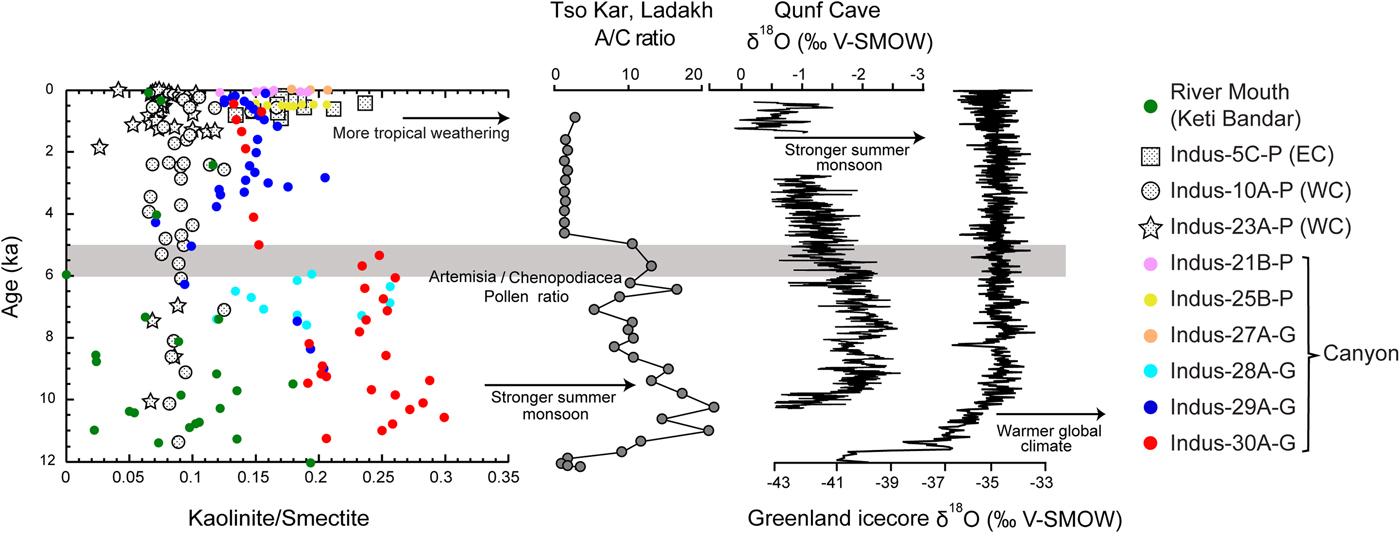
Figure 8. (color online) Temporal evolution of kaolinite/smectite compared with two monsoon reconstructions, a moisture-controlled pollen record from Tso Kar in Ladakh (India; (Wünnemann et al., Reference Wünnemann2010), and a speleothem record from the Qunf Cave in southern Oman (Fleitmann et al., Reference Fleitmann, Burns, Mudelsee, Neff, Kramers, Mangini and Matter2003). The Greenland ice core from Stuiver and Grootes (Reference Stuiver and Grootes2000) is shown as a global temperature record for comparison. The grey shading indicates the period of rapid change in the canyon data at ~5 ka, correlating well with the weakening of the southwest Asian summer monsoon.
CONCLUSIONS
This study of a series of cores along the Indus Submarine Canyon, as well as from its eastern clinoform, show a clear response in offshore sediment to the large-scale onshore climate change. The canyon sediments have changed their sources from direct flux from the Himalaya to increasing flux from erosion of the smectite-rich flood plains after ~5 ka. The clay mineral assemblages from the Indus Canyon and eastern clinoform are uniformly rich in smectite and illite compared to chlorite and kaolinite, although there is consistently more smectite preserved in the river mouth than in the submarine canyon, especially before 7 ka. Although we consider the Indus River to be the source of fine-grained sediment to the canyon and its eastern clinoform, the difference between the delta and the offshore argues for preferential capture of smectite close to the river mouth. Climate influences chemical weathering intensities, but the fast rate of change seen in the canyon after ~5 ka implies that this shift to a more smectite-rich assemblage is driven by a change in where the sediment is eroded from, with less direct flux from the Himalaya and more recycling of older weathered sediment from the flood plains after ~5 ka. This is consistent with the lower kaolinite/smectite values since ~5 ka. The onset of large-scale anthropogenic agricultural activities after ~5 ka may have also enhanced erosion of older weathered floodplain sediments, resulting in more influx of smectite that is subsequently transported into the canyon.
ACKNOWLEDGMENTS
We thank the Charles T. McCord Chair in Petroleum Geology at Louisiana State University for financial support of this project. National Environment Research Council (UK) is thanked for supporting the original expedition and curation of the core material. We also thank Guy Rothwell and Suzie Maclachlan for their help at BOSCORF, Wanda S. LeBlanc for her technical assistance with XRD, and Stephen Hillier for his helpful advice.
SUPPLEMENTARY MATERIAL
The supplementary material for this article can be found at https://doi.org/10.1017/qua.2019.44.


