


Introduction
Alzheimer’s disease (AD) is the most frequent neurodegenerative disorder causing cognitive impairment, disabilities, and finally dementia in aged people. This disease is related to an extra-cellular brain accumulation of beta-amyloid (Aβ) and intracellular tangles of hyperphosphorylated tau peptides that affect cortical neuronal networks related to cognitive functions (Pievani, de Haan, Wu, Seeley, & Frisoni, Reference Pievani, de Haan, Wu, Seeley and Frisoni2011). Soluble Aβ elicits a toxic signaling cascade by receptors leading to synaptic impairments, intraneuronal Aβ42 aggregates, and correlated cognitive deficits (Dziewczapolski, Glogowski, Masliah, & Heinemann, Reference Dziewczapolski, Glogowski, Masliah and Heinemann2009). This compromised signaling possibly leads to or aggravates aggregation of hyperphosphorylated tau protein and formation of neurofibrillary tangles (NFTs). Preclinical data suggest a non-linear relationship of Aβ peptide levels with synaptic plasticity (Parihar & Brewer, Reference Parihar and Brewer2010). Aβ at lower levels may play a physiological role in synaptic plasticity (Puzzo et al., Reference Puzzo, Privitera, Leznik, Fa, Staniszewski, Palmeri and Arancio2008), whereas higher levels of Aβ may impair synaptic activity (Shankar et al., Reference Shankar, Bloodgood, Townsend, Walsh, Selkoe and Sabatini2007) or may even be induced by synaptic activity (Cirrito et al., Reference Cirrito, Kang, Lee, Stewart, Verges, Silverio and Holtzman2008) in metabolic active cortical regions (Buckner et al., Reference Buckner, Sepulcre, Talukdar, Krienen, Liu, Hedden and Johnson2009). The bidirectional interaction between local amyloid accumulation and metabolic activity may be an important determinant for the cognitive effects of AD pathological changes and represent a potential determinant for brain reserve capacity, that is, the ability of the brain to maintain function despite an increasing load of neurodegenerative lesions.
Structural, molecular, and functional neuroimaging studies have replicated the findings of a systematic spread of AD pathology markers. First, patterns of brain atrophy, as revealed by structural magnetic resonance imaging (MRI), most closely resemble the distribution of neurofibrillary tangles across different clinical stages of disease (Chetelat et al., Reference Chetelat, Desgranges, De La Sayette, Viader, Eustache and Baron2002; Whitwell et al., Reference Whitwell, Przybelski, Weigand, Knopman, Boeve, Petersen and Jack2007). Second, positron emission tomography (PET) of amyloid in the brain suggests a sequence of amyloid accumulation similar to stages derived from autopsy studies (Thal, Attems, & Ewers, Reference Thal, Attems and Ewers2014). Third, 18FDG-PET detection of cortical glucose consumption uncovers a sequence of metabolic changes that overlaps between both, pattern of brain atrophy/tangle accumulation and amyloid deposition (Choo et al., Reference Choo, Lee, Youn, Jhoo, Kim, Lee and Woo2007). An emergent regional pattern from these multimodal-imaging studies suggests a characteristic network of key brain regions that are involved in a specific temporal sequence across the clinical stages of AD.
Compared to the mentioned neuroimaging techniques, human brain neural networks have been more directly probed by diffusion tensor imaging (DTI) and resting-state functional MRI (rs-fMRI). These techniques have identified consistent structurally and functionally connected brain networks in the human brain (Fox et al., Reference Fox, Snyder, Vincent, Corbetta, Van Essen and Raichle2005; van den Heuvel, Mandl, Kahn, & Hulshoff Pol, Reference van den Heuvel, Mandl, Kahn and Hulshoff Pol2009). The destruction of key hubs of these networks may mediate the effect of molecular pathology on cognitive performance in AD (Koch et al., Reference Koch, Myers, Gottler, Pasquini, Grimmer, Forster and Sorg2014); along the same line, brain reserve may act through modulation of such networks to preserve cognitive function in the presence of molecular pathology (Bozzali et al., Reference Bozzali, Dowling, Serra, Spano, Torso, Marra and Cercignani2014). One step further, it has even been implicated that the functional connectivity within a network and the strengths of positive functional associations between intrinsic networks determines the regional spread of different types of neurodegenerative changes, such as neurofibrillary tangles, amyloid accumulation, Lewy bodies, and TDP43 deposition, which in turn lead to distinct clinical disease entities, such as AD (tau and amyloid), Lewy body dementia (alpha-synuclein), or frontotemporal dementia (tau and TDP43) (Zhou, Gennatas, Kramer, Miller, & Seeley, Reference Zhou, Gennatas, Kramer, Miller and Seeley2012).
On this basis, an understanding of the functional and structural organization of brain networks may further our understanding of neurodegenerative disease pathogenesis and brain reserve. In a back-translation approach, imaging can provide evidence to support the hypothesis of network specificity of AD. These findings inform basic science studies on potential molecular mechanisms that account for the network specificity of pathological features of AD. Complementary, hypotheses on molecular mechanisms, such as oxidative stress of highly connected network hubs (Buckner et al., Reference Buckner, Sepulcre, Talukdar, Krienen, Liu, Hedden and Johnson2009) or prion-like spread of pathogenic protein conformations along strong anatomical connections (Braak & Del Tredici, Reference Braak and Del Tredici2011), can be tested in the human in vivo framework using multimodal imaging. Associations between metabolic characteristics of a cortical hub region and molecular and atrophic changes, both in large cross-sectional samples across clinically and biomarker-based disease stages and in longitudinal cohorts spanning the time of conversion from cognitively healthy to early dementia stages, can help to test the pathogenetic validity of specific molecular mechanisms in humans. In a complementary perspective, brain functional and structural connectivity represents the potential substrate of brain reserve capacity in the presence of significant AD pathology and comorbid pathologies such as cerebrovascular disease. Understanding mechanisms of brain reserve provides both potential targets for preventive interventions and in vivo surrogate endpoints to test the mechanistic mode of action of a specific intervention. From a clinical point of view, the study of network connectivity may provide a diagnostic marker of early disease as well as a prognostic marker at an individual level where the integrity of key functional networks will influence the likelihood of cognitive decline at a given level of molecular pathology (Teipel et al., Reference Teipel, Sabri, Grothe, Barthel, Prvulovic, Buerger and Hampel2013).
In the following sections, we will introduce established as well as emerging methods to determine functional and structural cortical connectivity in the living human brain, covering acquisition and analysis of such data, and describe the main contributions of these methods to our current understanding of pathogenesis, diagnosis, and disease monitoring in AD. A specific emphasis is put on multimodal approaches. In this framework, limitations and perspectives will be outlined that are related to the validity of a method (in respect to assumed underlying neurobiological substrates) as well as its implementation into a clinical setting in the middle to the far future.
Methodology of Connectivity Analysis
Functional MRI provides a unique window to study AD’s impact on coherent slowly fluctuating brain activity, that is, intrinsic brain networks (Fox & Raichle, Reference Fox and Raichle2007). At rest, macroscopic brain activity fluctuates slowly at frequencies below 0.1 Hz; such fluctuations are detectable by rs-fMRI. Slowly fluctuating activity is coherent or synchronized across brain regions (i.e., functional connectivity), constituting a couple of intrinsic brain networks such as the default mode or dorsal attention network (Fox et al., Reference Fox, Snyder, Vincent, Corbetta, Van Essen and Raichle2005). Intrinsic brain networks represent a highly conserved and robust form of organized macroscopic brain activity, that is, comparable networks are observed in distinct species such as mice, monkeys, and humans (Vincent et al., Reference Vincent, Patel, Fox, Snyder, Baker, Van Essen and Raichle2007), in distinct stages of ontogeny such as after preterm birth, babies, children, adults, and elder persons (Doria et al., Reference Doria, Beckmann, Arichi, Merchant, Groppo, Turkheimer and Edwards2010), and at distinct stages of awareness from sleep to different domains of goal-directed behavior (Smith et al., Reference Smith, Fox, Miller, Glahn, Fox, Mackay and Beckmann2009). The rs-fMRI signal is of special relevance for many analytical methods assessing functional connectivity. It provides spontaneous low-frequency fluctuations of blood oxygen level-dependent (BOLD) signals (Figure 1) and makes possible investigations of the network architecture of brain systems (Biswal, Yetkin, Haughton, & Hyde, Reference Biswal, Yetkin, Haughton and Hyde1995; Biswal et al., Reference Biswal, Mennes, Zuo, Gohel, Kelly, Smith and Milham2010; Fox & Raichle, Reference Fox and Raichle2007; Lu et al., Reference Lu, Liu, Zhang, Wang, Cao, Ma and Li2011). Compared to conventional fMRI studies, rs-fMRI is a task-free and data-driven neuroimaging technique that can be easily acquired in cognitively impaired populations. There are four main methods in which rs-fMRI has been frequently applied. Seed-based analysis uses correlations of rs-fMRI spontaneous low-frequency fluctuations between a seed region and the rest of the brain (Figure 1-I) (Biswal et al., Reference Biswal, Yetkin, Haughton and Hyde1995). It describes relatively simple patterns of functional connectivity of single brain areas. More advanced approaches take advantage of multiple simultaneous brain interactions to pull apart coherent brain networks. For instance, independent component analysis (ICA) and clustering methods have been extremely useful to isolate modules of the brain and to create subdivisions and parcellation schemes of the cerebral cortex (Figure 1-II and 1-III) (Beckmann, DeLuca, Devlin, & Smith, Reference Beckmann, DeLuca, Devlin and Smith2005; Yeo et al., Reference Yeo, Krienen, Sepulcre, Sabuncu, Lashkari, Hollinshead and Buckner2011). Third, graph theory has facilitated the comprehension and visualization of complex brain interactions by transforming connectivity data to nodes (vertices) and links (edges) (Figure 1-IV) (Bullmore & Sporns, Reference Bullmore and Sporns2009; Rubinov & Sporns, Reference Rubinov and Sporns2010). Several graph theoretical metrics quantify “network hubs” of the brain, that is central regions that act as integration stations for connecting otherwise segregated brain networks (Figure 1-IV, Basic Metrics in Graph Theory) (Buckner et al., Reference Buckner, Sepulcre, Talukdar, Krienen, Liu, Hedden and Johnson2009; Crossley et al., Reference Crossley, Mechelli, Vertes, Winton-Brown, Patel, Ginestet and Bullmore2013; Sporns, Honey, & Kotter, Reference Sporns, Honey and Kotter2007; van den Heuvel & Sporns, Reference van den Heuvel and Sporns2011; Zuo et al., Reference Zuo, Ehmke, Mennes, Imperati, Castellanos, Sporns and Milham2012), while other metrics—such as clustering coefficient, path length, small-worldness, or rich-club organization—emphasize modularity or efficient communications. Finally, diffusion graph theory algorithms have been proposed to study putative pathways for the spread of pathology through interconnected brain systems (Figure 1-IV, Diffusion/Spreading Metrics in Graph Theory) (Raj, Kuceyeski, & Weiner, Reference Raj, Kuceyeski and Weiner2012; Sepulcre, Sabuncu, Becker, Sperling, & Johnson, Reference Sepulcre, Sabuncu, Becker, Sperling and Johnson2013; Sepulcre, Sabuncu, Yeo, Liu, & Johnson, Reference Sepulcre, Sabuncu, Yeo, Liu and Johnson2012). More advanced analysis methods additionally incorporate the phase lag information of the time signal, such as Granger causality analysis (Goebel, Roebroeck, Kim, & Formisano, Reference Goebel, Roebroeck, Kim and Formisano2003; Granger, Reference Granger1969) or dynamic causal modeling (Friston, Harrison, & Penny, Reference Friston, Harrison and Penny2003), to derive a causal relationship between brain regions. Those techniques have been applied less frequently in the context of AD (Agosta et al., Reference Agosta, Rocca, Pagani, Absinta, Magnani, Marcone and Filippi2010; Dauwels, Vialatte, Musha, & Cichocki, Reference Dauwels, Vialatte, Musha and Cichocki2010; Liu et al., Reference Liu, Zhang, Yan, Bai, Dai, Wei and Tian2012; Miao, Wu, Li, Chen, & Yao, Reference Miao, Wu, Li, Chen and Yao2011), as they are prone to provide different results caused by random variance in the data (Daunizeau, David, & Stephan, Reference Daunizeau, David and Stephan2011). Further in-depth discussion on methodology of fMRI data analysis can be found in two recent reviews by Krajcovicova, Marecek, Mikl, & Rektorova (Reference Krajcovicova, Marecek, Mikl and Rektorova2014) and Dennis & Thompson (Reference Dennis and Thompson2014).
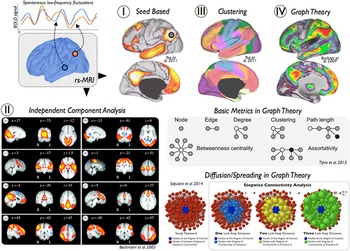
Fig. 1 Overview of functional connectivity analysis methods for resting-state functional MRI. Several neuroimaging techniques use low-frequency spontaneous fluctuations in brain activity to analyze functional connections in the human brain. (I) Seed-based correlation analysis is a widely used approach to characterize functional connectivity patterns of seed regions or voxels of interest. (II) Independent component analysis is a signal processing method that is able to separate independent sources from mixed signals of the rs-fMRI data. (III) Clustering techniques, such as k-means or hierarchical clustering, are useful approaches to generate spatial partitions based on functional connectivity profiles. (IV) Graph theory refers to a wide field of research that focuses on the analysis of graphs, defined by pairwise associations of nodes, and network structures. In neuroimaging, graph theoretical metrics have been used to describe multiple network properties of the human brain. Several examples of basic measures and a diffusion/spreading method are displayed in the figure.
The term structural connectivity refers to the interconnection between neurons or brain regions by nerve fibers. The integrity of fiber tracts can be assessed in vivo using diffusion-weighted imaging techniques (Le Bihan, Turner, Douek, & Patronas, Reference Le Bihan, Turner, Douek and Patronas1992). These allow the mapping of the diffusion process of water molecules and rely on the principle that the diffusion of water is restricted by the tissue structure. In the context of AD, diffusion tensor imaging (DTI) is being used most frequently. The minimum scan protocol comprises one non-diffusion image, often referred to as B0 image, and six diffusion-weighted images for opposing gradient directions (Basser, Mattiello, & LeBihan, Reference Basser, Mattiello and LeBihan1994). From these data, a tensor model is estimated that can be represented as an ellipsoid with three principal axes, the length of which reflects the diffusion tendency along each direction (λ1, λ2, λ3; Figure 2, Diffusion Tensor Modeling). Scalar tissue integrity measures characterizing the shape of the ellipsoid include the fractional anisotropy (FA), mode of anisotropy (MO), as well as axial (aD), radial (rD), and mean diffusivity (MD), providing complementary information about the configuration of the ellipsoid axes (Le Bihan et al., Reference Le Bihan, Mangin, Poupon, Clark, Pappata, Molko and Chabriat2001) (Figure 2-II). In extension to characterizing single voxels, one can perform fiber tracking to infer the white matter pathways within the brain, with the two most popular approaches being streamline and probabilistic tractography (Mori, Crain, Chacko, & Van Zijl, Reference Mori, Crain, Chacko and Van Zijl1999; Mori & Zhang, Reference Mori and Zhang2006) (Figure 2-I). Both methods do not only use the shape but also the principal direction of the ellipsoid to trace the most likely fiber pathways. Patient’s characteristics, group differences, or statistical associations between fiber tract integrity measures and, for instance, measures of cognitive functioning can be assessed using hypothesis-based region of interest analysis (Figure 2, Analysis Methods). Complementary data-driven voxel-based analysis allows the evaluation of group differences or statistical associations on the level of each single voxel (Figure 2, Analysis Methods).
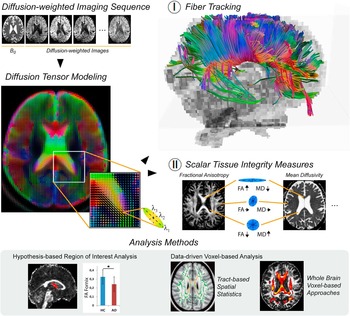
Fig. 2 Overview of structural connectivity analysis methods for diffusion tensor imaging. Diffusion-weighted imaging assesses the diffusion of water molecules that is restricted by the tissue structure. In diffusion tensor imaging the diffusion process is modeled as a tensor, which is estimated from the non-diffusion image (B0) and the diffusion-weighted scans. The tensor model can be represented as an ellipsoid with three principal axes (λ1, λ2, λ3), the length of which reflects the diffusion tendency along each direction. (I) Fiber tracking algorithms use the shape and the direction of the ellipsoid to trace the most likely fiber pathways. (II) Scalar tissue integrity measures, such as the fractional anisotropy (FA) or mean diffusivity (MD), characterize the shape of the ellipsoid. In large tracts with mainly parallel orientation of the fibers, for example, in the corpus callosum, the ellipsoid is cigar-shaped such that FA reaches its largest values while MD is relatively low. In the liquor, the water is not restricted in any direction leading to a ball-shaped ellipsoid, indicated by high MD and low FA. Both measures have intermediate values in gray matter regions as well as crossing fiber areas where the ellipsoid may be more oblate-shaped. Statistical analysis approaches can be categorized in hypothesis-based region of interest analysis and data-driven voxel-based analysis methods.
Contribution of Cortical Disconnection to AD Phenotype and Development
Functional Connectivity Changes in the Course of AD
Neuroimaging approaches including rs-fMRI have produced a tide of direct support for the network-based neurodegeneration hypothesis in living humans (Buckner et al., Reference Buckner, Snyder, Shannon, LaRossa, Sachs, Fotenos and Mintun2005; Greicius, Srivastava, Reiss, & Menon, Reference Greicius, Srivastava, Reiss and Menon2004; Raj, Kuceyeski, & Weiner, Reference Raj, Kuceyeski and Weiner2012; Seeley, Crawford, Zhou, Miller, & Greicius, Reference Seeley, Crawford, Zhou, Miller and Greicius2009; Zhou, Gennatas, Kramer, Miller, & Seeley, Reference Zhou, Gennatas, Kramer, Miller and Seeley2012). AD, the most common neurodegenerative disorder, begins with dysfunction in episodic memory before progressing to involve posterior cortical cognitive functions such as word retrieval, visuospatial function, arithmetic, and praxis. In parallel to the symptoms, AD is associated with atrophy and hypometabolism predominantly in posterior hippocampal, cingulate, temporal, and parietal regions, which collectively resemble the default mode network (DMN) as mapped in healthy subjects with task-free fMRI (Greicius, Krasnow, Reiss, & Menon, Reference Greicius, Krasnow, Reiss and Menon2003). The DMN is typically found deactivated during cognitive tasks requiring externally focused attention and activated during internally focused mental tasks, such as episodic memory retrieval, mental state attribution, and visual imagery (Buckner, Andrews-Hanna, & Schacter, Reference Buckner, Andrews-Hanna and Schacter2008; Mason et al., Reference Mason, Norton, Van Horn, Wegner, Grafton and Macrae2007; Raichle et al., Reference Raichle, MacLeod, Snyder, Powers, Gusnard and Shulman2001; Shulman et al., Reference Shulman, Corbetta, Fiez, Buckner, Miezin, Raichle and Petersen1997).
In addition to the regional atrophy and neuronal hypometabolism affecting DMN nodes, disruptions in functional connectivity of the DMN in AD dementia have been widely replicated (Agosta et al., Reference Agosta, Pievani, Geroldi, Copetti, Frisoni and Filippi2012; Binnewijzend et al., Reference Binnewijzend, Schoonheim, Sanz-Arigita, Wink, van der Flier, Tolboom and Barkhof2012; Greicius, Srivastava, Reiss, & Menon, Reference Greicius, Srivastava, Reiss and Menon2004), and have been linked to core memory and visuospatial deficits (Greicius et al., Reference Greicius, Srivastava, Reiss and Menon2004; Supekar, Menon, Rubin, Musen, & Greicius, Reference Supekar, Menon, Rubin, Musen and Greicius2008; Zhang et al., Reference Zhang, Wang, Liu, Ma, Yang, Zhang and Teng2010). Intriguingly, connectivity disruption and impaired task-related down regulation of the DMN may already emerge during the presymptomatic phase of AD as modeled cross-sectionally on the basis of imaging evidence of cortical amyloid pathology (Hedden et al., Reference Hedden, Van Dijk, Becker, Mehta, Sperling, Johnson and Buckner2009; Sperling et al., Reference Sperling, Laviolette, O’Keefe, O’Brien, Rentz, Pihlajamaki and Johnson2009) or an apolipoprotein E4 (APOE4) positive genotype, which is a major genetic risk factor for late onset AD (Damoiseaux et al., Reference Damoiseaux, Seeley, Zhou, Shirer, Coppola, Karydas and Greicius2012; Machulda et al., Reference Machulda, Jones, Vemuri, McDade, Avula, Przybelski and Jack2011; Persson et al., Reference Persson, Lind, Larsson, Ingvar, Sleegers, Van Broeckhoven and Nyberg2008). Particularly the functional isolation of the posterior cingulate from its main interaction sites in the medial temporal lobe and the medial prefrontal cortex appears to emerge early in the disease process and was found to be related to worsening episodic memory function in MCI subjects (Bai et al., Reference Bai, Watson, Shi, Wang, Yue, Yuhuan and Zhang2011). Of interest, the posterior cingulate cortex showed reduced connectivity in MCI patients even in the absence of gray matter atrophy, which was only detectable at the stage of fully developed AD (Gili et al., Reference Gili, Cercignani, Serra, Perri, Giove, Maraviglia and Bozzali2011). AD pathology, however, also presents with non-memory symptoms such as impairments in executive function, language, and visuospatial abilities, particularly at the clinically manifest dementia stage of the disease. While there is also evidence of impaired executive function network connectivity (including the dorsal lateral prefrontal cortex and superior parietal lobe) in AD and MCI (Brier et al., Reference Brier, Thomas, Snyder, Benzinger, Zhang, Raichle and Ances2012; Liang, Wang, Yang, Jia, & Li, Reference Liang, Wang, Yang, Jia and Li2011; Sorg et al., Reference Sorg, Riedl, Muhlau, Calhoun, Eichele, Laer and Wohlschlager2007), the relation of these changes to the emergence of respective clinical symptoms still requires further investigation.
In the task-free setting, DMN activity correlates inversely with activity in multiple brain regions in health, including the salience network (SN) (Fox et al., Reference Fox, Snyder, Vincent, Corbetta, Van Essen and Raichle2005; Greicius & Menon, Reference Greicius and Menon2004; Seeley et al., Reference Seeley, Allman, Carlin, Crawford, Macedo, Greicius and Miller2007). Many forms of emotional salience require a focusing of attention toward homeostatic demands and behavioral responses (“here and now”), creating a need to de-prioritize attention to internal (“there and then”) ruminations about one’s personal past or future, functions attributed to the DMN (Seeley et al., Reference Seeley, Allman, Carlin, Crawford, Macedo, Greicius and Miller2007). Such opposing network functions might engender between-network competition for brain resources (Deco & Corbetta, Reference Deco and Corbetta2011), shifts between “binary brain configurations” (Jones et al., Reference Jones, Vemuri, Murphy, Gunter, Senjem, Machulda and Jack2012), or direct reciprocal suppression of one network in favor of the other, orchestrated by nodes within the two networks or by a nodal “switch” positioned elsewhere to reconfigure network dynamics in response to shifting conditions (Menon & Uddin, Reference Menon and Uddin2010). Questionnaire- and laboratory-based studies suggest that patients with AD show retained or enhanced interpersonal warmth and empathy, mutual gaze, and emotional morality (Mendez & Shapira, Reference Mendez and Shapira2009; Rankin et al., Reference Rankin, Gorno-Tempini, Allison, Stanley, Glenn, Weiner and Miller2006; Sollberger et al., Reference Sollberger, Stanley, Wilson, Gyurak, Beckman, Growdon and Rankin2009; Sturm et al., Reference Sturm, McCarthy, Yun, Madan, Yuan, Holley and Levenson2011). Emotional contagion (sharing emotional states with others) appears to increase linearly across the healthy through MCI to AD dementia spectrum (Sturm et al., Reference Sturm, Yokoyama, Seeley, Kramer, Miller and Rankin2013). In line with these findings, AD patients were shown to exhibit increased SN connectivity compared to controls, which was associated with decreased DMN connectivity (Zhou et al., Reference Zhou, Greicius, Gennatas, Growdon, Jang, Rabinovici and Seeley2010). SN enhancement has been widely replicated in the growing AD task-free fMRI literature. Evidence to date suggests that SN hub connectivity escalates in genetic at risk groups (APOE4 carriers) and prodromal stages of AD (Bai et al., Reference Bai, Watson, Yu, Shi, Yuan and Zhang2009; Brier et al., Reference Brier, Thomas, Snyder, Benzinger, Zhang, Raichle and Ances2012; Machulda et al., Reference Machulda, Jones, Vemuri, McDade, Avula, Przybelski and Jack2011), correlates with emotion intensification symptoms (Balthazar et al., Reference Balthazar, Pereira, Lopes, da Silva, Coan, Campos and Cendes2013), is accompanied by SN hyperperfusion (Hsieh, Kao, Huang, & Chou, Reference Hsieh, Kao, Huang and Chou2010), and may wane in later disease stages (Brier et al., Reference Brier, Thomas, Snyder, Benzinger, Zhang, Raichle and Ances2012).
Multimodal imaging of functional connectivity and amyloid load
In addition to the connectivity changes within and across particular networks, emerging graph theoretical approaches also detected changes in general network topology in AD, characterized by a lower clustering coefficient or an increased characteristic path length, which renders the whole-brain network metrics closer to the theoretical values of random networks and largely supports the hypothesis of disrupted global information integration in AD (Sanz-Arigita et al., Reference Sanz-Arigita, Schoonheim, Damoiseaux, Rombouts, Maris, Barkhof and Stam2010; Wang et al., Reference Wang, Liang, Wang, Tian, Zhang, Li and Jiang2007). Impaired parallel information transmission efficiency and reduced intra- and inter-modular connectivity of the posterior DMN and executive control network were also detected in healthy APOE4 carriers compared to non-carriers (Wang et al., Reference Wang, Wang, He, Yu, Wang and He2015). Future work is needed to develop network imaging methods equipped to handle both intra- and inter-network connectivity and topology profiles, corresponding to the broad range of clinico-anatomical presentations associated with the disease.
Aberrant functional connectivity of intrinsic networks is intimately linked with AD’s amyloid pathology (Drzezga et al., Reference Drzezga, Becker, Van Dijk, Sreenivasan, Talukdar, Sullivan and Sperling2011; Sheline, Raichle, et al., Reference Sheline, Raichle, Snyder, Morris, Head, Wang and Mintun2010; Sperling et al., Reference Sperling, Laviolette, O’Keefe, O’Brien, Rentz, Pihlajamaki and Johnson2009). Using PiB-PET (i.e., Pittsburgh Compound B PET) to detect in vivo amyloid-β plaques in combination with rs-fMRI in asymptomatic and mildly impaired elderly with amyloid positivity, Drzezga and colleagues found that the higher the amyloid plaque load the more the global centrality in the parietal cortex is reduced (centrality measures for each voxel its degree of functional connectivity with all other voxels of the brain) (Drzezga et al., Reference Drzezga, Becker, Van Dijk, Sreenivasan, Talukdar, Sullivan and Sperling2011). More specifically, for several networks, such as default mode and different attention networks, the spatial distributions of plaques and network functional connectivity were highly correspondent in individuals with prodromal AD, suggesting that plaque spread is linked with a networks’ connectivity (Myers et al., Reference Myers, Pasquini, Gottler, Grimmer, Koch, Ortner and Sorg2014). Furthermore, in network centers of high connectivity and high plaque load, this relationship changes, that is, the more plaques the more connectivity is impaired, demonstrating the detrimental effect of amyloid pathology on intrinsic functional connectivity when certain levels of pathology are overstepped. These studies demonstrate the relevance of intrinsic brain networks for pathophysiology and pathogenesis of AD particularly in early stages of the disease. Of interest, while APOE4 genotype has been consistently associated with increased amyloid load (Morris et al., Reference Morris, Roe, Xiong, Fagan, Goate, Holtzman and Mintun2010), detrimental effects of this genotype on functional brain connectivity have also been observed independently of amyloid pathology (Sheline, Morris, et al., Reference Sheline, Morris, Snyder, Price, Yan, D’Angelo and Mintun2010). Although genetic effects on functional connectivity disruptions are best studied for the APOE4 genotype, there are now also initial reports of connectivity-altering effects of other risk genes for AD, such as polymorphisms in tau- or KIBRA-related genes (Bai et al., Reference Bai, Liao, Yue, Pu, Shi, Yu and Zhang2014; Wang et al., Reference Wang, Liu, Qin, Wang, Zhang, Jiang and Yu2013).
Structural Disconnection in the Course of AD
Several cross-sectional DTI studies revealed white matter integrity changes in AD dementia patients compared to healthy controls in wide spread commissural, association, and limbic fiber tracts, whereas extracortical projecting fiber tracts were found to be relatively preserved until advanced stages of the disease (Bozzali et al., Reference Bozzali, Falini, Franceschi, Cercignani, Zuffi, Scotti and Filippi2002, Reference Bozzali, Franceschi, Falini, Pontesilli, Cercignani, Magnani and Filippi2001; Fellgiebel et al., Reference Fellgiebel, Muller, Wille, Dellani, Scheurich, Schmidt and Stoeter2005; Friese et al., Reference Friese, Meindl, Herpertz, Reiser, Hampel and Teipel2010; Huang, Friedland, & Auchus, Reference Huang, Friedland and Auchus2007; Medina et al., Reference Medina, DeToledo-Morrell, Urresta, Gabrieli, Moseley, Fleischman and Stebbins2006; Naggara et al., Reference Naggara, Oppenheim, Rieu, Raoux, Rodrigo, Dalla Barba and Meder2006; Stahl et al., Reference Stahl, Dietrich, Teipel, Hampel, Reiser and Schoenberg2007; Xie et al., Reference Xie, Xiao, Gong, Zang, Wang, Wu and Jiang2006; Zhang et al., Reference Zhang, Schuff, Jahng, Bayne, Mori, Schad and Weiner2007). In MCI subjects, disruptions of white matter integrity were mainly reported for limbic fiber tracts with direct connections to medial temporal lobe structures, including the posterior and parahippocampal cingulum, the perforant path, the fornix, and the uncinate fasciculus (Fellgiebel et al., Reference Fellgiebel, Muller, Wille, Dellani, Scheurich, Schmidt and Stoeter2005; Kalus et al., Reference Kalus, Slotboom, Gallinat, Mahlberg, Cattapan-Ludewig, Wiest and Kiefer2006; Sexton et al., Reference Sexton, Mackay, Lonie, Bastin, Terriere, O’Carroll and Ebmeier2010; Zhang et al., Reference Zhang, Schuff, Jahng, Bayne, Mori, Schad and Weiner2007).
In an attempt to better characterize the earliest white matter changes and their regional progression in the course of AD pathogenesis, recent DTI studies have more and more focused on asymptomatic at-risk populations, such as healthy subjects carrying AD-susceptibility genes, most notably the APOE4 allele (Bendlin et al., Reference Bendlin, Ries, Canu, Sodhi, Lazar, Alexander and Johnson2010; Kljajevic et al., Reference Kljajevic, Meyer, Holzmann, Dyrba, Kasper, Bokde and Teipel2014; Westlye, Reinvang, Rootwelt, & Espeseth, Reference Westlye, Reinvang, Rootwelt and Espeseth2012; Xiong et al., Reference Xiong, Roe, Buckles, Fagan, Holtzman, Balota and Morris2011), but also other risk-associated candidate genes (Braskie et al., Reference Braskie, Jahanshad, Stein, Barysheva, Johnson, McMahon and Thompson2012, Reference Braskie, Jahanshad, Stein, Barysheva, McMahon, de Zubicaray and Thompson2011; Forde et al., Reference Forde, Ronan, Suckling, Scanlon, Neary, Holleran and Cannon2014; Liang, Li, et al., Reference Liang, Li, Lv, Shu, Chen, Li and Zhang2015; Lyall et al., Reference Lyall, Harris, Bastin, Munoz Maniega, Murray, Lutz and Deary2014; Voineskos et al., Reference Voineskos, Lerch, Felsky, Shaikh, Rajji, Miranda and Kennedy2011), or completely dominant familial AD mutations (Ringman et al., Reference Ringman, O’Neill, Geschwind, Medina, Apostolova, Rodriguez and Bartzokis2007; Ryan et al., Reference Ryan, Keihaninejad, Shakespeare, Lehmann, Crutch, Malone and Fox2013). Other recent studies examined white matter changes in asymptomatic individuals showing biomarker evidence of amyloid or tau pathology (Bendlin et al., Reference Bendlin, Carlsson, Johnson, Zetterberg, Blennow, Willette and Sager2012; Chao et al., Reference Chao, Decarli, Kriger, Truran, Zhang, Laxamana and Weiner2013; Gold et al., Reference Gold, Zhu, Brown, Andersen, LaDu, Tai and Smith2014; Kantarci et al., Reference Kantarci, Schwarz, Reid, Przybelski, Lesnick, Zuk and Jack2014; Molinuevo et al., Reference Molinuevo, Ripolles, Simo, Llado, Olives, Balasa and Rami2014; Racine et al., Reference Racine, Adluru, Alexander, Christian, Okonkwo, Oh and Johnson2014; Stenset et al., Reference Stenset, Bjornerud, Fjell, Walhovd, Hofoss, Due-Tonnessen and Fladby2011). These cross-sectional studies of at-risk populations are now increasingly being complemented by longitudinal follow-up studies that allow relating the detected imaging abnormalities to future clinical outcomes (Douaud et al., Reference Douaud, Menke, Gass, Monsch, Rao, Whitcher and Smith2013; Fletcher et al., Reference Fletcher, Raman, Huebner, Liu, Mungas, Carmichael and DeCarli2013; Mielke et al., Reference Mielke, Okonkwo, Oishi, Mori, Tighe, Miller and Lyketsos2012; Teipel, Meindl, et al., Reference Teipel, Meindl, Wagner, Stieltjes, Reuter, Hauenstein and Hampel2010; Zhuang et al., Reference Zhuang, Sachdev, Trollor, Kochan, Reppermund, Brodaty and Wen2012). Together the findings converge on a pattern of microstructural white matter changes in AD that begin and are most severe in limbic tracts, including the fornix, uncinate fasciculus, and posterior and parahippocampal fibers of the cingulum, and sequentially extend to include more lateral temporoparietal association fibers, commissural fibers of the splenium, and finally long-ranging association tracts involving the frontal white matter. Importantly, first microstructural alterations of the limbic tracts were already detectable in presymptomatic subjects, years before they developed cognitive deficits and at a time the macrostructural gray matter volume was still widely preserved (Fletcher et al., Reference Fletcher, Raman, Huebner, Liu, Mungas, Carmichael and DeCarli2013; Ringman et al., Reference Ringman, O’Neill, Geschwind, Medina, Apostolova, Rodriguez and Bartzokis2007; Zhuang et al., Reference Zhuang, Sachdev, Trollor, Kochan, Reppermund, Brodaty and Wen2012).
In accordance with models of the representation of cognitive function across neuronal networks in the human brain, the clinical consequences of microstructural white matter changes were found to depend on the specific white matter tracts affected. Thus, disruptions of limbic fiber tracts, most notably the fornix and the parahippocampal white matter, show associations with impaired episodic memory function (Fellgiebel et al., Reference Fellgiebel, Schermuly, Gerhard, Keller, Albrecht, Weibrich and Stoeter2008; Huang & Auchus, Reference Huang and Auchus2007; Sexton et al., Reference Sexton, Mackay, Lonie, Bastin, Terriere, O’Carroll and Ebmeier2010), whereas executive function deficits appear to be more closely associated with fiber disruptions in long-ranging association tracts connected to the frontal lobe (Chen et al., Reference Chen, Chen, Cheng, Hua, Liu and Chiu2009; Grambaite et al., Reference Grambaite, Selnes, Reinvang, Aarsland, Hessen, Gjerstad and Fladby2011; Huang & Auchus, Reference Huang and Auchus2007). Of interest, memory performance in healthy elderly subjects was found to depend primarily on fornix integrity, whereas memory performance in MCI subjects showed greater dependence on parahippocampal white matter integrity (Metzler-Baddeley et al., Reference Metzler-Baddeley, Hunt, Jones, Leemans, Aggleton and O’Sullivan2012). This cognitive realignment from the more severely damaged fornix to the parahippocampal white matter in MCI was found to be beneficial for residual memory function in this condition and depended on a relatively spared structure of the basal forebrain cholinergic system, thought to be implicated in plastic brain responses (Ray et al., Reference Ray, Metzler-Baddeley, Khondoker, Grothe, Teipel, Wright and O’Sullivan2015).
While most studies focused on decreases in FA or increases in MD as scalar diffusion markers of microstructural white matter damage, simultaneous assessment of the full range of tensor-derived diffusion indices, including FA and MD, but also axial (aD) and radial (rD) diffusivities, and the MO, may provide more detailed information about the specifics of white matter degeneration in AD. Thus, in experimental studies on animal models increases in rD have been specifically associated with myelin degeneration, whereas changes in aD were more reflective of direct axonal damage (Song et al., Reference Song, Sun, Ju, Lin, Cross and Neufeld2003). In AD, the type of microstructural changes as reflected by the distinct diffusivity indices was found to differ between limbic, commissural, and association fiber tracts, indicating differing processes of tissue disruption among fiber populations (Huang et al., Reference Huang, Fan, Weiner, Martin-Cook, Xiao, Davis and Diaz-Arrastia2012). In general, increases in absolute diffusivities (i.e., MD, aD, and rD) were found to be more sensitive markers of AD-related white matter changes than decreases in FA, particularly in early and prodromal stages of the disease (Acosta-Cabronero, Williams, Pengas, & Nestor, Reference Acosta-Cabronero, Williams, Pengas and Nestor2010; Bosch et al., Reference Bosch, Arenaza-Urquijo, Rami, Sala-Llonch, Junque, Sole-Padulles and Bartres-Faz2012). The rather counterintuitive observation of relatively increased FA values along cortico-fugal and cortico-petal fiber tracts in AD and MCI (Douaud et al., Reference Douaud, Jbabdi, Behrens, Menke, Gass, Monsch and Smith2011) may likely be explained by the loss of intracortically projecting crossing fiber tracts, and hence a more linear shape of the resulting diffusion tensor, as has been illustrated by a parallel increase of FA and MO in motor related tracts (Douaud et al., Reference Douaud, Jbabdi, Behrens, Menke, Gass, Monsch and Smith2011; Teipel, Grothe, et al., Reference Teipel, Grothe, Filippi, Fellgiebel, Dyrba, Frisoni and group2014).
In addition to the regional analysis of scalar diffusion indices, complementary information on structural network organization can be obtained from the graph theoretical analysis of individual whole-brain connectivity networks derived from tractography-based reconstructions. In AD dementia, structural connectivity networks exhibit altered topological network metrics, such as increased shortest path lengths, decreased local and global efficiency, and decreased number of rich-club hub nodes (Daianu et al., Reference Daianu, Dennis, Jahanshad, Nir, Toga, Jack and Thompson2013, Reference Daianu, Jahanshad, Nir, Jack, Weiner, Bernstein and Thompson2015; Lo et al., Reference Lo, Wang, Chou, Wang, He and Lin2010; Shao et al., Reference Shao, Myers, Yang, Feng, Plant, Bohm and Sorg2012). These topological network changes were also shown to account for core memory and executive function deficits (Reijmer et al., Reference Reijmer, Leemans, Caeyenberghs, Heringa, Koek and Biessels2013), and were already detectable in cognitively normal individuals with high amyloid burden (Fischer, Wolf, Scheurich, & Fellgiebel, Reference Fischer, Wolf, Scheurich and Fellgiebel2015) and asymptomatic APOE4 carriers (Brown et al., Reference Brown, Terashima, Burggren, Ercoli, Miller, Small and Bookheimer2011). However, current DTI-based fiber tracking algorithms are limited in their ability to resolve crossing and touching fiber bundles, which are highly prevalent fiber configurations in the human white matter (Jeurissen, Leemans, Tournier, Jones, & Sijbers, Reference Jeurissen, Leemans, Tournier, Jones and Sijbers2013). Recently developed model free reconstruction techniques based on high angular resolution diffusion data or diffusion spectrum imaging allow a more accurate reconstruction of crossing fiber tracts (Dell’Acqua & Catani, Reference Dell’Acqua and Catani2012; Wedeen et al., Reference Wedeen, Wang, Schmahmann, Benner, Tseng, Dai and de Crespigny2008), and may be used in the future to study age- and AD-related structural connectivity changes in greater detail (Reijmer et al., Reference Reijmer, Leemans, Heringa, Wielaard, Jeurissen, Koek and Biessels2012; Teipel, Lerche, et al., Reference Teipel, Lerche, Kilimann, O’Brien, Grothe, Meyer and Hauenstein2014).
Multimodal Imaging of Structural and Functional Connectivity Changes
Multimodal brain connectome approaches using both rs-fMRI and DTI could provide exciting new insights on structure-function relationships and how these are affected by disease. In health, the presence of a direct fiber connection is almost always correlated with functional connectivity in the corresponding brain regions (Damoiseaux & Greicius, Reference Damoiseaux and Greicius2009). However, the presence of functional connectivity between distinct brain regions is not necessarily suggesting the presence of a direct fiber connection, and the dependence on direct structural connections between network nodes varies among the different large-scale functional networks (Horn, Ostwald, Reisert, & Blankenburg, Reference Horn, Ostwald, Reisert and Blankenburg2014). Table 1 lists key studies on combined fMRI and DTI in AD. Within the DMN it has been found that functional connectivity strength is largely predefined by the structural integrity of fiber tracts connecting the key nodes of this network, that is, the dorsal cingulum bundle connecting medial frontal and parietal nodes, and the ventral/parahippocampal cingulum connecting the posterior cingulate with the medial temporal lobe (Greicius, Supekar, Menon, & Dougherty, Reference Greicius, Supekar, Menon and Dougherty2009; Teipel, Bodke, et al., 2010; van den Heuvel, Mandl, Luigjes, & Hulshoff Pol, Reference van den Heuvel, Mandl, Luigjes and Hulshoff Pol2008). Accordingly, the functional disconnection of the DMN in MCI and AD is paralleled by a declining integrity of these underlying fiber tracts (Hahn et al., Reference Hahn, Myers, Prigarin, Rodenacker, Kurz, Forstl and Sorg2013; Soldner et al., Reference Soldner, Meindl, Koch, Bokde, Reiser, Moller and Teipel2012; Weiler et al., Reference Weiler, de Campos, Nogueira, Pereira Damasceno, Cendes and Balthazar2014). Similarly, working memory related network breakdown occurred along structurally defined networks when evaluated using task fMRI and DTI in healthy aging and MCI individuals (Teipel et al., Reference Teipel, Ehlers, Erbe, Holzmann, Lau, Hauenstein and Berger2015). Further evidence for a close relation between white matter degeneration and cortical dysfunction in aging and AD comes also from studies showing distinct associations between decreasing fiber integrity and declining regional hypometabolism in connected cortical areas (Bozoki, Korolev, Davis, Hoisington, &, Berger, Reference Bozoki, Korolev, Davis, Hoisington and Berger2012; Cross et al., Reference Cross, Anzai, Petrie, Martin, Richards, Maravilla and Minoshima2013; Glodzik et al., Reference Glodzik, Kuceyeski, Rusinek, Tsui, Mosconi, Li and de Leon2014; Kuczynski et al., Reference Kuczynski, Targan, Madison, Weiner, Zhang, Reed and Jagust2010; Villain et al., Reference Villain, Fouquet, Baron, Mezenge, Landeau, de La Sayette and Chetelat2010). Of interest, a recent multimodal MRI study found that integrity of the fornix was positively correlated with hippocampal-thalamic functional connectivity strength in normally aging subjects, but not in subjects with MCI, indicating that pathologic aging processes may alter the relationship between functional and structural connectivity characteristics within specific brain systems (Kehoe et al., Reference Kehoe, Farrell, Metzler-Baddeley, Lawlor, Kenny, Lyons and Bokde2015).
Table 1 Multimodal imaging studies relevant for AD

Finally, combined assessment of structural and functional abnormalities in asymptomatic young adult and middle-aged APOE4 carriers indicated that abnormalities in functional network communication may precede the breakdown of structural white matter connections in the pathogenesis of AD (Matura et al., Reference Matura, Prvulovic, Jurcoane, Hartmann, Miller, Scheibe and Pantel2014; Patel et al., Reference Patel, Stevens, Pearlson, Winkler, Hawkins, Skudlarski and Bauer2013). However, other studies in asymptomatic APOE4 carriers have found parallel decreases in functional and structural connectivity (Heise et al., Reference Heise, Filippini, Trachtenberg, Suri, Ebmeier and Mackay2014) or even more pronounced structural network changes (Chen et al., Reference Chen, Chen, Zhang, Li, Shu, Wang and Reiman2014). Longitudinal studies using multimodal imaging assessments are needed to provide more detail on the specific sequence of structural and functional connectivity alterations in the course from presymptomatic to clinically manifest AD.
Multimodal Imaging of Regional Distribution and Progression Patterns of Pathologic Alterations on the Basis of the Brain’s Connectivity Architecture: MRI, fMRI, and PET
Besides its utility in studying functional and structural connectivity alterations in the course of normal and pathological aging, connectivity information from rs-fMRI and DTI may also be used to study the underlying mechanism of the distinct regional distribution and progression patterns of pathologic alterations in AD and other neurodegenerative dementias. Thus, different neurodegenerative dementia forms, such as AD, frontotemporal dementia, or semantic dementia, are not only characterized by distinct clinical presentations, but also by different patterns of regional brain atrophy, which show only partial overlap or no overlap at all between dementia syndromes in the early clinical stages. Using functional connectivity information from healthy individuals, it could be demonstrated that the specific atrophy patterns observed in distinct neurodegenerative diseases resemble specific functional connectivity networks in the human brain, which largely correspond to the respective clinical presentation (Seeley et al., Reference Seeley, Crawford, Zhou, Miller and Greicius2009; Zhou et al., Reference Zhou, Gennatas, Kramer, Miller and Seeley2012). Intriguingly, one recent study assessed functional connectivity patterns of the most atrophic regions in three distinct clinical variants of AD, namely early-onset AD, logopenic aphasia, and posterior cortical atrophy. In accordance with the syndrome-specific clinical presentations, they found that the functional connectivity pattern of the most atrophic region in early-onset AD resembled anterior salience and right executive-control networks, in logopenic aphasia it resembled the language network, and the functional connectivity pattern of the most atrophic region in posterior cortical atrophy corresponded to the higher visual network. These findings suggest that, although degeneration in AD dementia generally targets the DMN, deviations from the typical regional atrophy pattern in the form of syndrome-specific neurodegenerative variants are driven by the involvement of specific networks outside the DMN (Lehmann et al., Reference Lehmann, Madison, Ghosh, Seeley, Mormino, Greicius and Rabinovici2013).
Information about the functional and structural connectivity architecture of the healthy human brain has also been used to construct predictive models of the regional distribution of pathologic changes in AD and other neurodegenerative dementias. Table 1 lists key studies on fMRI and DTI together with molecular imaging modalities. A region’s total amount of functional connections with other regions in the healthy brain (i.e., its “functional hub” character) was shown to be predictive of the regional amount of amyloid accumulation in AD as measured with amyloid-sensitive PET imaging (Buckner et al., Reference Buckner, Sepulcre, Talukdar, Krienen, Liu, Hedden and Johnson2009; Myers et al., Reference Myers, Pasquini, Gottler, Grimmer, Koch, Ortner and Sorg2014). Moreover, an “epidemic spreading model” that considered axonal propagation of amyloid proteins along the healthy structural connectome in combination with regional clearance mechanisms was able to explain approximately 50% of the variance in real amyloid deposition patterns as observed by amyloid-sensitive PET (Iturria-Medina, Sotero, Toussaint, & Evans, Reference Iturria-Medina, Sotero, Toussaint and Evans2014). Thus, this model strongly supports the hypothesis that regional amyloid deposition likelihood is explained to a large extent by the effective (i.e., connectional) anatomical distance from specific outbreak regions estimated to lie in the anterior and posterior cingulate cortex. Similar approaches have also been used to successfully predict regional atrophy severity and progression of atrophy based on structural (Crossley et al., Reference Crossley, Mechelli, Scott, Carletti, Fox, McGuire and Bullmore2014; Raj et al., Reference Raj, Kuceyeski and Weiner2012, Reference Raj, LoCastro, Kuceyeski, Tosun, Relkin and Weiner2015) and functional (Zhou et al., Reference Zhou, Gennatas, Kramer, Miller and Seeley2012) connectomic brain features, such as a region’s total connectivity in the healthy brain or the connectional (rather than Euclidean) distance of this region to the site where atrophy first manifests.
These data provide first evidence in humans for hypotheses on molecular disease mechanisms derived from preclinical studies, including increased vulnerability of highly connected network hubs due to increased amyloid accumulation and oxidative stress (Cirrito et al., Reference Cirrito, Yamada, Finn, Sloviter, Bales, May and Holtzman2005; Spires-Jones & Hyman, Reference Spires-Jones and Hyman2014), or prion-like spread of pathogenic protein conformations (such as misfolded tau and amyloid proteins) along synaptic connections (Ahmed et al., Reference Ahmed, Cooper, Murray, Garn, McNaughton, Clarke and O’Neill2014; Braak & Del Tredici, Reference Braak and Del Tredici2011; Nath et al., Reference Nath, Agholme, Kurudenkandy, Granseth, Marcusson and Hallbeck2012).
Multimodal Imaging of Brain Connectivity Measurements: Resting State EEG Rhythms, MRI, FDG-PET, and rs-fMRI Activity
It is well-known that low spatial resolution (centimeters) of the electroencephalography (EEG) techniques prevents a reliable and precise spatial estimation of the cortical sources and of the functional coupling of the EEG rhythms. On the other hand, rs-fMRI has an insufficient temporal resolution (seconds) for the study of the brain rhythms but a very high spatial resolution (millimeters). For this reason, the combination of the EEG and fMRI techniques has been performed in the past years to exploit the information contents of both methodologies. In this line, several multi-modal studies have investigated the correlation between EEG rhythms in the resting state and low-frequency (approximately 0.1 Hz) fluctuations of the blood oxygenation signal (BOLD) in healthy subjects, showing that these fluctuations are temporally correlated across large-scale distributed networks. In the resting-state eyes-closed condition, some studies have reported a positive correlation between the alpha power and the BOLD signal time series in the DMN (Mantini, Perrucci, Del Gratta, Romani, & Corbetta, Reference Mantini, Perrucci, Del Gratta, Romani and Corbetta2007). Other evidence pointed to negative or mixed correlations (Goncalves et al., Reference Goncalves, de Munck, Pouwels, Schoonhoven, Kuijer, Maurits and Lopes da Silva2006; Laufs et al., Reference Laufs, Krakow, Sterzer, Eger, Beyerle, Salek-Haddadi and Kleinschmidt2003). In contrast, the alpha power was negatively correlated with activity in the Dorsal Attention Network (DAN) during the resting state condition (Laufs et al., Reference Laufs, Krakow, Sterzer, Eger, Beyerle, Salek-Haddadi and Kleinschmidt2003; Mantini et al., Reference Mantini, Perrucci, Del Gratta, Romani and Corbetta2007; Sadaghiani et al., Reference Sadaghiani, Scheeringa, Lehongre, Morillon, Giraud and Kleinschmidt2010). This is a set of control regions recruited during goal-driven behavior and perceptual selection (Corbetta & Shulman, Reference Corbetta and Shulman2002). The same negative correlation is observed between the alpha power and the ventral fronto-parietal cortical network (VAN; Corbetta & Shulman, Reference Corbetta and Shulman2002). Finally, the resting state alpha power also correlated to BOLD activity in a cingulo-insular-thalamic subnetwork of the VAN, the so-called Salience network (Goncalves et al., Reference Goncalves, de Munck, Pouwels, Schoonhoven, Kuijer, Maurits and Lopes da Silva2006; Sadaghiani et al., Reference Sadaghiani, Scheeringa, Lehongre, Morillon, Giraud and Kleinschmidt2010).
Correlation between the resting state EEG power and the brain BOLD activity was not limited to alpha rhythms. It has been shown that the power of several EEG bands (i.e., delta, theta, alpha, beta, and gamma) correlated to fMRI time courses within the resting state networks identified by the use of independent component analysis (Mantini et al., Reference Mantini, Perrucci, Del Gratta, Romani and Corbetta2007). Analogously to the alpha power, the beta power was positively correlated to the BOLD activity in the DMN and self-referential networks, and was negatively correlated with the BOLD activity observed in the DAN (Mantini et al., Reference Mantini, Perrucci, Del Gratta, Romani and Corbetta2007).
The correlation between the resting state alpha power and the BOLD signal in the DMN and attentional networks unveils the functional role of brain EEG oscillatory activity for the functional connectivity and neurotransmission within long-range cortical networks, as a possible basis of the regulation of spontaneous cortical arousal in wakefulness (Fox et al., Reference Fox, Snyder, Vincent, Corbetta, Van Essen and Raichle2005). Keeping in mind these data, we think that the study of correlation between the resting state alpha power and the BOLD signal in the DMN, DAN, and VAN represent a new avenue for a better understanding of the clinical neurophysiology of AD patients and for the definition and validation of instrumental markers for diagnostic, prognostic, and therapy monitoring purposes.
Another important avenue is the study of the relationship between resting state EEG rhythms and structural MRI markers of AD neurodegeneration co-registered in the same anatomical space. For this purpose, a promising approach is the estimation of the cortical sources of the resting state EEG rhythms by low-resolution brain electromagnetic tomography (LORETA) (http://www.uzh.ch/keyinst/loreta.htm). With this goal in mind, LORETA has been repeatedly used to study cortical sources of the resting state EEG rhythms in MCI and AD subjects (Figure 3). In these studies, occipital sources of the resting state alpha rhythms were the most promising EEG marker of prodromal AD in MCI subjects. Specifically, the magnitude of occipital sources of alpha rhythms was related to MRI markers including white matter lesions and atrophy of the hippocampal and global cortical gray matter in MCI and AD subjects (Babiloni et al., Reference Babiloni, Carducci, Lizio, Vecchio, Baglieri, Bernardini and Frisoni2013, Reference Babiloni, Del Percio, Boccardi, Lizio, Lopez, Carducci and Frisoni2015; Babiloni, Ferri, et al., Reference Babiloni, Ferri, Binetti, Vecchio, Frisoni, Lanuzza and Rossini2009; Babiloni et al., Reference Babiloni, Frisoni, Steriade, Bresciani, Binetti, Del Percio and Rossini2006; Babiloni, Frisoni, et al., Reference Babiloni, Frisoni, Pievani, Vecchio, Lizio, Buttiglione and Rossini2009; Babiloni, Pievani, et al., Reference Babiloni, Pievani, Vecchio, Geroldi, Eusebi, Fracassi and Frisoni2009). Further evidence for a close relation between white matter degeneration and cortical dysfunction in aging and AD comes also from studies showing distinct associations between decreasing fiber integrity and declining trans-hemispheric coherence in resting-state EEG rhythms (Teipel et al., Reference Teipel, Pogarell, Meindl, Dietrich, Sydykova, Hunklinger and Hampel2009). Key studies on EEG combined with other imaging modalities are listed in Table 1.

Fig. 3 Overview of EEG spectral analysis. Several EEG techniques use brain electrical activity recorded during spontaneous fluctuations of vigilance in the resting state eyes closed condition to analyze functional synchronization and functional coupling of cortical neural activity in normal elderly subjects and patients with Alzheimer’s disease (AD). On the whole, four main methodological stages can be recognized: (I) EEG recordings, typically from 19 scalp electrodes placed according to 10–20 system. This is the typical electrode montage used in clinical context. A low spatial sampling of EEG signals is allowed when the spatial frequency of EEG activity is relatively low as in the condition of resting state eyes-closed condition. (II) Preliminary EEG data analysis is a procedure aimed at selecting artifact-free EEG segments to be used for further analysis. In some cases, artifacts in the EEG segments can be corrected by mathematical procedures (e.g., correction of blinking artifacts). (III) Spectral EEG analysis is a procedure to compute EEG power spectra at scalp electrodes. This procedure aims at evaluating the general quality of EEG segments selected for the final analysis. In the case of healthy elderly subjects the EEG power spectra of posterior electrodes is dominated by a main peak of power density around 8–10 Hz. Power density at frequency lower than 4–6 Hz is typically higher in amplitude in the frontal than in the posterior electrodes. (IV) Cortical sources of resting state eyes closed EEG rhythms (free from artifacts) are typically estimated and compared among groups of healthy elderly subjects and patients with mild cognitive impairment and AD. For this purpose, a promising approach is the estimation of EEG cortical sources by low-resolution brain electromagnetic tomography (LORETA) (http://www.uzh.ch/keyinst/loreta.htm). These four basic stages are displayed in the figure.
Contribution of Multimodal Imaging of Connectivity to Diagnostic Accuracy in AD: fMRI and DTI
First studies used the critical role of intrinsic functional connectivity in AD’s pathophysiology to apply rs-fMRI and functional connectivity in a diagnostic context. In general, due to low signal-to-noise ratio and its non-quantitative nature, fMRI signal (i.e., the BOLD signal) is highly problematic for individual reliable diagnostics (Fox & Greicius, Reference Fox and Greicius2010). Quantitative BOLD imaging and new data acquisition techniques producing massively more data in comparable time to increase the power of data analysis (e.g., multi-band fMRI) might be helpful for future approaches (Smith et al., Reference Smith, Beckmann, Andersson, Auerbach, Bijsterbosch, Douaud and Glasser2013). Furthermore, detection of individual intrinsic functional connectivity might be confounded by systematic center and scanner effects. For example Biswal and colleagues demonstrated significant center effects on ongoing BOLD activity and coherence in a huge sample of more than 1400 subjects collected across 35 centers (Biswal et al., Reference Biswal, Mennes, Zuo, Gohel, Kelly, Smith and Milham2010). The authors identified several factors which underlie such center effects and which have to be carefully controlled for across subject and center comparisons in a diagnostic context, including scanner type, sequence specifications, instructions to participants, and degree of participant’s wakefulness. Finally, since intrinsic functional connectivity reflects individual wakefulness and ongoing cognitive activity such as mind wandering (Mason et al., Reference Mason, Norton, Van Horn, Wegner, Grafton and Macrae2007), intra-individual reliability and consistency of rs-fMRI–based diagnostic markers is a challenge (Damoiseaux et al., Reference Damoiseaux, Rombouts, Barkhof, Scheltens, Stam, Smith and Beckmann2006; Patriat et al., Reference Patriat, Molloy, Meier, Kirk, Nair, Meyerand and Birn2013). Nevertheless, some studies demonstrated acceptable diagnostic potential of resting-state functional connectivity maps. For example, independently from each other Dyrba and colleagues and Wee and colleagues demonstrated that pattern classification of individual functional connectivity matrices of whole brain connectivity separates patients with AD or MCI from healthy controls with accuracy and specificity rates of approximately 70% (Dyrba, Grothe, Kirste, & Teipel, Reference Dyrba, Grothe, Kirste and Teipel2015; Wee et al., Reference Wee, Yap, Zhang, Denny, Browndyke, Potter and Shen2012). However, both studies also found that combining functional und structural connectivity (based on DTI data) substantially increases these rates above 90%, suggesting that multimodal connectivity measures might help in future diagnostic approaches.
The diagnostic use of DTI has been assessed in few studies so far. In monocenter studies, the separation of AD patients from healthy controls as well as MCI converters from healthy controls reached 80% to 90% accuracy using FA or MD maps in multivariate analysis based on principal component analysis (Friese et al., Reference Friese, Meindl, Herpertz, Reiser, Hampel and Teipel2010), or support vector machine classification (Grana et al., Reference Grana, Termenon, Savio, Gonzalez-Pinto, Echeveste, Perez and Besga2011; O’Dwyer et al., Reference O’Dwyer, Lamberton, Bokde, Ewers, Faluyi, Tanner and Hampel2012; Shao et al., Reference Shao, Myers, Yang, Feng, Plant, Bohm and Sorg2012).
Regional diffusion measures of white matter integrity, most notably of the fornix, posterior cingulum, and parahippocampal white matter, have also shown promising accuracies between 77% and 95% for the prediction of conversion from MCI to AD dementia over clinical follow-up times of 2 to 3 years (Douaud et al., Reference Douaud, Menke, Gass, Monsch, Rao, Whitcher and Smith2013; Mielke et al., Reference Mielke, Okonkwo, Oishi, Mori, Tighe, Miller and Lyketsos2012; Scola et al., Reference Scola, Bozzali, Agosta, Magnani, Franceschi, Sormani and Falini2010; Selnes et al., Reference Selnes, Aarsland, Bjornerud, Gjerstad, Wallin, Hessen and Fladby2013). Preliminary findings further suggest that MD may be of higher predictive value compared to FA (Douaud et al., Reference Douaud, Menke, Gass, Monsch, Rao, Whitcher and Smith2013), and that diffusion metrics may be generally better predictors of conversion than volumetric measurements on structural MRI (Fellgiebel et al., Reference Fellgiebel, Dellani, Greverus, Scheurich, Stoeter and Muller2006; Scola et al., Reference Scola, Bozzali, Agosta, Magnani, Franceschi, Sormani and Falini2010), particularly for the prediction of future cognitive impairments in cognitively normal elderly (Fletcher et al., Reference Fletcher, Raman, Huebner, Liu, Mungas, Carmichael and DeCarli2013; Zhuang et al., Reference Zhuang, Sachdev, Trollor, Kochan, Reppermund, Brodaty and Wen2012). However, these first monocentric studies are generally limited by relatively small sample sizes, and diagnostic and prognostic findings within the highly controlled experimental conditions of these studies, such as uniform DTI acquisition protocols and selected patient populations, will probably not translate seamlessly into the broader clinical context.
Only recently, multicenter acquisition and analysis of DTI data have begun to be explored in the framework of the European DTI Study on Dementia (EDSD) (Teipel, Reuter, et al., Reference Teipel, Reuter, Stieltjes, Acosta-Cabronero, Ernemann, Fellgiebel and Hampel2011). Using a physical and clinical phantom study, the EDSD showed an at least 50% increase of between scanner variability compared to anatomical MRI acquisitions (Teipel, Reuter, et al., Reference Teipel, Reuter, Stieltjes, Acosta-Cabronero, Ernemann, Fellgiebel and Hampel2011). Diagnostic accuracy for the comparison of AD versus controls yielded only 70% accuracy using univariate voxel-based meta-analysis (Teipel et al., Reference Teipel, Wegrzyn, Meindl, Frisoni, Bokde, Fellgiebel and Ewers2012) or posterior cingulate tractography (Fischer et al., Reference Fischer, Scheurich, Wegrzyn, Schermuly, Bokde, Kloppel and Fellgiebel2012), but was increased to more than 80% accuracy using support vector machine analysis (Dyrba et al., Reference Dyrba, Ewers, Wegrzyn, Kilimann, Plant, Oswald and Teipel2013). The more relevant discrimination of prodromal MCI individuals from healthy controls and biomarker negative MCI individuals was more accurate using FA and MD measures from DTI in a machine learning framework than using gray matter and white matter volume, but yielded only approximately 70% accuracy (Dyrba, Barkhof, et al., Reference Dyrba, Barkhof, Fellgiebel, Filippi, Hausner, Hauenstein and Teipel2015). The clinically most relevant question of predicting short to mid-term conversion within a group of MCI subjects recruited from multiple centers is presently being explored in the EDSD framework.
Summary
„Κάλχας Θεστορίδης οἰωνοπόλων ὄχ᾽ ἄριστος, ὃς ᾔδη τά τ᾽ ἐόντα τά τ᾽ ἐσσόμενα πρό τ᾽ ἐόντα,”
“Calchas son of Thestor, far the best of bird-diviners, who knew the things that were, and that were to be, and that had been before,”
Iliad, first book, lines 69/70
In the Iliad, the seer Calchas is the one who knows what is (the present), what will be (the future), and what was before him (the past). The previous sections have shown that what was characteristic for the most well-known seer of old days characterizes the potential utility of neuroimaging markers today. Measures of structural and functional connectivity help to resolve the three major challenges that are important for diagnosing and managing disease today as they were important for the Mycenaean Greeks when they sieged the city of Troy:
-
1. Looking into the past: structural and functional connectivity changes can explain how an endophenotype of molecular pathological changes, such as cortical amyloid and tau accumulation, has built up in an individual brain. The hub characteristics of a brain region and the degree of their functional connectivity and structural integration explain why certain brain networks are more vulnerable than others to brain diseases such as AD.
-
2. Understanding the presence: the presence of a certain disease stage, such as predementia or dementia AD, can diagnostically be detected using measures of structural and functional connectivity with reasonable accuracy in highly selected patient samples. In addition, recent evidence from multicenter data suggests that structural imaging methods may be robust diagnostic markers in the context of less controlled clinical samples as well.
-
3. Predicting the future: the most important task in clinical prognosis is to predict what will come next. This task has two aspects. First, for clinical prediction, measures of structural and functional connectivity need further exploration in large scale multicenter studies. Preliminary evidence from such studies suggests that measures of structural connectivity may be less accurate than classical measures of regional brain atrophy in predicting individual progression from MCI to AD dementia (Brüggen et al., in revision). Similar data from fMRI are still widely lacking. Resolving this question will provide guidance if these measures will usefully be used in the selection of individuals into clinical trials on prevention strategies geared toward a specific molecular pathogenic mechanism of disease or will become relevant for individual prognosis of disease progression in MCI individuals in tertiary and primary care settings.
Second, for predicting the spread of molecular or functional lesions of disease throughout the brain, the hub characteristics of a region could be used to predict the likelihood of a region to accumulate amyloid or tau pathology in the further course of the disease. Thus, the spread of a molecular event, such as amyloid accumulation, can be predicted with moderate accuracy on a group level, but is still unresolved for an individual brain based on its network connectivity features. If this observation, however, is found to be robust in larger and more heterogeneous samples this would help to bridge the gap between molecular brain changes and clinical phenotype on the syndromal or even on the symptomatological level.
Several issues remain to be addressed: What will be the role of functional and structural brain connectivity in the light of international diagnostic guidelines? Summarizing, the current model of typical (i.e., most frequent) presentation of AD assumes that brain amyloidosis biomarkers (i.e., abnormal tracer retention on amyloid PET imaging and low Aβ42 concentration in the CSF) turn abnormal earliest, and are diagnostic biomarkers of AD when associated to episodic memory deficits as revealed by neuropsychological tests (Jack et al., Reference Jack, Knopman, Jagust, Shaw, Aisen, Weiner and Trojanowski2010). During the evolution of the disease, this picture would be followed by cortical and hippocampal hypometabolism (FDG-PET), and finally by massive neuronal loss (i.e., brain atrophy on structural MRI). In this line, an International Working Group [IWG, (Dubois et al., Reference Dubois, Feldman, Jacova, Hampel, Molinuevo, Blennow and Cummings2014)] differentiated clinical phenotypes of AD and mixed AD, and proposed to distinguish clinical use of diagnostic (CSF and ligand PET of Aβ42 and tau brain accumulation) from disease tracking (MRI, FDG-PET) biomarkers. The systematic collection and analysis of multicenter multimodal imaging data including biomarkers of functional and structural cortical connectivity are an indispensable requirement for the future assessment of the diagnostic, prognostic, monitoring, and therapy response accuracy of these markers, both for clinical trials as well as health care applications, such as a radiological expert system. This also involves the analysis of the robustness or vulnerability of the markers to degrading image quality or varying numbers of available imaging modalities. Systematic studies need to explore the minimum image quality and data dimensions that still yield diagnostically useful information for an individual subject.
In addition, in a turn of the perspective, the functional and structural connectivity properties of an individual brain may help to predict what will be the likelihood for an individual at a given level of molecular brain lesions to remain cognitive stable over 2 to 3 years. The positive predictive value of a significant cortical amyloid accumulation in cognitively intact persons is approximately 25% for subsequent development of cognitive symptoms over 3 years (Villemagne et al., Reference Villemagne, Pike, Chetelat, Ellis, Mulligan, Bourgeat and Rowe2011); this points to mechanisms of cerebral reserve as an important factor for the individual resistance to brain lesions. As the associations between education and brain structural and functional connectivity suggest, the degree of structural and functional connectivity may be an important proxy of brain reserve. The assessment of these markers in combination with the detection of molecular lesions will help to stratify predementia and preclinical individuals into high risk versus low risk cohorts for the development of cognitive symptoms, an important requirement for future primary prevention clinical studies.
In summary, future work in clinical dementia research needs to close the growing gap between advances in imaging technology on the one hand, and stagnation in the development of efficient treatments. Particularly, the novel view on mechanisms of brain resilience in healthy and pathological aging may help to open new avenues for treatment evaluations beyond classical monocausal interventions against a single suspected key molecular event. The development of multimodal individualized treatments, including medication management, cholinergic treatment, as well as stage specific cognitive training and rehabilitation will contribute to mitigate the course of manifest and predementia stages of AD. Individual primary prevention will also gain from the strengthening of individual reserve capacity where the intensity, frequency, and type of intervention may be selected based on the network properties of an individual brain as a proxy for the risk to yield or resist a given level of molecular lesions.
Acknowledgments
The present review was developed and granted in the framework of the following projects: “SinDem” (German Ministry of Research, BMBF, 16SV7091), “AgeGain” (German Ministry of Research, BMBF), “GRIDCORE” (Italian Ministry of Health, RF-2010-2319113) and “CONNAGE” (Italian Ministry of University and Technological Research, PRIN2010-2011, prot. 2010SH7H3F). There are no conflicts of interest related to this manuscript.


