1. Introduction
Sea ice has an intricate structure, consisting primarily of an ice matrix with inclusions of air and brine. The salinity of sea ice is between that of fresh water and sea water (Reference DingDing, 1999; Reference WadhamsWadhams, 2000), so sea-ice desalination potentially represents a new type of sea-water desalination (Reference GuGu and others, 2012).
When ambient temperature drops below the freezing point, surface sea water gradually freezes and forms sea ice. This process leads to the exclusion of some salt, resulting in a lower salinity than that of sea water (Reference GuGu and others, 2012). Generally, the salinity of sea ice is only 1/4 to 1/6 that of sea water. After sea ice forms, it can be transported, stored in a suitable place (i.e. a desalination pool) and exploited. Because they have a lower melting point, inclusions of brine trapped among the ice crystals can connect and form vertical and lateral channels in response to temperature fluctuations and gravity (Reference GuGu and others, 2012). As a result, under natural conditions, sea ice will transition into low-salinity ice or even fresh water. The drainage of brine from sea ice in a desalination pool, termed the gravitational desalination of sea ice, is a low-energy-consumption process (Reference GuGu and others, 2012). Using gravitational desalination, water derived from large quantities of Bohai Sea (China) ice can be utilized for agricultural, industrial and domestic purposes, thereby alleviating water shortage in the Bohai Rim (Reference Shi, Gu, Xie, Yuan and JingShi and others, 2003). Sea-ice desalination is a systematic engineering process that includes estimation of the available volume of ice, the collection of sea ice and the desalination of stored ice. Of these, the estimation of sea-ice volume is an important step and is a precondition for sea-ice desalination. The general concept of a sea-ice resource includes the amount and quality of the resource (Reference YuanYuan, 2009). The amount is the primary focus in the present study. We estimate the amount of sea-ice resource by measuring sea-ice volume.
The Bohai Sea is a gulf of the Yellow Sea surrounded by the provinces of Liaoning, Hebei and Shandong and the municipality of Tianjin, connected to the Yellow Sea along its eastern side. The geographical extent of the Bohai Sea is 37°07′–41°00′ N, 117835–122°15′ E (Fig. 1; NGDCNH, 2011).

Fig. 1. Schematic of the zone division for the zonal threshold method.
First-year sea ice can form in the Bohai Sea from December to mid-March (Reference YangYang, 2000). Sea ice in the Bohai Sea is mostly deformed, especially during the glacial maximum. The thickness of floe ice offshore is on the order of tens of centimetres, but the height of landfast ice can reach several metres (Reference YangYang, 2000). Landfast ice generally extends a few kilometres out from the coast in Liaodong Bay and Bohai Bay, but can extend up to 30 km offshore in Laizhou Bay (Reference YangYang, 2000). In general, the amount of winter snowfall in the Bohai Sea is small. Because of the wind and current, snow cover is rare on the sea ice. If snowfall does occur, it accumulates only a few centimetres. Sea ice in the Bohai Sea is very dynamic, and the velocity of floe ice is usually >1 ms−1 (Reference YangYang, 2000). Melting of the sea ice will also affect its thickness and area.
Ice formation in the Bohai Sea is closely related to seawater density, salinity, turbulence and the freezing nucleus, as well as air temperature, water depth and the geographical environment. Additionally, due to winter winds and currents, sea ice in the Bohai Sea moves away from the location at which it formed. Therefore, its volume is unevenly distributed in both time and space. The spatio-temporal characteristics of the sea-ice distribution affect the cost of sea-ice desalination, which warrants the investigation of these characteristics. To this end, scholars have studied negative accumulated temperature and its effect on sea-ice distribution in the northern Yellow Sea and the Bohai Sea. The results indicate that the air accumulated temperatures corresponding to –4°C or lower, which are related to the formation of sea ice, vary more from south to north than from east to west (Reference Gu, Shi, Liu, Xie and CaiGu and others, 2002). The spatio-temporal characteristics of the distribution of sea-ice volume in Liaodong Bay (Reference Shi, Gu, Xie, Yuan and JingShi and others, 2003) and in the Bohai Sea from 1987 to 2009 have also been investigated (Reference YuanYuan, 2009). Those results showed that the maximum sea-ice volume in the Bohai Sea during that period was 3.0 × 10⁹m3, in the average winter of 1999/2000. They also showed that the largest volume of available sea ice was distributed in the eastern section of Liaodong Bay in the regions between Yingkou and Xiongyue and the western section of Xingcheng, making up 30–50% of the total sea-ice volume in Liaodong Bay (Reference Shi, Gu, Xie, Yuan and JingShi and others, 2003). The annual variation in sea-ice volume in the Bohai Sea is drastic and the spatial distribution uneven (Reference YuanYuan, 2009). It is notable that >50% of sea-ice volume in the Bohai Sea has occurred in Liaodong Bay in every winter from 1987 to 2009 (Reference YuanYuan, 2009).
The 2009/10 winter was a severe ice winter in the Bohai Sea, resulting in a great increase in sea-ice volume. In Liaodong Bay, the freezing date was 17 December 2009 and the break-up date was 19 March 2010, the earliest freezing and latest break-up dates in the Bohai Sea. We estimated the sea-ice volume of the Bohai Sea in winter 2009/10 from US National Oceanic and Atmospheric Administration (NOAA) remote-sensing images and a model based on shortwave radiation theory. On this basis, the spatio-temporal characteristics of sea-ice volume in the Bohai Sea during a severe ice winter were analysed using GIS software to provide meaningful references for the exploitation and utilization of sea ice.
2. Data and Methods
2.1. Data description
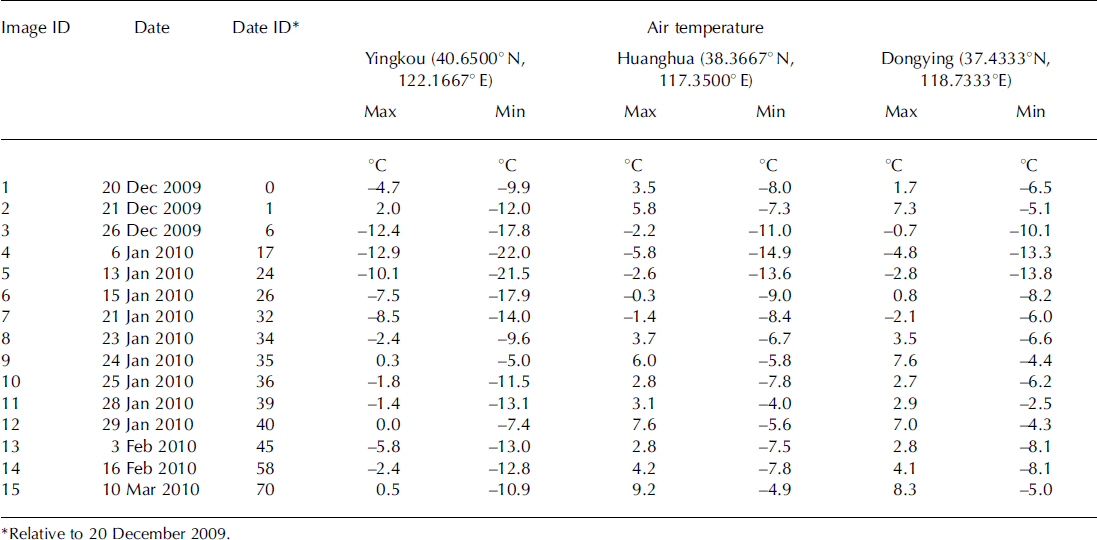
The satellite images used were from the NOAA database of Tokyo University, Japan. They were obtained by the Advanced Very High Resolution Radiometer (AVHRR) sensor on board the NOAA-17 satellite. Of the images captured from mid-December 2009 to mid-March 2010, 15 were ultimately selected, representing times of day between 11:00 and 13:00 (Table 1), after removing poor-quality and snow-covered (only one image) images and those with >10% cloud cover. The air temperatures recorded by meteorological stations near the Bohai Sea coast are also listed in Table 1. The AVHRR images cover the area 36–42°N, 116–124°E, with 800 samples, 600 scan lines, and a spatial resolution of 1100 m. Atmospheric and geometric corrections were conducted using PaNDA (Package for NOAA Data Analysis), which was developed in 1989 by Japanese scientists. It includes format conversion, radiometric correction, atmospheric correction and geometric correction of the NOAA High Resolution Picture Transmission (HRPT) data (Reference ShimodaShimoda and others, 1998). In the atmospheric correction, the standard atmosphere was assumed, and the reflectance is actually so-called hemisphere-direction reflectance. Clouds were manually removed by visual interpretation, because it was difficult to distinguish between sea ice and light clouds using automatic cloud removal methods and the area of clouds was small.
Table 1. Selected NOAA satellite remote-sensing images
2.2. Estimation of sea-ice volume
Extraction of the sea-ice area is primarily based on differences in reflectivity among the sea ice, sea water and land. Surface temperatures also differ among these three features. Therefore, we can extract the sea-ice area by combining bands 2 and 4 in AVHRR satellite images (Reference Zibordi and Van WoertZibordi and Van Woert, 1993; Reference Luo, Wu, Zhang, Sun and LiuLuo and others, 2004; Reference Xie, Gu, Ha, Cui and ChenXie and others, 2006; Reference Guo, Gu, Sun, Jin and LiGuo and others, 2008; Reference NingNing and others, 2009). Considering that the sediment carried by rivers influences sea-water reflectance, the zonal threshold method was used to extract the sea-ice area, with an error of <10% (Reference Xie, Gu, Yuan and ChenXie and others, 2003). Figure 1 is a schematic of the zone division; the basis of the division is the sedimental distribution and long-term climatological patterns. There are five zones. Zone A is primarily in Liaodong Bay; B is a combination of the western parts of Liaodong Bay, the northeastern part of Bohai Bay and the northern parts of the central zone; C is in Bohai Bay; D includes Laizhou Bay, southeastern parts of Bohai Bay and the southern central zone; and the remainder is E, including the central zone and southeastern Liaodong Bay.
The calculation of sea-ice thickness is based on the modelled relationship between ice thickness and its reflectance, which is based on the theory of solar shortwave radiation and field measurements. The inversion model is (Reference Xie, Gu, Yuan and ChenXie and others, 2003; Reference YuanYuan, 2009; Reference YuanYuan and others, 2012)
where h and α(h) are the thickness and reflectance of sea ice, respectively, and α(h) = 0.423p1 + 0.577p2 (Reference YuanYuan and others, 2012). p1 and p2 are the reflectance values of AVHRR bands 1 and 2 (Reference YuanYuan and others, 2012). κ = 1 — αseä/αmäx, where αmä× is the reflectance corresponding to infinite ice thickness and its value is 0.7, but the actual maximum ice thickness that can be retrieved accurately using Eqn (1) is ∼100cm (Reference YuanYuan and others, 2012). äseais the reflectance of sea water, 0.1 (Reference YuanYuan, 2012). μ is the attenuation coefficient, which can be determined by field measurements (Reference YuanYuan and others, 2012). The parameters in Eqn (1) are based on actual sea-ice situations in different areas, and the error is 15–25% (Reference YuanYuan, 2009; Reference YuanYuan and others, 2012). Snow cover is rare on sea ice in the Bohai Sea, so its effect is neglected, and the effects of sun zenith and azimuth angles compared to AVHHR pixel incidence and azimuth angles are not considered in Eqn (1). Although the surface and bottom of sea ice might undergo a few melt-freeze cycles, the meltwater layer on the sea-ice surface is very thin in the daytime when the AVHRR images are obtained. The effect of surface melt can thus also be neglected.
2.3. Calculation of time-averaged sea-ice volume
Table 1 shows that the time interval between two neighbouring images is not always equal. For this reason, the weighted average method was used to calculate the time-averaged sea-ice volume:

where
![]() is the time-averaged sea-ice volume at point (x, y) in Eqn (2), A(x,y, i) is sea-ice volume at point (x,y) in image i, i is the image number and wi
is the weight factor. The formula is defined as
is the time-averaged sea-ice volume at point (x, y) in Eqn (2), A(x,y, i) is sea-ice volume at point (x,y) in image i, i is the image number and wi
is the weight factor. The formula is defined as
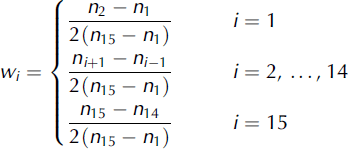
where ni is the date ID in Table 1. The method of time-averaging the sea-ice volume of the entire Bohai Sea is performed:

Similarly, the standard deviation (SD) of sea-ice volume in the Bohai Sea is estimated with the time-averaged sea-ice volume calculated from Eqn (2), and it reflects the intensity of the variation in sea-ice volume over time. The method was performed as follows:

where SD(x, y) is the SD at point (x, y) in Eqn (5). To calculate the SD of sea-ice volume in the entire Bohai Sea over time, the method is

2.4. Zone division
We divided the Bohai Sea into four zones according to the shape of the coastline, water depth, coastal topography, climate characteristics and other geographical environment elements. The zones are Liaodong Bay, Bohai Bay, Laizhou Bay and the Central Zone. Liaodong Bay is the portion north of the line from the Luan River estuary to the Laotieshan Jiao. West of the line from the Luan River estuary to the Yellow River estuary is Bohai Bay, south of the line from the Yellow River estuary to Qimu Jiao is Laizhou Bay, and the remaining portion is the Central Zone. Additionally, Liaodong Bay is subdivided into two sections (west and east), denoted by a line from the midpoint of the Luan River estuary–Laotieshan Jiao line to the northernmost point of Liaodong Bay. Bohai Bay is separated into two sections (north and south), which are denoted by a line from the midpoint of the Luan River estuary–Yellow River estuary to the westernmost point of Bohai Bay. Laizhou Bay is subdivided into two sections (west and east) using the midpoint of the Yellow River estuary–Qimu Jiao line and the southernmost point of Laizhou Bay. Figure 2 shows that we have divided the Bohai Sea into four zones and six small sections.

Fig. 2. Schematic of the zone division and meteorological stations.
To study the variation in sea-ice volume with increasing distance from the shoreline, the lowest astronomical tide was used as the baseline (NGDCNH, 2011). As shown in Figure 2, the Bohai Sea was divided into equidistant sea areas of different offshore distances at 10 km intervals.
To detail the spatial characteristics of sea-ice volume in the Bohai Sea, statistics and analysis have been conducted with the time-averaged sea-ice volume data calculated in section 2.3 using the zonal statistics method in ArcGIS 10.0 software.
3. Results and Analysis
The overall sea-ice volume was estimated from the AVHRR remote-sensing images in Table 1 and the methods introduced in section 2.2. The parameters defined in section 2.3 were calculated with the obtained sea-ice volume data and the methods in section 2.3. According to section 2.4, sea-ice volume in different zones and at different times was evaluated with ArcGIS 10.0 software.
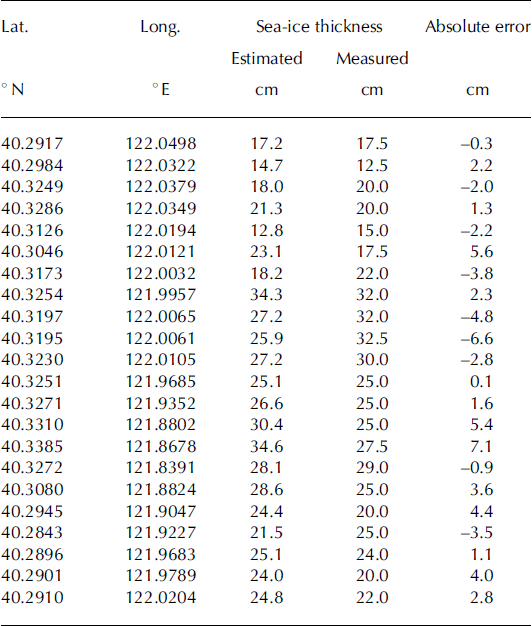
3.1. Estimated sea-ice thickness error
The measured sea-ice thickness in Table 2 is from the sea-ice survey conducted by the authors on board an icebreaker on 29 January 2010. The ice thickness was measured with a ruler for a number of ice samples collected at different locations, and the data accuracy is 0.1 cm. From Table 2, the maximum absolute error of the sea-ice thickness retrieval is 7.1 cm and the minimum error is –6.57cm. The root-mean-square error (RMSE) is 3.6 cm. However, it should be noted that the measured sea-ice thickness is point data, and the estimated ice thickness is image data. The RMSE of 3.6 cm could indicate the average ice thickness retrieval uncertainty of Eqn (2) from the ice-forming period to the ice maximum period. As there were not enough field ice-thickness data, more field data are needed to validate the accuracy of the estimated values which are outside the range of the measured ice thickness values on 29 January 2010 and during the melting period. Fortunately, only one of the AVHRR images used in our study was collected in the ice-melting period, so the ice retrieval accuracy can support the following analysis.
Table 2. Estimated sea-ice thickness errors on 29 January 2010
3.2. Temporal characteristics of sea-ice volume in the Bohai Sea
The primary parameters (area, mean thickness, maximum thickness, minimum thickness, volume) of sea ice in each selected image are presented in Table 3. From these derived data, the maximum value of mean ice thickness is 24.4 cm on 6 January 2010, and the minimum value is 8.9 cm on 21 December 2009. The maximum ice area is 3.54 × 10¹⁰ m2 on 3 February 2010, and the minimum area is 0.53 × 10¹⁰ m2 on 20 December 2009. The variation in mean thickness is not consistent with the sea-ice area. The maximum thickness is >90 cm, and the minimum thickness is <2 cm in January and February 2010. It is notable that both maximum thickness and minimum thickness change little. This may be because, on the one hand, the thickness of landfast ice remains stable, and on the other hand, a lot of new ice would freeze-melt incessantly during that time.
Table 3. Primary parameters of sea ice of the entire Bohai Sea in winter 2009/10
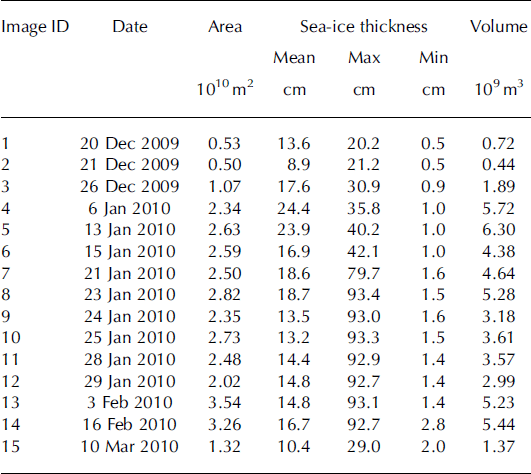
Figure 3 shows the sea-ice volume at different times. It is clear that it changed greatly, from 0.44 × 10 9m3 on 20 December 2009 to 6.30 × 10⁹m3 on 13 January 2010, the former volume being only 7% of the latter. The time-averaged sea-ice volume for the entire Bohai Sea is 4.15 × 10⁹m3, with a standard deviation of 2.99 × 1 0 9m3. The annual distribution of sea-ice volume for the entire Bohai Sea appears to fit a bimodal curve, with two local maximum values of 6.30 × 10⁹ m3 on 13 January and 5.44 × 10⁹ m3 on 16 February 2010. Possible reasons for this phenomenon include sea-ice melting in the deep area of the Bohai Sea because of air-temperature variations, and the shortage of remote-sensing images. The temporal characteristics of sea-ice volume in Liaodong Bay are completely consistent with those in the Bohai Sea overall, but the other three zones are different. Figure 4 shows the variation in the standard deviation of sea-ice volume across the Bohai Sea. Clearly, the values of the standard deviation vary greatly among different points in the Bohai Sea and decrease with distance from shore, with a maximum of 44.7 cm and a minimum of 0.3 cm. The standard deviation in Liaodong Bay, especially in its eastern part, is larger than in the other zones.
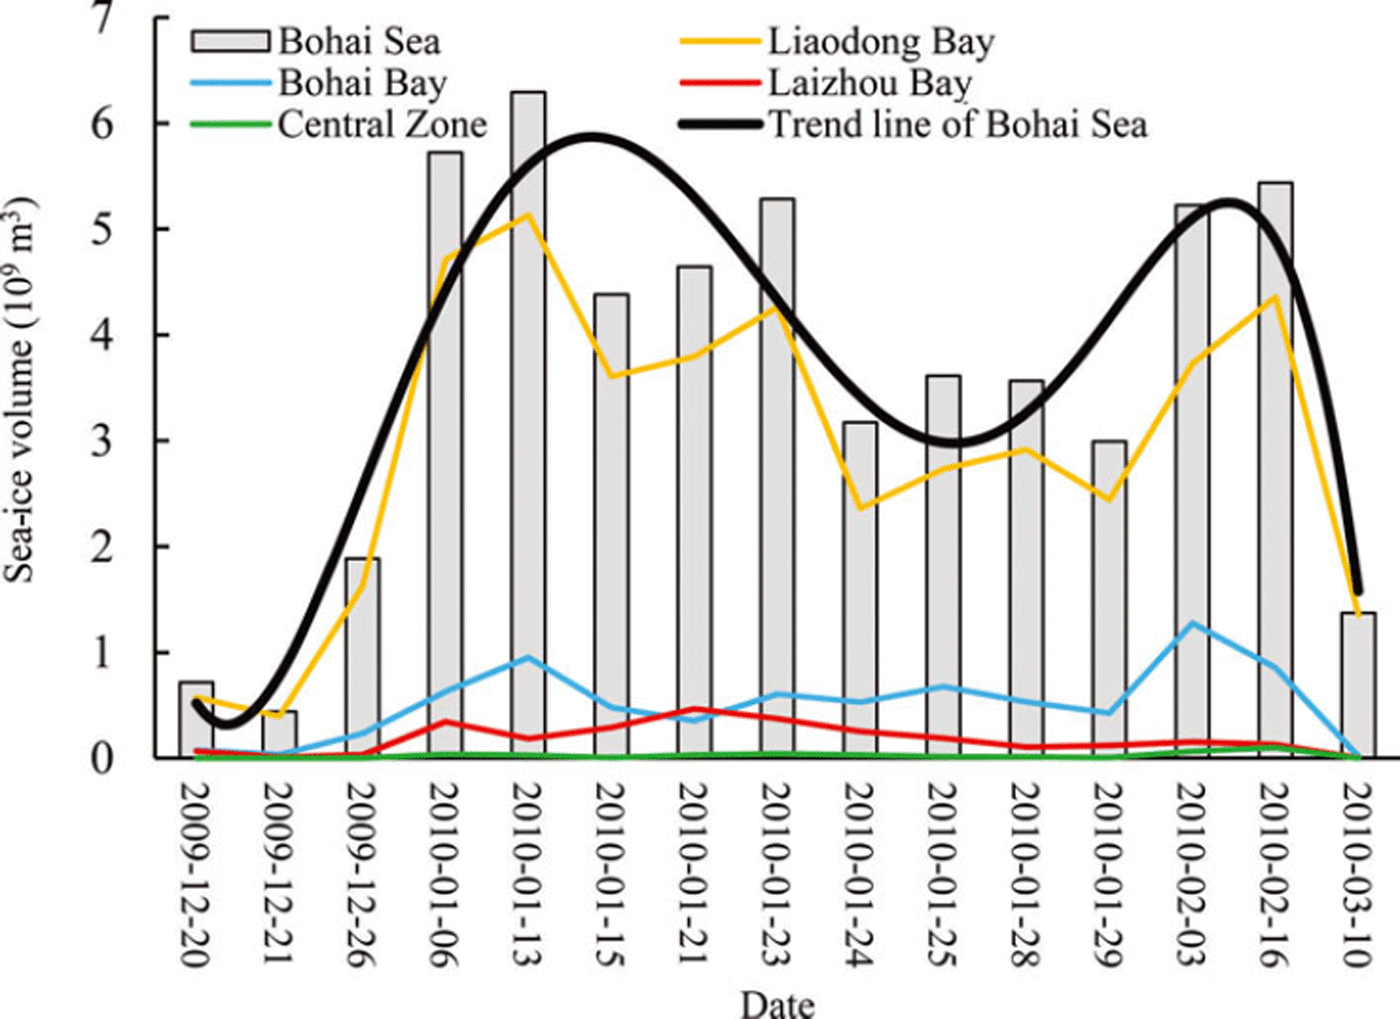
Fig. 3. Sea-ice volume in winter 2009/10. Dates are year-month-day.

Fig. 4. Variation in the standard deviation of sea-ice volume in the Bohai Sea.
3.3. Spatial characteristics of sea-ice volume in the Bohai Sea
Figure 5a compares the time-averaged sea-ice volume in different zones. The order of the time-averaged sea-ice volume is Liaodong Bay > Bohai Bay > Laizhou Bay > Central Zone. The proportion of the total time-averaged Bohai Sea sea-ice volume in Liaodong Bay is 80.26%. The other proportions are 14.71% in Bohai Bay. 4.15% in Laizhou Bay and 0.88% in Central Zone. Figure 5b compares the time-averaged sea-ice volume for the six small sections. This is clearly larger in eastern than in western Liaodong Bay, even though the western area is larger. This occurs primarily because the prevailing northwest wind in winter blows the sea ice in the western portion into eastern Liaodong Bay. The time-averaged sea-ice volume is larger in southern than in northern Bohai Bay, and in western than in eastern Laizhou Bay.
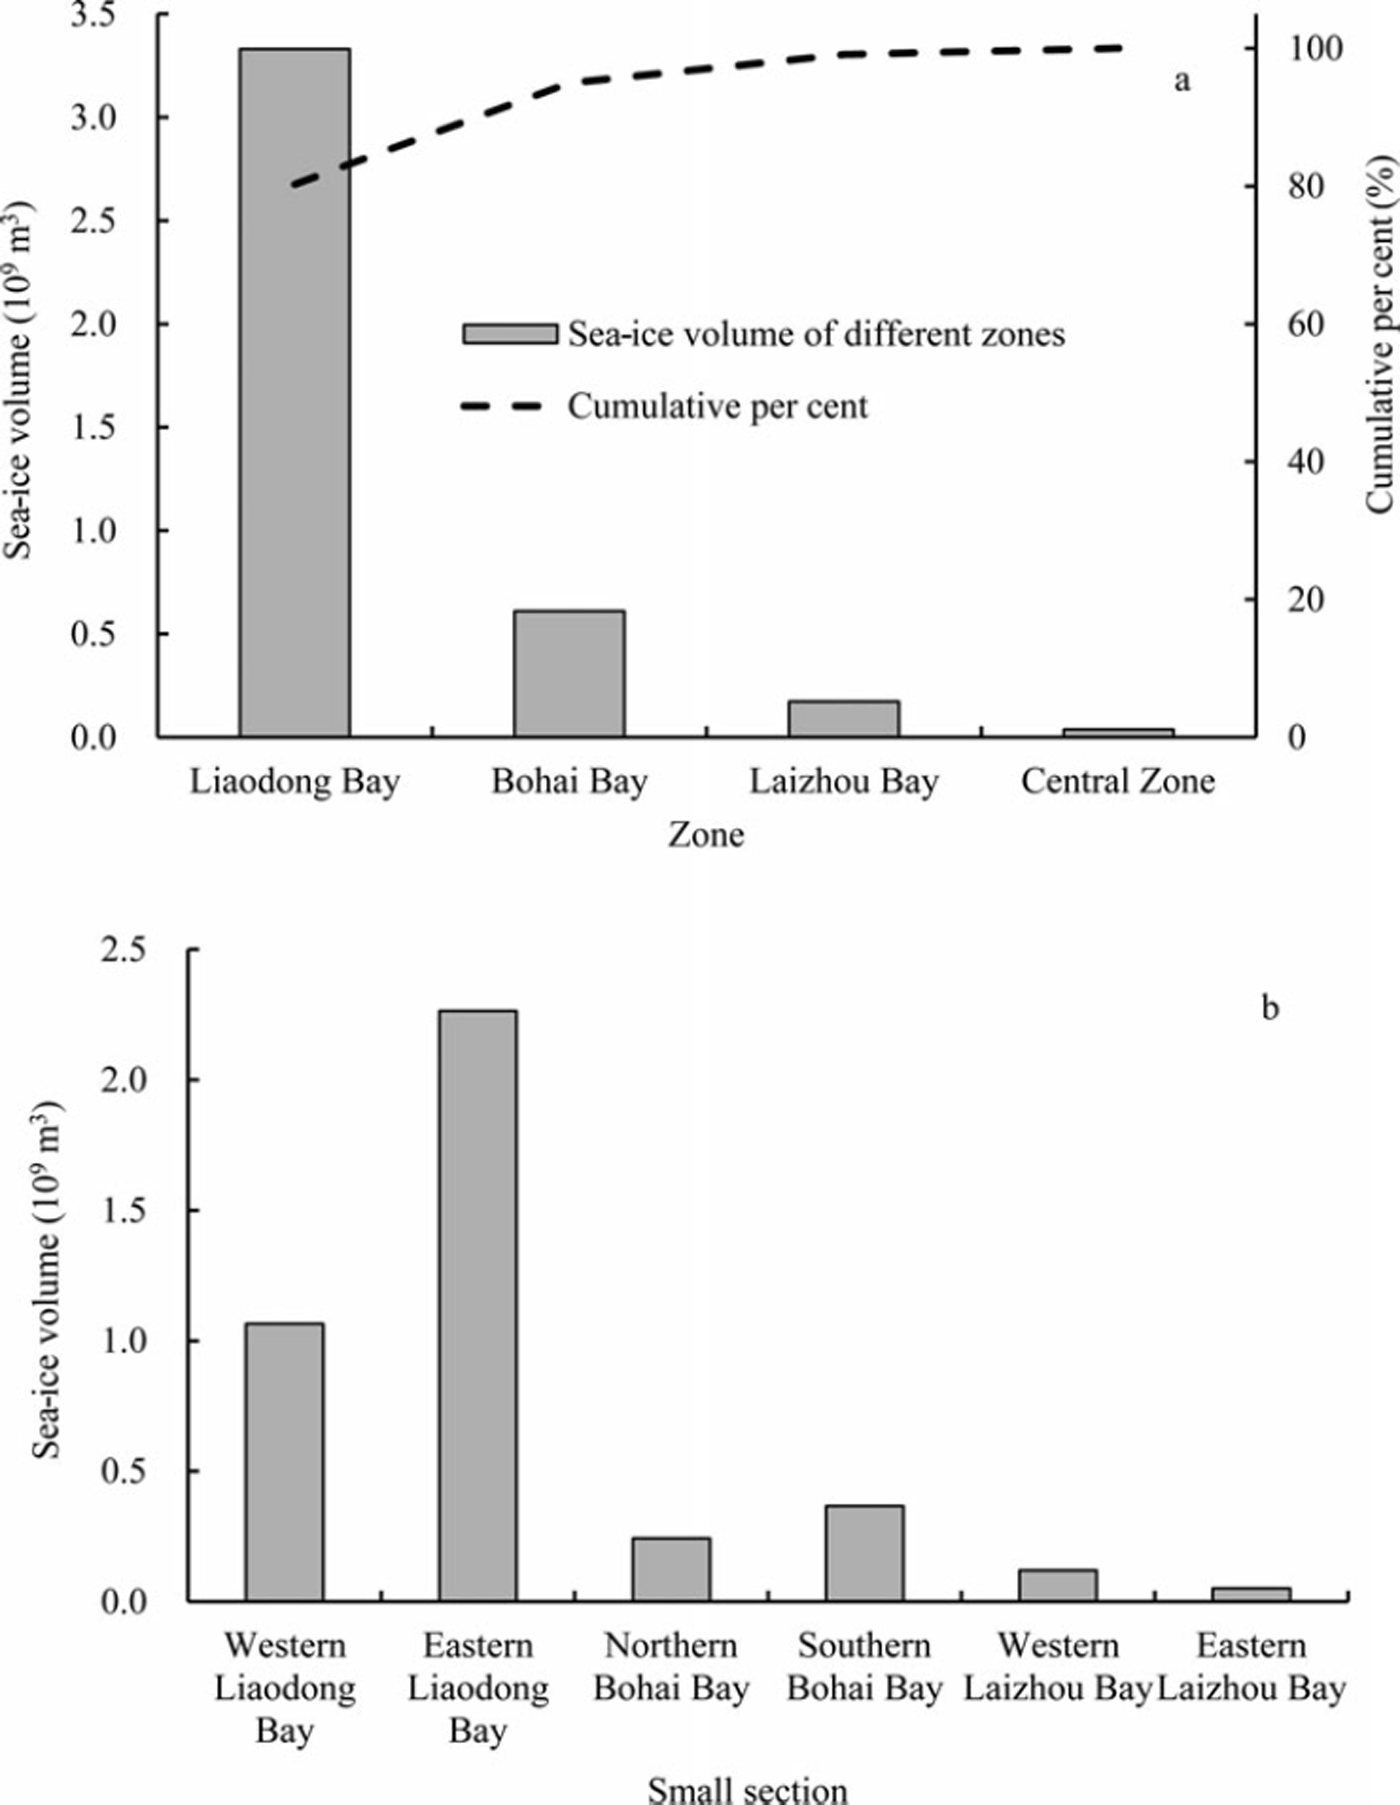
Fig. 5. Time-averaged sea-ice volume in (a) different zones and (b) different small sections.
Figure 6a shows the time-averaged sea-ice volume within different equidistant sea areas, and Figure 6b compares the time-averaged sea-ice volume per unit area within those areas. The time-averaged sea-ice volume per unit area is the volume of sea ice per square kilometre, and is determined by the mean ice thickness within an equidistant sea area. The 0–10km area accounts for 42.43% of the entire time-averaged sea-ice volume, whereas the 100–110km area accounts for only 0.002%. Similarly, the time-averaged sea-ice volume per unit area decreases sharply with increasing distance from shore. This occurs predominantly because of the offshore distance and the shape of the coastline, having an opening ring. The areas that are closer to the shoreline have thicker sea ice and a greater total area. However, the former is the main reason for sea-ice volume decreasing sharply with increasing distance from shore. These closer areas contain most of the sea ice (Fig. 6a and b).
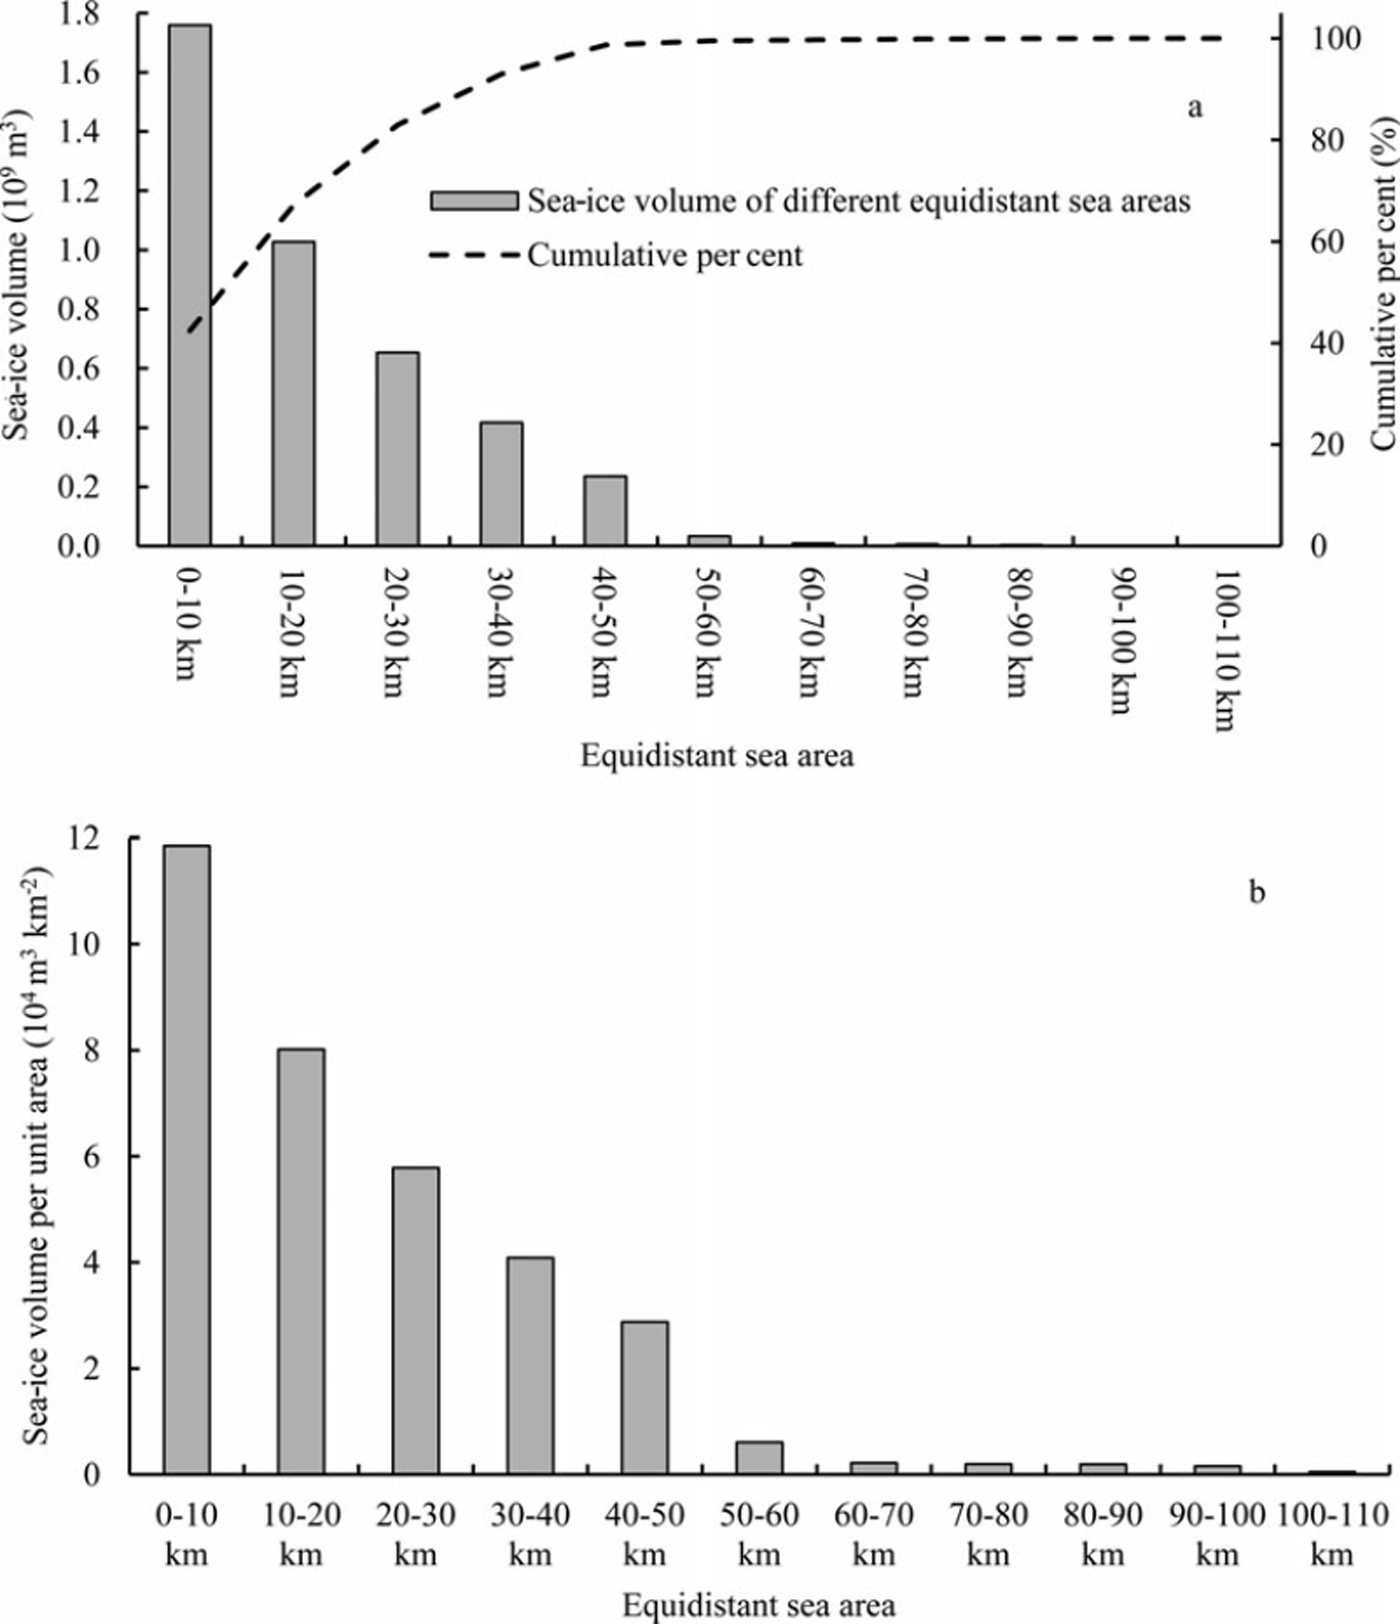
Fig. 6. (a) Time-averaged sea-ice volume and (b) time-averaged sea-ice volume per unit area in different equidistant sea areas.
When taking the quotient of the time-averaged sea-ice volume and the buffer distance (10 km) as the rate of change in sea-ice volume with respect to the distance from shore at the centre point (5 km, 15 km, 25 km, etc.) of every equidistant sea area, the trend line describes the relationship between sea-ice volume and distance from the shore (Fig. 7). Figure 7 shows that the time-averaged sea-ice volume decreases rapidly with increasing distance from shore; it is an exponential function (R 2 = 0.9929).
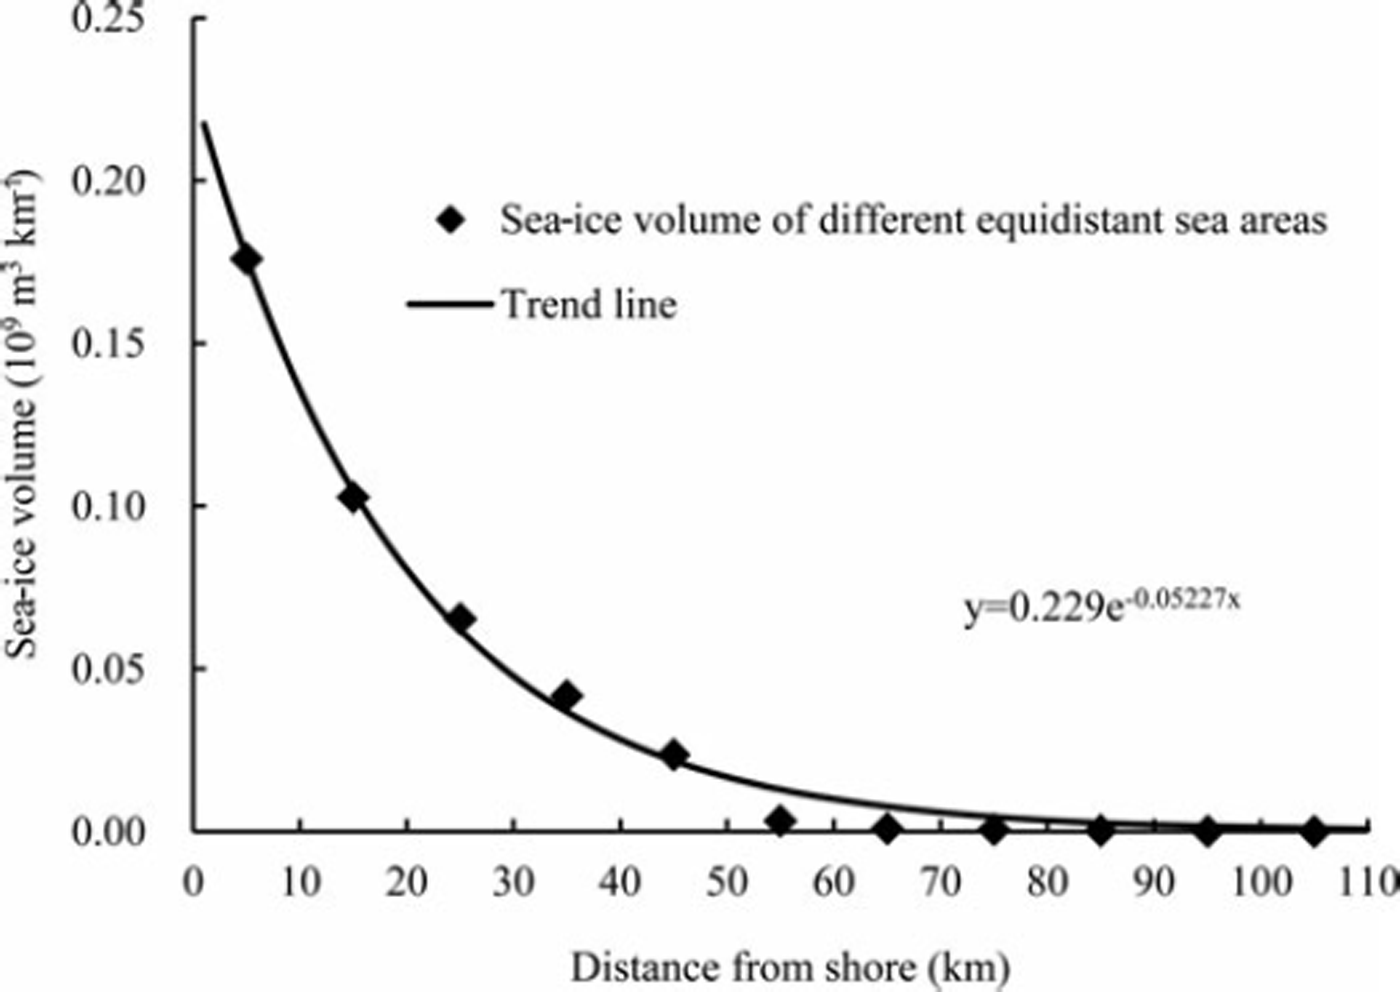
Fig. 7. The relationship between sea-ice volume and distance from shore.
4. Discussion
The development of remote-sensing technology has made it possible to efficiently monitor the volume of ice in the Bohai Sea. The estimated error in the sea-ice area of the Bohai Sea is ∼10%, which meets the demands of practical applications (Reference YuanYuan and others, 2012). However, we need a more accurate estimation model for sea-ice thickness. It is impossible to obtain remote-sensing images every day or at regular intervals for winter 2009/10 due to weather conditions, and this limitation made the task of analysing the spatiotemporal characteristics of sea-ice volume more difficult. Although the weighted average approach was used to calculate the time-averaged sea-ice volume, we also need to find a continuous remote monitoring method to estimate sea-ice volume in the Bohai Sea. For example, we can estimate it by combining optical and microwave remote-sensing methods. In addition, the most recent previous severe ice winter in the Bohai Sea was in 1969. It is difficult to obtain data related to sea-ice thickness and area for the entire Bohai Sea for 1969, as the measured data available do not cover the entire sea the way that satellite images can. However, we can study the spatio-temporal characteristics of the sea-ice volume in winter 2009/10 as a reference for the exploitation and utilization of sea ice in a severe ice winter in the Bohai Sea.
5. Conclusions
The winter of 2009/10 was a severe ice winter. The freezing date was 17 December 2009 and the break-up date was 19 March 2010. We have estimated sea-ice volume in the Bohai Sea in winter 2009/10 using AVHRR images to extract sea-ice area, and an estimation model of sea-ice thickness. To study the spatio-temporal characteristics of sea-ice volume, zonal statistics were performed with ArcGIS 10.0 software. For the entire Bohai Sea, sea-ice distribution showed two peak values during winter 2009/10, and the variation in ice volume decreased with increasing distance from shore. From the spatial characteristics of the sea ice, the following order of average sea-ice volume was determined: Liaodong Bay > Bohai Bay > Laizhou Bay > Central Zone. Because of the influence of wind direction, sea-ice volume was larger in eastern than in western Liaodong Bay. The relationship between sea-ice volume and distance from shore is essentially exponential. The above discussion fully describes the finding that the spatio-temporal characteristics of sea-ice volume in the Bohai Sea are jointly affected by the air/sea thermal process and the wind/ocean-currents/sea-ice dynamic process.
Acknowledgements
This study was supported by the following Chinese government science and technology projects: National High Technology Research and Development Program of China (No. 2011AA100505); National Basic Research Program of China (973 Program) (No. 2012CB955402); and Project Supported by State Key Laboratory of Earth Surface Processes and Resource Ecology (2010-TD-02, 2011-TDZD-050, 2012-ZD-01).


