


Type 2 diabetes (T2D) represents a major public health problem with a rapidly increasing prevalence worldwide( Reference Narayan, Gregg and Fagot-Campagna 1 ). It is estimated that by the year 2025 more than 300 million individuals will be affected by the disease( Reference Narayan, Gregg and Fagot-Campagna 1 ). The increasing prevalence has occurred in parallel with the worldwide rise in obesity and environmental and lifestyle changes related to migration and urbanisation; issues which are often linked to high prevalence of T2D( Reference Lirussi 2 , Reference Hu 3 ).
Migration of non-Western immigrants to Western countries is often associated with changes in dietary habits. However, the extent and nature of these changes vary depending upon the country of origin, dietary culture in the host country and the socio-economic situation of immigrants( Reference Holmboe-Ottesen and Wandel 4 ). In general, a trend towards increased consumption of energy-dense foods such as beverages and ‘fast food’ is seen among immigrants( Reference Raj, Ganganna and Bowering 5 , Reference Lesser, Gasevic and Lear 6 ).
Lifestyle modifications, including increased physical activity (PA) and dietary changes, have shown efficacy in preventing or delaying the onset of T2D in large clinical trials( Reference Pan, Li and Hu 7 – Reference Yoon, Kwok and Magkidis 11 ). Dietary interventions in these trials have focused on reduction in intakes of energy as well as total and saturated fats and an increase in dietary fibre intake. For instance, in the Da Qing study, the T2D incidence was much lower in the dietary intervention group (IG) compared with the control group (CG) after 6 years of follow-up( Reference Pan, Li and Hu 7 ). In the Finnish Diabetes Prevention Study, individuals in lowest quartile of dietary fat intake and highest quartile of fibre intake after a mean 4-year follow-up had reduced risk of progression to T2D, independent of changes in weight and PA levels( Reference Lindstrom, Peltonen and Eriksson 12 ). These findings suggest that management of macronutrients, such as fat and fibre, may play a key role in the prevention of T2D.
Despite the evidence in favour of dietary modification from these studies( Reference Pan, Li and Hu 7 , Reference Lindstrom, Peltonen and Eriksson 12 ), it is not clear whether studies designed for Western populations are effective in minority groups of migrants considering cultural differences and attitudes related to diet, PA and perception of health( Reference Lirussi 2 , Reference Kandula, Dave and De Chavez 13 , Reference Bhopal, Douglas and Wallia 14 ). In Europe, some culturally adapted lifestyle interventions have been conducted but mainly among South Asian immigrants. There is clearly a knowledge gap in terms of lifestyle interventions among Middle Eastern (ME) immigrants. Consequently, little is known regarding effects of lifestyle interventions including the effects of dietary advice on dietary modification in this group. There is increasing consensus that lifestyle interventions, which target minority groups, must consider the cultural and religious backgrounds as well as socio-economic barriers to lifestyle change in the target population to be effective( Reference Lirussi 2 , Reference Saha, Leijon and Gerdtham 15 – Reference Delavari, Sonderlund and Mellor 17 ).
ME immigrants currently constitute one of the largest and fastest-growing immigrant groups in Sweden. Malmö, the third largest city in Sweden, is home to a large group of ME immigrants, mainly from Iraq( 18 ). Results from the MEDIM study (‘the impact of Migration and Ethnicity on Diabetes in Malmö’) have shown that Iraqi immigrants have a higher prevalence of T2D (11·6 v. 5·8 %, P<0·001) compared with native Swedes. They also exhibit a clustering of T2D risk factors such as obesity (37·5 v. 23·0 %, P<0·001), physical inactivity (71·9 v. 38·6 %, P<0·001) and a positive family history of diabetes (51·7 v. 27·6 %, P<0·001) compared with ethnic Swedes living in Malmö( Reference Bennet, Groop and Lindblad 19 ). A culturally adapted lifestyle intervention, including modification of both dietary and PA habits, was successful in reducing body weight and LDL cholesterol and improving insulin sensitivity in Iraqi immigrants from MEDIM( Reference Siddiqui, Kurbasic and Lindblad 20 ).
The primary aim of the present study was to investigate the effectiveness of a culturally adapted lifestyle intervention in changing dietary intake, particularly energy, fat and fibre intakes, in the IG compared with the CG in this immigrant population at high risk of T2D. The predefined dietary goals for the IG in the study were to reduce fat intake (total fat <30 % of total energy intake (E%) and saturated fat <10 E%) and to increase fibre intake (≥15 g/4184 kJ (1000 kcal)). The changes in mean daily intakes of macronutrients as well as in the proportions of individuals meeting the study goals were evaluated at the end of the study.
Materials and methods
The MEDIM intervention study was a 4-month randomised controlled trial conducted in Malmö, Sweden. The study design, methods and recruitment have previously been described in detail( Reference Saha, Leijon and Gerdtham 15 ).
Study participants
The study participants were Iraqi-born residents of Malmö recruited from the MEDIM baseline study, a cross-sectional population-based study (n 2155: Iraqi-born, n 1398; Swedes, n 757) conducted between 2010 and 2012. The baseline study included a randomly selected sample of Iraqi-born and Swedish-born residents matched for age and sex( Reference Bennet, Groop and Lindblad 19 ). The information collected during the baseline study was used to select participants for the intervention study. A total of 636 individuals were identified as eligible for participation and invited to participate in the intervention study. All of the participants in the intervention study were first-generation immigrants and fulfilled one or more of the following inclusion criteria corresponding to an increased T2D risk: (i) increased waist circumference (≥80 cm in females and ≥94 cm in males)( Reference Alberti, Eckel and Grundy 21 ); (ii) BMI≥28·0 kg/m2; or (iii) pre-diabetes. Pre-diabetes was defined as impaired fasting plasma glucose (6·1–6·9 mmol/l), impaired glucose tolerance (fasting plasma glucose <6·1 mmol/l and 2 h glucose=7·8–11 mmol/l) or impaired glucose regulation (fasting plasma glucose=6·1–6·9 mmol/l and 2 h glucose=7·8–11 mmol/l)( 22 ). Exclusion criteria were diagnosis of diabetes (medication with oral hypoglycaemic agents/insulin) or fasting plasma glucose ≥7 mmol/l or 2 h glucose ≥11·1 mmol/l; pregnancy; and mental or physical incapacity to participate in the study( Reference Saha, Leijon and Gerdtham 15 ). Of the 104 individuals who agreed to participate, eight were excluded due to the diagnosis of diabetes at the first visit. The remaining ninety-six were included in the study; thereby leading to a participation rate of 15·1 % for the intervention study( Reference Siddiqui, Kurbasic and Lindblad 20 ). Figure 1 presents a flowchart of the study participants.
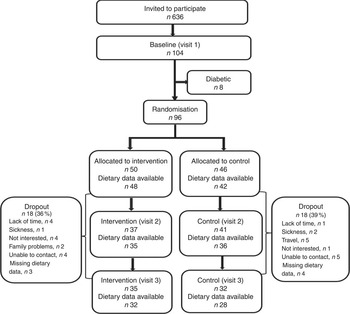
Fig 1 Flowchart of eligible participants for dietary data in the MEDIM (‘impact of Migration and Ethnicity on Diabetes in Malmö’) intervention study
Randomisation
After the baseline health examination, the participants were randomly allocated to either the IG (n 50) or the CG (n 46) with a 1:1 allocation ratio. The first author accessed the random number generator in the SPSS statistical software package to generate a random allocation sequence( Reference Siddiqui, Kurbasic and Lindblad 20 ). This allocation sequence was then used to allocate participants to the CG and the IG alternatively. Randomisation was stratified by gender only. However, spouses were randomised into the same group (intervention or control). Nurses who conducted the health examinations were unaware of the participant’s assignment to either group( Reference Siddiqui, Kurbasic and Lindblad 20 ).
Lifestyle intervention
The culturally adapted intervention was modified from the Diabetes Prevention Program intervention( 23 ) and included a total of seven gender-specific group sessions, including one cooking class, between January and June 2015 as the study was planned to end before the start of the month of fasting (Ramadan)( Reference Siddiqui, Kurbasic and Lindblad 20 ).
Sessions were organised by a diabetes nurse with expertise in patient counselling and a health coach (a public health worker with in-depth knowledge of ME culture). The sessions were offered weekly for the first 2 weeks, thereafter the interval between the sessions varied from 1 to 4 weeks. Each session lasted for 90 min and was attended by a professional Arabic translator who was present at all meetings( Reference Siddiqui, Kurbasic and Lindblad 20 ). The sessions covered areas like knowledge of T2D and CVD and their association with lifestyle, awareness and motivation for lifestyle change, maintaining the change through social support and avoiding the risk of relapse( Reference Paulweber, Valensi and Lindstrom 24 ). The participants were encouraged to create and implement specific, measurable, attainable, realistic and time-bound (SMART) goals in terms of PA and dietary intake( Reference Lindstrom, Neumann and Sheppard 25 ). For example: ‘I want to lose weight so I will drink water instead of energy drinks’ or ‘I will take the stairs instead of the elevator every day’. While defining SMART goals, the focus was to encourage participants to identify and overcome potential barriers for maintaining a healthy diet and lifestyle. However, these goals were defined by the participants for their personal motivation and were not evaluated for their effectiveness or attainment by the end of the study.
Regarding the dietary intervention, group discussions focused on the concept of a healthy diet with the aim to empower the participants by providing them with knowledge and skills required to make changes to their diet( Reference Saha, Leijon and Gerdtham 15 ). The dietary goals for the IG (total fat intake <30 E%, saturated fat intake <10 E% and fibre intake ≥15 g/4184 kJ (1000 kcal)) were adopted from the Finnish Diabetes Prevention Study and from the IMAGE toolkit for prevention of T2D in Europe( Reference Lindstrom, Neumann and Sheppard 25 , Reference Lindstrom, Ilanne-Parikka and Peltonen 26 ). To reach these goals, participants were encouraged to consume fresh fruits and vegetables, whole grains, fish, vegetable oil, and low-fat meat and dairy products. The Nordic Keyhole food label was introduced to encourage participants to choose healthier food items containing more fibre and less fat and sugar at retail stores. Written materials for educational purposes (e.g. brochures and posters) were used to demonstrate a healthy and well-balanced food plate( 27 ).
A chef with experience in preparing diets for individuals with diabetes led the cooking class( Reference Siddiqui, Kurbasic and Lindblad 20 ). The aim with the cooking class was to inspire the participants to prepare traditional ME dishes in a healthier way. Participants were encouraged to bring their favourite recipe to the cooking class, which was then modified by the chef to contain less fat and sugar.
Control group
Participants in the CG received ‘treatment as usual’; that is, they received brief written advice on increasing their PA and to follow a healthy diet comprising less fat and sugars, at the start, mid and end of the study. This information was distributed along with the health examination results( Reference Siddiqui, Kurbasic and Lindblad 20 ).
Outcomes
The primary outcomes of the present study were daily mean intakes of energy (kilojoules/kilocalories), carbohydrate, sugar (sucrose), total fat, saturated fat, protein (measured in grams as well as percentage of total energy intake) and fibre (grams per 4184 kJ (1000 kcal)). The secondary outcomes were proportion of individuals meeting the study goals; namely total fat <30 E%, saturated fat <10 E% and fibre ≥15 g/4184 kJ (1000 kcal).
Data collection
Health examinations were performed and self-reported dietary data were collected at three time points (baseline, mid and end) during the study over a period of 4 months, as shown in Fig. 1. Details regarding the collection of anthropometric and biochemical measurements have previously been described in full detail( Reference Saha, Leijon and Gerdtham 15 ).
Dietary intake assessment
Following each health examination, all participants received two identical templates of the food diary (one in Swedish and one in Arabic). The participants were then instructed to fill out the dietary diary with details (type of food, quantity consumed, method of cooking and time of consumption) of all foods and beverages consumed during four consecutive days. Instructions on filling out the dietary diary were delivered by an Arabic-speaking nurse. The aim with the dietary diary was to capture total food intake as well as dietary habits (breakfast, lunch, dinner, snacks). Booklets with pictures of portion sizes from the Swedish National Food Administration( 27 ) were used to help the participants estimate their portion sizes. A health professional, who had knowledge of the Iraqi food culture, translated food records reported in Arabic into Swedish.
The translated data were analysed for energy and nutrient contents using the Dietist XP software version 3.2 (Kost och Näringsdata, Bromma, Sweden)( 28 ). This program contains food tables from the Swedish National Food Administration and covers approximately 1600 food items and fifty-two nutrients. For food items that were not available in the food database, alternative products similar in energy and nutritional content were selected. Traditional Arabic dishes were added manually into the database to capture their accurate nutritional composition. Mean energy intake (kJ/d, kcal/d), mean intakes of macronutrients (g/d) and the contribution to total energy from each macronutrient (E%) were estimated for every individual. The energy conversion factors used were the following: protein, 16·7 kJ/g (4 kcal/g); fat, 37·5 kJ/g (9 kcal/g); and carbohydrate, 16·7 kJ/g (4 kcal/g).
The data for energy intake were tested for extreme values (<2093 kJ/d (<500 kcal/d) or >20920 kJ/d (>5000 kcal/d)). However, no exclusions were required. Estimates of energy intake include energy from alcohol intake; however, very few participants (n 7) reported consuming alcohol in their food diaries.
Definitions
Age was defined as the difference between birth date and the date of first examination( Reference Siddiqui, Kurbasic and Lindblad 20 ).
BMI was calculated using the formula: [weight (kg)]/[height (m)]2.
Motivation level/self-efficacy was assessed from the responses to a self-determination theory questionnaire( Reference Levesque, Williams and Elliot 29 ). Participants responded to four questions relating to their ability to change their diets and maintaining the change. Each question was answered on a scale of 1 to 7, where 1=‘not at all true’ and 7=‘very true’. The responses to all four questions were averaged to obtain mean scores.
Self-reported PA was expressed as MET-h/week (where MET=metabolic equivalent of task) based on the short-form International Physical Activity Questionnaire( Reference Craig, Marshall and Sjöström 30 ). Time spent in performing moderate- and vigorous-intensity PA, as well as walking during a week, was reported by participants. To calculate MET-h/week, MET values for vigorous- (8·0 MET) and moderate-intensity (4·0 MET) PA as well as walking (3·3 MET) were multiplied by the time spent in performing these activities during the week( 31 ).
Economic difficulties were defined as problems in paying bills/rent over the past 12 months.
Education was categorised as below high school level, or high school or above( Reference Siddiqui, Kurbasic and Lindblad 20 ).
Participants were considered non-smokers if they had never smoked or stopped smoking more than 6 months ago.
Statistical analysis
Data analysis was performed using the statistical software packages IBM SPSS Statistics version 21.0 and SAS version 9.3. Baseline characteristics of the CG and the IG were reported as mean and sd or as frequencies and percentages (Table 1). The baseline differences were compared using the independent-sample t test or the Mann–Whitney U test for normal and non-normally distributed continuous variables, respectively (Table 1). The χ 2 test or Fisher’s exact test was used for categorical variables (Table 1). Descriptive statistics (mean, sd) for the outcome variables at three time points during the study were reported (Table 2). Descriptive changes in intake of nutrients (∆) from visit 1 to visit 3 were summarized as box-and-whisker plots (Fig. 2). The paired-sample t test was used to study within-group trends.
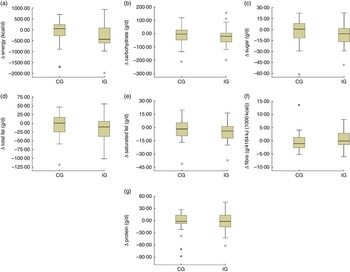
Fig 2 Box-and-whisker plots representing change in dietary intake (Δ) from visit 1 to visit 3 (visit 3 – visit 1) in the intervention group (IG) and control group (CG) of participants of the MEDIM (‘impact of Migration and Ethnicity on Diabetes in Malmö’) intervention study: (a) energy (to convert to kJ, multiply kcal value by 4·184); (b) carbohydrate; (c) sugar; (d) total fat; (e) saturated fat; (f) fibre; and (g) protein. The bottom and top edge of the box represent the first and third quartiles (interquartile range); the line within the box represents the median; the ends of the bottom and top whiskers represent the minimum and maximum values; the dots represent outliers; and the asterisks represent extreme outliers (more than 3× the interquartile range)
Table 1 Baseline characteristics of the study participants eligible for analysisFootnote * in the intervention group (IG) and control group (CG) of the MEDIM (‘impact of Migration and Ethnicity on Diabetes in Malmö’) intervention study

IQR, interquartile range; HS, high school; MET, metabolic equivalent of task; E%, percentage of energy intake.
* Dietary data available at baseline and at least one more follow-up.
† BMI≥28·0 kg/m2.
‡ Fasting plasma glucose=6·1–6·9 mmol/l and/or 2 h glucose=7·8–11·0 mmol/l.
§ Mann–Whitney U test.
║ Fisher’s exact test.
Table 2 Descriptive changes in intakes of energy, fibre and macronutrients over time (visits 1–3) in the intervention group (IG) and control group (CG) of the MEDIM (‘impact of Migration and Ethnicity on Diabetes in Malmö’) intervention study
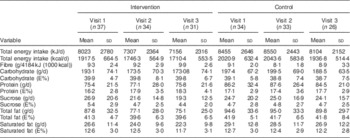
E%, percentage of energy intake.
In longitudinal analyses, all individuals with dietary records completed at two time points (baseline and at least one more follow-up) were included in the analysis. A P value of ≤0·05 was considered statistically significant with no correction for multiple testing. Log-transformation (loge) of the outcome variables was done and linear mixed models were used to assess if the change in the outcomes over time in the IG differed from that in the CG.
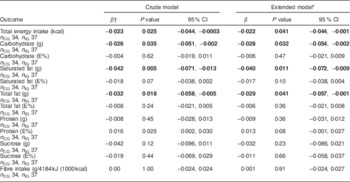
In the crude model (Table 3) an interaction term between ‘time since baseline visit (months)’ and ‘group status’ indicated effect of the intervention. The β coefficient for the interaction term indicated the percentage change (100×exp(β – 1)) in outcomes in the IG per month. The crude models were then adjusted to include covariates; age, sex, BMI, education, self-efficacy scores for diet, PA, smoking and economic difficulties (extended model, Table 3). The β coefficient for the variable ‘time since baseline visit’ in the models indicated change in outcomes per month in the study participants, irrespective of group status (presented in Table 4).
Table 3 Change over time in dietary intakes (loge-transformed) in the intervention group compared with the control group of the MEDIM (‘impact of Migration and Ethnicity on Diabetes in Malmö’) intervention study. The analysis included all individuals with data available for at least two time points

n CG, number in control group (n for extended models can vary slightly because of missing values); n IG, number in intervention group (n for extended models can vary slightly because of missing values); E%, percentage of energy intake.
* Adjusted for age, sex, BMI, economic difficulties, self-efficacy, smoking, physical activity and education.
† β is a parameter estimate for the interaction term ‘group status’בtime since baseline visit (months)’. The β coefficient indicates percentage change (calculated as 100×exp(β – 1)) in the outcomes per month in the intervention group compared with the control group.
Table 4 Change over time in dietary intakes (loge-transformed) of the participants in the MEDIM (‘impact of Migration and Ethnicity on Diabetes in Malmö’) intervention study, irrespective of group status. The analysis included all individuals with data available for at least two time points; significant results are indicated in bold font
n CG, number in control group (n for extended models can vary slightly because of missing values); n IG, number in intervention group (n for extended models can vary slightly because of missing values); E%, percentage of energy intake.
* Adjusted for age, sex, BMI, economic difficulties, self-efficacy, smoking, physical activity and education.
† β is a parameter estimate for the variable ‘time since baseline visit (months)’. The β coefficient indicates percentage change (calculated as 100×exp(β – 1)) in the outcomes per month in the study participants.
Change in the proportion of individuals meeting the dietary goals from first to last visit in the two groups was compared using extended McNemar’s test for multiple samples (Table 5)( Reference Marascuilo and Serlin 32 ).
Table 5 Proportion of individuals meeting the dietary goals in the intervention group (IG) and control group (CG) at the first and the last visits, MEDIM (‘impact of Migration and Ethnicity on Diabetes in Malmö’) intervention study
E%, percentage of energy intake.
* McNemar test for within-group changes.
† McNemar test for between-group changes.
In the study protocol, sample size (n 155 for each group) was calculated to estimate a difference in fasting glucose concentration of 0·22 mmol/l between the CG and the IG with power of 0·86, as previously described( Reference Saha, Leijon and Gerdtham 15 ). Sample size calculations were not based on differences in dietary intake and no post hoc power calculations were made( Reference Hoenig and Heisey 33 ).
Results
Out of the total ninety-six participants randomised into the IG (n 50) or the CG (n 46), seventy-one individuals reported dietary data at two time points (baseline and at least one more follow-up) and were eligible for analysis (IG, n 37; CG, n 34). The participants in the IG and the CG were followed-up for a mean duration of 3·9 and 3·5 months, respectively( Reference Siddiqui, Kurbasic and Lindblad 20 ). The dropout rates were 36·0 % in the IG and 39·0 % in the CG. Participants in the IG attended a mean of 2·7 group sessions on average.
Baseline characteristics of participants eligible for analysis
No statistically significant differences were observed between the two groups in terms of anthropometrics, family history of diabetes, sociodemographic characteristics, self-efficacy, or lifestyle habits such as PA or intakes of total energy and macronutrients (Table 1).
The mean daily energy intake was comparable in both groups: 8023 kJ (1917·5 kcal) in the IG v. 8455 kJ (2020·9 kcal) in the CG. The mean total fat intake reached over 40 E%. Mean saturated fat intake was about 13 E% in both groups. On the contrary, the mean percentage of energy derived from sucrose was low (about 5 E%).
Fibre consumption was very low in both groups and there were no individuals consuming ≥15 g/4184 kJ (1000 kcal) in either group. No women met the fibre intake recommendation of 25 g/d and no men met the recommended level of 35 g/d( 34 ).
Changes in dietary intakes during the study
Table 2 presents the mean daily intakes of total energy, fibre and other macronutrients in the IG and the CG at the three time points: start, mid and end during the study. Changes in intakes of macronutrients (∆) from visit 1 to visit 3 in the two groups are presented as box-and-whisker plots in Fig. 2.
Favourable trends towards a decrease in intake of energy (8216 kJ (1963·6 kcal) at visit 1 v. 7156 kJ (1710·4 kcal) at visit 3, P=0·03) and in absolute intakes of carbohydrate (197·3 g at visit 1 v. 173·1 g at visit 3, P=0·06), sucrose (26·1 g at visit 1 v. 19·3 g at visit 3, P=0·02) and total fat (89·8 g at visit 1 v. 75·1 g at visit 3, P=0·02) were seen in the IG (paired sample t-test, n 31 for visit 1 and visit 3). An increase in fibre intake was also observed in the intervention group although the trend was statistically non-significant (9·4 g at visit 1 v. 9·9 g at visit 3, P=0·42). No statistically significant differences in change over time in intake of energy, fibre (g/4184 kJ (1000 kcal)) or macronutrients (in g/d) were observed in the IG compared with the CG (Table 3).
On the contrary, irrespective of group status, statistically significant decreases over time in intakes of energy (2·2 % per month), carbohydrate (2·8 % per month), saturated fat (4·0 % per month) and total fat (2·9 %) were seen in the total group of study participants. These changes remained significant even after adjustment for covariates presented in Table 4.
Descriptive changes over time in the percentage of energy contributed by each macronutrient are presented in Table 2. When the change over time in percentage of energy from macronutrients was compared between the IG and the CG, no statistically significant differences were observed (Table 3). The change over time in percentage of energy from macronutrients among study participants, irrespective of group status, was also statistically non-significant (Table 4).
Proportions meeting the study goals
In the IG, the proportion of individuals obtaining <10 E% from saturated fat increased from 16·1 % at the first visit to 32·3 % at the last (Table 5). In the CG, a decrease, from 19·2 % at the first visit to 11·5 % at the last visit, was observed. However, within-group changes and between-group differences were statistically non-significant (Table 5).
The predefined study goal was obtaining <30 E% from fat. However, because of very few individuals meeting this goal, analysis was repeated setting the limit at <40 E%. In the IG, the proportion of individuals obtaining <40 E% from fat appeared to increase from 25·8 % at first visit to 48·4 % at the last visit. For the CG, this proportion seemed to rise from 23·1 % at first visit to 34·6 % at the last visit. Both within-group changes and between-group differences were statistically not significant (Table 5).
Only one individual in the IG met the goal of consuming ≥15 g fibre/4184 kJ (1000 kcal; Table 5). When the analysis was repeated setting the limit at ≥10 g fibre/4184 kJ (1000 kcal), an increase in the proportion of individuals meeting this goal was seen in the IG (32·3 % at visit 1 to 45·2 % at visit 3), whereas a decrease was observed in the CG. Within-group changes and between-group differences were statistically non-significant (Table 5).
Self-efficacy scores for diet increased from 4·8 to 5·6 in the IG and from 4·2 to 4·6 in the CG. However, between-group differences were statistically non-significant.
Discussion
Key findings
The main finding in the present study is the trend towards a decrease in mean daily intake of energy and in daily absolute intakes of carbohydrate, sucrose and total fat in the IG. The predefined study goals relating to intake of total fat (<30 E%) and dietary fibre (≥15 g fibre/4184 kJ (1000 kcal)) were met by very few individuals in the IG. The proportion of individuals meeting the modified study goal relating to fat intake (<40 E% from fat) tended to increase in the IG from the first to the last visit (statistically non-significant). There were no statistically significant differences in change over time between the CG and the IG.
Another important finding is the excessive consumption of total fat among ME immigrants, that contributes approximately 40 % to energy intake.
Interpretation of findings
Favourable trends in intakes of energy and macronutrients in the IG indicate the potential to modify dietary intake in ME immigrants using this culturally adapted lifestyle intervention programme. We did not perform a post hoc power calculation; however, the sample size was probably too small to observe any statistically significant changes.
We have previously reported reduction in body weight and LDL cholesterol and improvement in insulin sensitivity in the IG compared with the CG( Reference Siddiqui, Kurbasic and Lindblad 20 ). The trends in dietary intake observed in the IG in the present study support our earlier findings as reduction in fat and carbohydrate intake has been associated with weight loss( Reference Nordmann, Nordmann and Briel 35 ), lowered LDL cholesterol( Reference Clifton, Colquhoun and Hewat 36 ) and improved insulin sensitivity( Reference Riccardi, Giacco and Rivellese 37 ) in previous studies. It is plausible that the decrease in absolute intakes of fat, carbohydrate and sucrose led to a decrease in total energy intake, leading in turn to the observed weight reduction in the IG. It is important to mention that the size of observed changes in percentage of energy contributed by macronutrients, particularly fats, was rather small. There was a trend towards decrease in absolute intakes of both fats and sucrose, which might explain the small changes in dietary composition (percentage of energy from fats and sucrose).
High intake of dietary fats is associated with an increase in body weight and body fat( Reference Bray and Popkin 38 ) as well as with increased risk of T2D( Reference Hu, van Dam and Liu 39 ). The high fat intake, in combination with low levels of PA among ME immigrants, can contribute to increased risk and high levels of cardiovascular morbidity associated with obesity and T2D in this immigrant group( Reference Bennet, Agardh and Lindblad 40 ). The energy contribution from fat in the participants was higher than the mean intake of 34 E% in Sweden( 41 ).
The decreased intakes of energy, carbohydrate and total and saturated fats over time among the study participants, irrespective of group status, indicates that participation in the study had a favourable effect on the dietary intake of participants even if they did not receive a full intervention. The CG might have made similar changes in their dietary intake as the IG, in response to the general information received during the study. The increase in self-efficacy scores indicates that the participants felt more confident about their ability to make changes in their diet. Considering the study aims and the small sample size, splitting the analysis to study change per month in each group was not plausible.
The results from our study indicate that despite their increased risk for obesity-related diseases, like T2D and CVD( Reference Bennet, Groop and Lindblad 19 ), it could be very difficult to modify dietary habits and reduce energy intake among ME immigrants. Therefore, research should focus on identifying barriers to healthy eating and on identifying components that make these interventions more effective in terms of changing the dietary habits of immigrant groups.
Comparison with other studies
To the best of our knowledge, only one earlier lifestyle intervention study in the USA, comprising seventy-one participants, has addressed ME immigrants’ dietary habits. Using the 24 h dietary recall method, that study reported a high average fat intake corresponding to 41 E% at baseline, which is comparable to our study. In addition, it reported a reduction in total energy as well as total and saturated fat intakes following a 24-week lifestyle intervention although it lacked a CG with which to compare the changes in the IG( Reference Jaber, Pinelli and Brown 42 ). A similar trend was observed in the IG in our study, although it could not reach statistical significance compared with the CG probably because of small sample size. The two studies were conducted in different countries and the participants could differ in terms of socio-economic factors and motivational level, which might explain the difference in findings.
Findings relating to dietary changes from randomised controlled trials conducted among immigrants are difficult to compare for several reasons. First, immigrant groups differ widely in their dietary habits, and nutritional intake is also affected by socio-economic status and the situation in the host country( Reference Freimer, Echenberg and Kretchmer 43 , Reference Gilbert and Khokhar 44 ). Second, different studies use different measures of dietary intake such as structured FFQ, 24 h dietary recalls or food diaries, making it difficult to compare the changes in dietary intake.
Although no study has focused solely on dietary habits in ME immigrants, a systematic review of changes in dietary habits among ethnic groups in Europe highlighted that dietary intake among immigrant groups relates closely to social interactions, cultural identification and religious values( Reference Gilbert and Khokhar 44 ). There is a lack of evidence from longitudinal studies (in different ethnic groups) and thus there is a need to better understand dietary patterns and habits of these different ethnicities( Reference Gilbert and Khokhar 44 ). The high daily intakes of fat and carbohydrate (g/d) at baseline in our participants, compared with an earlier cross-sectional study on ME women in Sweden using a repeated 24 h dietary recall, highlight the need to focus on excessive fat intake as a component of dietary modification in this group( Reference Daryani, Basu and Becker 45 ). In addition, low fibre consumption needs to be addressed as both fat and fibre intakes closely relate to T2D risk( Reference Weickert and Pfeiffer 46 ).
Strengths and limitations
To the best of our knowledge, no previous studies in Europe have attempted to capture dietary habits of ME immigrants using a 4 d dietary record or to evaluate effects of a culturally adapted lifestyle intervention on dietary intake in this fastest-growing immigrant group in Europe. Further strengths of the study are the randomised design and the collection of dietary data at three time points during the study period.
One potential limitation is the misreporting of nutritional intake. The percentage of energy from sucrose in our study participants was about 5 %, which is lower than the mean intake of 8 E% from sucrose in Sweden( 41 ). This could possibly be explained by an under-reporting of sugary food intake by the participants. Studies have shown that foods perceived as unhealthy are often under-reported in dietary assessments( Reference Lafay, Mennen and Basdevant 47 ). In addition, immigrants( Reference Daryani, Kocturk and Andersson 48 ) and overweight( Reference Pryer, Vrijheid and Nichols 49 ) individuals tend to under-report their energy intake. Unconscious under-reporting of sugars could also be a consequence of cultural differences. For example, in ME culture sugar is routinely added to tea; however, that was not reported explicitly in dietary diaries.
Although 4 d food records, as used in our study, are considered one of the best methods for dietary assessment, accurate food records are difficult to achieve in immigrant groups as they lack information on cultural practices relating to food preparation and under-report nutritional intake( Reference Kruger, Stonehouse and von Hurst 50 ). There is a need for validation of these instruments in immigrant populations. One study, conducted on South Asian immigrants in Australia, reported that quality of data collected through food records can be improved by incorporating ‘in-depth probing interviews’. These interviews provide useful information regarding the method of preparation and aid in identifying the ‘hidden sources of fat and energy’( Reference Kruger, Stonehouse and von Hurst 50 ). It is important to consider that the 4 d food records did not necessarily include a weekend day, which is a limitation. However, considering the high levels of unemployment in the study participants, it is not expected that dietary intake differed widely between weekdays and weekends.
Another limitation was the relatively short duration of our study. The intervention was culturally adapted and addressed social and cultural barriers to lifestyle change but it was probably not easy for individuals to overcome these barriers to healthy eating in a short period of 4 months. In addition, the participants were asked to attend health examinations with short intervals, whereas the IG required additional visits to attend group sessions and the provided cooking class. This also contributed to high dropout rates in our study as reflected in feedback from the participants.
Although we addressed family involvement by recruiting couples in our study, the intervention might have been more effective with greater involvement of other family members in the process as observed in the study on ME immigrants in the USA, where family members were invited to participate in the study-related activities( Reference Jaber, Pinelli and Brown 42 ). A culturally adapted lifestyle intervention among South Asian women in Norway reported that food preferences of other family members played an important role in dietary change( Reference Raberg Kjollesdal, Telle Hjellset and Bjorge 51 ). However, the role of family involvement needs to be explored further in ME immigrants.
To conclude, our study has added to the understanding of ME dietary habits. It has highlighted the issues with dietary assessment and modification in ME immigrants. In the future, the quality of dietary data can be enhanced by combining food records with interviews to get a better understanding of dietary intake. Moreover, interventions with longer duration can likely help individuals gradually overcome barriers to dietary changes. Our participants appreciated the cooking class and a similar approach could be used more extensively in future interventions. Similarly, involving family members to a greater extent can be expected to have positive consequences on achieving dietary goals.
Acknowledgements
Acknowledgements: The authors are indebted to late Professor Carl-David Agardh (Lund University, Sweden) and Professor Marilyn Winkleby (Stanford University, USA). They are also thankful to the health coaches Muna Mohamud and Iman Yousif, study nurses Saranda Muhaxheri, Josefin Goode Khan and Asma Saleh, and study co-ordinator Sonja Ruhnke (all from Lund University, Sweden). The authors are grateful to Patrick Reilly, Centre for Primary Health Care Research, for language editing of the manuscript. Financial support: This study was funded by Lund University ALF grant Skåne (grant numbers 20101641, 20101837 and 162641); Region Skåne (grant numbers 226661 and 121811); Malmö Stad; The Swedish Society of Medicine (grant numbers SLS97081 and 176831); the Crafoord Foundation (grant number 20110719); and donation from Novo Nordisk Scandinavia AB. The funders had no role in study design, data collection or manuscript preparation. Conflict of interest: None. Authorship: F.S. contributed to the conduction of the study, compiled the data, performed descriptive analysis of the data and wrote the manuscript. V.W. compiled the dietary data using Dietist XP software and contributed to the descriptive analysis as well as writing of the manuscript. A.K. did the statistical analysis. K.B.L. conducted the group sessions and contributed to the writing of the manuscript. P.M.N. provided input on conduction of the trial as well as to the discussion and reviewed the manuscript. E.S. and S.L. contributed to the discussion and reviewed the manuscript. L.B. designed the trial, led the conduction of the trial, data acquisition and analysis of the data, and participated in writing the manuscript. All authors reviewed and edited the manuscript and approved the final version. Ethics of human subject participation: The study was conducted in accordance with the guidelines defined in the Declaration of Helsinki. Written informed consent was obtained from all study participants. The study protocol was approved by the Ethical Review Board of Lund University, Sweden (approval number 2011/88). (Trial registration number: NCT01420198)


