


Introduction
Chemical studies of snow are important because snow and glaciers, as sites of deposition of chemical components of the atmosphere, can provide crucial information about climatic and environmental changes (Reference Johnsen, Dansgaard, Clausen and LangwayJohnsen and others, 1972; Reference Barrie, Fisher and KoernerBarrie, 1985; Reference Holdsworth and PeakeHoldsworth and Peak, 1985; Reference JouzelJouzel and others, 1987; Reference Haeberli, Schmid and WagenbachHaeberli and others, 1988; Reference Yao, Shen and YangYao and others, 1993; Reference Huang, Duan and LiHuang and others, 1998; Reference Kang, Qin, Mayewski, Wake and RenKang and others, 2000b, Reference Kang, Mayewski, Qin, Sneed, Ren and Zhang2004; Reference He, Zhang, Theakstone, Chen, Yao and PangHe and others, 2003). In general, ions in snow- and glacier-covered areas reflect the influence of both atmospheric circulation patterns and the local and regional environment. Identification of the origins of the ions present in snow may provide information about changes in the atmosphere, lithosphere, hydrosphere and cryosphere.
The monsoonal temperate glaciers of China are located in the Hengduan and Daxue mountains, the eastern part of the Himalaya, and the central and eastern segments of the Nyainqentanglha range, in the southeastern part of the Qinghai-Tibetan Plateau (Reference PuPu, 1994; Reference Li, He and JiaLi and others, 2008a). These areas have a mean annual temperature of about −6°C. The annual precipitation is high (1000–3000 mm) and the snowline, at 4200–5200 m a.s.l., is 800–1200 m lower than that of the continental glaciers of the western Qinghai-Tibetan Plateau. Relatively few studies of snow chemistry have been carried out at the glaciers (Reference LiLi and others, 2008b), which have been subject to intense ablation and accelerating retreat during the last 100 years against a background of global warming (Reference He, Zhang, Theakstone, Chen, Yao and PangHe and others, 2003).
Snow accumulation on the glaciers is influenced by both the summer and winter monsoons. The markedly different trajectories of the air masses responsible for snow deposition in summer and in winter result in very different snowpack chemistries, as is shown in this paper. Any changes in the patterns of the monsoonal climate regime will have major effects on much of southeast Asia. Accordingly, it is important to monitor the glaciers in relation to the climatic conditions.
Study Area
Yulong mountain (5596 m a.s.l.), in the southern part of the Hengduan mountains (27°10′−27°40′ N, 100°09′−100°20′ E), is the southernmost region in mainland Eurasia where glaciers exist. Subtropical spruce forest at lower altitudes is succeeded at higher elevations by alpine meadow, tundra and glacial zones. The 19 glaciers on Yulong mountain cover an area of 10.86 km2 (Fig. 1). The largest, Baishui glacier No. 1, is 2.7 km long and has an area of 1.52 km2. The accumulation area (1 km2) is relatively flat (Fig. 1). Crevasses are widespread on the glacier tongue. The elevations of the equilibrium line and the glacier front are about 4800 and 4200 m, respectively.
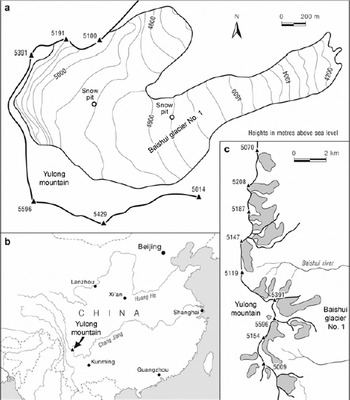
Fig. 1. (a) Location of snow pits at Baishui glacier No. 1 , May 2006. (b) Glaciers of the southern part of the Hengduan mountains. (c) Location of Yulong mountain in China.
As it is situated at the margin of the Qinghai-Tibetan Plateau, Baishui glacier No. 1 has a very complex environment influenced by interacting atmospheric circulations. The regional climate is dominated by the southeast and southwest monsoons, the Qinghai-Tibetan Plateau monsoon and the westerlies. Human activity in the vicinity of the glacier is considerable, the area having been developed as a tourism/economic region since the 1980s.
Climate
The mean annual precipitation at Yulong mountain is about 2000 mm, but there are considerable altitudinal differences. At the highest altitudes, most of the precipitation falls as snow. Up to 90% of the total falls during the summer (Reference Su, Liu, Wang and ZhongSu and others, 2001), when warm moisture-rich air masses associated with the southwest monsoon reach the area from the Indian Ocean. The winter monsoon, with a continental origin, controls the relatively dry winter climate, which is also influenced by the southern branch of the westerlies. Marine aerosols associated with the summer monsoon, and dust brought from central Asia by the winter monsoon, are present in the snow that accumulates on Baishui glacier No. 1.
The mean annual temperature of the Yulong mountain area is −3.7°C (Reference Su, Liu, Wang and ZhongSu and others, 2001). Based on upper air-temperature data, the calculated mean annual temperature at 5400 m a.s.l. is −7.5°C; the monthly mean temperature at that altitude generally is below 0°C throughout the year. At the mountain foot (3240 m a.s.l.), the mean annual temperature is 5.4°C and there is a 3 month long winter.
Sample Collection
Logistical and time constraints limited the sampling that could be undertaken at Baishui glacier No. 1 in May 2006 and a decision was made to collect samples at two sites, one in the accumulation area and one in the heavily crevassed ablation area. Most previous studies of the snow cover had been confined to the accumulation area (Reference He, Yao and YangHe and others, 2000, 2001, 2002a,b; Reference Pang, He, Theakstone and ZhangPang and others, 2007). Since both the accumulation area and the ablation area are small, sites that were likely to be reasonably representative of conditions above and below the equilibrium line were identified. The aims were to determine whether there were differences in the chemical composition of the snow at the two sites separated by 150 m altitude, to assess the degree to which the chemistry was influenced by local, as against distant, sources of material, and to examine the differences in wet (summer) and dry (winter) season events at Baishui glacier No. 1.
Forty samples, each 10 cm long, were collected from a snow pit at 4900 m a.s.l. A marked dusty layer, about 2.5 m below the surface, was interpreted as having been at the upper surface of the snow when the 2005/06 winter accumulation started, the underlying snow having been deposited by the 2005 summer monsoon. In the ablation area of the glacier, 34 samples were taken at a site at 4750 m, where glacier ice was at a depth of 3.4 m. Extreme care was taken at all times to ensure that samples were not contaminated during collection and handling. Non-particulating suits, polyethylene gloves and masks were worn during sampling, and pre-washed high-density polyethylene (HDPE) containers were used as sample scoops. Field blanks were collected, filled with ultra-pure water in the laboratory, opened during sample collection and handled as samples. Samples were kept frozen in the field, during transportation and in the laboratory until analysis. Analysis of duplicate samples, as well as of field and laboratory blanks, indicated that sample contamination during collection, transport and subsequent analytical procedures was negligible.
Sample Analysis
Before analysis, samples were stored in a −15°C cold-chamber in the State Key Laboratory of Cryosphere Science, Cold and Arid Regions Environment and Engineering Research Institute, Chinese Academy of Sciences. Cations were analyzed in the laboratory with a Dionex-600 ion chromatograph, and anions with a Dionex-300 ion chromatograph. The analytical precision may reach 10−9 g mL−1 and the standard deviation is < 5% (Reference Huang, Duan and LiHuang and others, 1998).
Trajectory Analysis
Back-trajectory analysis has been applied widely in the field of atmospheric and glaciological sciences (Reference Kahl, Martinez, Kuhns, Davidson, Jaffrezo and HarrisKahl and others, 1997; Reference Raben, Theakstone and TørsethRaben and others, 2000; Reference TheakstoneTheakstone, 2008). The Hybrid Single-Particle Lagrangian Integrated Trajectory model, HYSPLIT4 (Air Resources Laboratory, US National Oceanic and Atmospheric Administration (NOAA) http://www.arl.noaa.gov/ready/hysplit4.html), which has been used to model air-mass trajectories elsewhere (Reference Falkovich, Ganor, Levin, Formenti and RudichFalkovich and others, 2001; Reference Asaf, Nativ, Hassan, Shain, Geyer and ZivAsaf and others, 2005; Reference RamachandranRamachandran, 2005; Reference MarencoMarenco and others, 2006), was used to compute back-trajectories to Baishui glacier No. 1 (27.33° N, 100.25° E; 4500–5500 m a.s.l.), using NOAA/ US National Centers for Environmental Prediction (NCEP) reanalysis meteorological data. Reference Langner and RodheLangner and Rodhe (1991) estimated that the average lifetime of sulphate aerosols is about 5 days, whilst Reference Rasch, Collins and EatonRasch and others (2001) suggested that the aerosol lifetime during the Indian Ocean Experiment (INDOEX) was 7–8 days. Accordingly, the compromise of 6 day back trajectories with a daily resolution was adopted to simulate the routes of air masses arriving at the sampling site at 1200 h Beijing time (0400 UTC).
Results
Mean concentrations of most ions in the snow were higher at 4750 m than at 4900 m (Tables 1 and 2). The large variations in ionic concentrations at both sites were reflected in high values of the coefficient of variation. At the 4900 m site, there were evident differences in the chemistry of the snow above and below the 2005 summer surface, 1.4–1.5 m above the base of the column (Fig. 2). Visual inspection of the ionic data from the site at 4750 m suggested that the composition of the lowest 0.9 m of the snow column differed from that of the uppermost 2.5 m (Fig. 3); concentrations of Ca2+ were lower in the upper part than in the lower part, but other ionic concentrations were higher in the upper part (Table 2).
Table 1. Ionic concentrations (ppb) at 4900 m a.s.l. Top: the whole column. Middle: the uppermost 2.5 m, above the 2005 late-summer surface. Bottom: the lowest 1.5 m. The coefficient of variation (CoV; standard deviation/mean) is a measure of variability

Table 2. Ionic concentrations (ppb) at 4750 m a.s.l. Top: the whole column. Middle: the upper 2.5 m. Bottom: the lowermost 0.9 m. The coefficient of variation (CoV; standard deviation/mean) is a measure of variability


Fig. 2. Ionic concentrations (ppb) in the snow at 4900 m on Baishui glacier No. 1, May 2006. The 2005 summer surface, about 1.5 m above the bottom of the snow pit, is indicated by a horizontal line.

Fig. 3. Ionic concentrations (ppb) in the snow at 4750 m on Baishui glacier No. 1, May 2006. The inferred position of the 2005 summer surface, about 0.9 m above the underlying glacier ice, is indicated by a horizontal line.
Analysis of variance demonstrated that, when the ionic concentrations in the whole snow column at 4900 m were compared with those at 4750 m, only the concentration of Cl− was significantly different (Table 3). However, at 4900 m, concentrations of Na+, K+, Mg2+ and Ca2+ in the residual snow from the 2005 summer monsoon season differed significantly from those in the overlying 2005/06 winter snow; differences in the SO4 2−, Cl− and NO3 − concentrations were not statistically significant. In contrast, at 4750 m, only the Ca2+ concentrations in the two parts of the pack differed in a statistically significant manner (Table 3). Comparison of the residual snow from the 2005 monsoon season at the two sites indicated that Na+, K+ and Ca2+ concentrations differed significantly and Cl−, NO3 −, SO4 2− and Mg2+ concentrations did not. Differences in Cl−, Mg2+ and Ca2+ concentrations in the snow deposited during the 2005/06 winter at the two sites were statistically significant; those of NO3 −, SO4 2−, Na+ and K+ were not (Table 3).
Table 3. Statistically significant differences in ionic concentrations in the snow at two sites on Baishui glacier No. 1, May 2006 (x)

Back trajectories of the air masses arriving at Baishui glacier No. 1 indicated that the 2005 summer monsoon started in late June or early July; prior to that, trajectories had crossed the northern part of the Indian subcontinent (Fig. 4a and b). The wet-season trajectories generally were from the Indian Ocean or the Pacific Ocean, across industrial areas in south Asia, southeast Asia and south China (Fig. 4c–f). Air masses bringing dust to the glacier in the 2005/06 dry winter season generally travelled from one of three directions: from central/west Asia, from Africa or from the Thar Desert area (Fig. 5).

Fig. 4. Six day trajectories of air masses arriving at Baishui glacier No. 1 (marked by the star): (a) 7 May 2005, (b) 21 June 2005, (c) 7 July 2005, (d) 14 August 2005, (e) 21 September 2005 and (f) 7 October 2005.

Fig. 5. Six day trajectories of air masses arriving at Baishui Glacier no. 1 (marked by the star): (a) 7 November 2005, (b) 28 December 2005, (c) 14 January 2006, (d) 14 February 2006, (e) 13 March 2006 and (f) 28 April 2006.
Discussion
Ion sources
Snow is deposited on Baishui glacier No. 1 in both the winter and the summer. Ions in the snow have both marine and terrestrial sources, are supplied by both dry and wet deposition, and undergo changes of stratigraphic concentrations and relationships within the snow as a result of ablation and elution. In summer, the southwest monsoon from the Indian Ocean brings marine aerosols, and SO4 2− and NO3 − are provided by pollutants associated with the many industrial sites in south Asia, southeast Asia and south China. At the same time, surface ablation results in meltwater percolation, accompanied by selective elution of ions within the snow. The winter monsoon, with a continental origin, brings dust from central Asia and from distant areas to the west.
Reference Wake, Mayewski, Li, Han and QinWake and others (1994), reporting studies in four regions in central Asia, concluded that the principal control of spatial variations in snow chemistry was the influx of desert dust from the arid and semi-arid regions of Asia. High Ca2+ and Mg2+ concentrations on the southeastern Tibetan Plateau reflect the role of spring dust storms (Reference Wake, Mayewski, Xie, Wang and LiWake and others, 1993; Reference Kang, Wake, Qin, Mayewski and YaoKang and others, 2000a,Reference Kang, Qin, Mayewski, Wake and Renb). At glaciers close to, and down-wind of, large desert basins, concentrations of major ions in snow samples are high; at glaciers distant from source regions of dust, they are significantly lower. The lowest values reported by Reference Wake, Mayewski, Li, Han and QinWake and others (1994) were from Ngozumpa glacier, on the southern slopes of the eastern Himalaya, where precipitation is from monsoonal air masses during the summer and from westerly depressions during the winter: strata with high particle concentrations are deposited twice each year. However, Reference Wake, Mayewski, Li, Han and QinWake and others (1994) concluded that the Himalaya are a barrier to dust transport and that dust generated in southwest Asia is not transported far enough eastwards to affect the eastern Himalaya.
Baishui glacier No. 1 is approximately 1250 km east of Ngozumpa Glacier. Limestone is widely exposed on Yulong mountain (Reference Li and SuLi and Su, 1996). Reference He, Yao, Theakstone, Cheng, Yang and ChenHe and others (2002b) reported that the concentrations of Ca2+ and Mg2+ in a 10.10 m core collected at 4950 m on Baishui glacier No. 1 in 1999 were much higher than those of Na+. They concluded that this finding reflected the non-marine source of most of the impurities in the accumulation area of the glacier. Reference He, Theakstone, Yao, Chen and ZhangHe and others (2002a) suggested that ions were carried to the site as moist air moved up the mountain slopes under the control of the monsoon. Values of δ18O indicated that the uppermost 7.8 m of the core represented five annual increments of net accumulation; cationic concentrations peaked at identifiable summer surfaces (Reference He, Yao, Theakstone, Cheng, Yang and ChenHe and others, 2002b). In 2004, a firn profile, 18.3 m deep and including 13 annual layers, was sampled at 4900 m on Baishui glacier No. 1 (Reference Pang, He, Theakstone and ZhangPang and others, 2007). Dust layers generally coincided with late-summer surfaces. Three sources of the ionic material in the profile were identified: (1) material of marine origin transported to the area by the southwest monsoon; (2) crustal materials from the local area; and (3) pollutants produced by industrial and agricultural activities in south Asia.
Seasonal deposition of snow at Baishui glacier No. 1
It is evident that the snow sampled in May 2006 at both 4900 and 4750 m on Baishui glacier No. 1 was deposited in two distinct seasons. At the higher site, the lowermost 1.5 m was residual material from the net accumulation of the 2005 summer monsoon; the late-summer surface was represented by the prominent dusty layer. The overlying 2.5 m of snow was deposited during the 2005/06 winter. The summer monsoon brings marine aerosols to Baishui glacier No. 1 with associated high concentrations of Na+, K+ and Cl−. Particularly high concentrations of these ions were present around mid-depth in the residual snow of the monsoon season (Fig. 2). Summer ablation and the accompanying elution of ions must have been responsible, at least in part, for the low concentrations of SO4 2− and NO3 − in the residual snow compared with their concentrations in the overlying winter snow (Table 1). The high Ca2+ and Mg2+ concentrations must be influenced by their local source as crustal materials, but also are likely to reflect their less rapid elution: Reference Tsiouris, Vincent, Davies and BrimblecombeTsiouris and others (1985) reported that the preferential order of elution of ions was SO4 2− > NO3 − > K+ > Ca2+ > Mg2+ > Na+ > Cl−. Concentrations of Ca2+ and Mg2+ were particularly high within and immediately below the dirty layer that characterized the 2005 summer surface (Fig. 2).
Non-marine dust is a major ion source for the snow which accumulates during the winter season at Baishui glacier No. 1. SO4 2−, NO3 − and Cl− originate from terrestrial dust, in part sourced from desert areas and in part from saline lakes (Reference He, Yao and TheakstoneHe and others, 1999, Reference He, Yao and Yang2000, Reference He, Yao and Cheng2001; Reference Xiao, Qin, Ren, Li and WangXiao and others, 2002; Reference Kang and CongKang and Cong, 2006). The high correlations between these ions in the upper 2.5 m of the snow at 4900 m a.s.l. (r = 0.92, 0.92 and 0.86 for NO3 − and Cl−, NO3 − and SO4 2−, Cl− and SO4 2−, respectively) reflect their common source in North Africa and the Indian subcontinent (Fig. 5).
At the 4750 m site, about 0.9 m of snow remained from the 2005 monsoon season, with about 2.5 m having been deposited during the 2005/06 winter. High Ca2+ and Mg2+ concentrations again were present at the summer surface (Fig. 3). The peaks of Na+ and K+ evident in the residual snow at 4900 m (Fig. 2) were absent from that at 4750 m (Fig. 3). Ablation rates are likely to have been somewhat higher at 4750 m than at 4900 m, with correspondingly greater elution of ions. Hence, the difference in the chemical composition of the residual summer-accumulated snow at the two sites in May 2006 is likely to reflect these effects, rather than a significant difference in the original snowfall.
Whilst the chemical stratigraphy of the winter-accumulated snow at 4750 m differed in some respects from that at 4900 m (Figs 2 and 3), the only statistically significant differences were those of Cl−, Mg2+ and Ca2+ concentrations. Up-valley winds bringing crustal material from limestone exposed at lower altitudes may have contributed to the higher concentrations at the lower site.
Conclusions
Snow accumulates on Baishui glacier No. 1 in the summer, when the southwest monsoon brings marine aerosols from the Indian Ocean, accompanied by pollutants from the industrial areas between the ocean and the glacier. Ablation of the snow is accompanied by elution of ions, but stratigraphical differences in snowpack chemistry are not totally eliminated before the onset of winter. The ionic composition of the snow that accumulates in winter is influenced by the source areas to the west, which include the deserts of North Africa and the northern part of the Indian subcontinent; terrestrial dust supplies SO4 2−, NO3 − and Cl−. Local sources are responsible in part for the high Ca2+ and Mg2+ concentrations in the snow at Baishui glacier No. 1, limestone being widely exposed on Yulong mountain. Comparison of the residual snow from the preceding summer monsoon season in the accumulation area, at 4900 m, and in the ablation area, at 4750 m, revealed differences, but these probably reflected local differences of ablation and elution rates rather than differences in ion supplies to the two sites. Differences in the chemical composition of the snow that accumulated at the two sites during winter were restricted to Cl−, Mg2+ and Ca2+ concentrations. This may reflect the influence of up-valley winds bringing more crustal material to the lower site.
Acknowledgements
This study was jointly supported by the Important Directionality Natural Science Foundation of Chinese Academy of Sciences, No. KZCXZ-YW-317, National Key Natural Science Foundation, No. 90511007, National Basic Research Program of China (No. 2007CB411201), a West Light Foundation of Chinese Academy of Sciences (O828A11001) and the Innovative Research International Partnership Project, Chinese Academy of Sciences, No. CXTD-Z2005-2. We gratefully acknowledge the NOAA Air Resources Laboratory for the provision of the HYSPLIT transport and dispersion model and/or READY website (http://www.arl.noaa.gov/ready.html) used in this publication. We are grateful to N. Scarle for drafting the figures. Comments by the Chief Editor and two anonymous referees which helped improve the paper are much appreciated.


