


Prevalence rates of underweight in children, low BMI (weight in kilograms divided by the square of height in metres) in adult women and low birth weight in newborns are considerably higher in South Asia in comparison with sub-Saharan Africa (Table 1(1–Reference Stoltzfus5)). At the same time, for a number of factors generally assumed to be strongly associated with the nutritional conditions in a country or region, South Asia fares better than sub-Saharan Africa. Thus, the under-fives and maternal mortality rates in South Asia are on average almost half of those of sub-Saharan Africa, while literacy rates or other educational indicators are considerably better in most South Asian countries. Regarding overall per capita income, South Asia and sub-Saharan Africa are at comparable levels, while per capita energy availability is higher in South Asia. The only indicator in Table 1 where, apart from the anthropometric indicators, South Asia has a less favourable record than sub-Saharan Africa is the prevalence of anaemia in women. These seemingly contradictory results were described in the mid-1990s as the ‘Asian enigma’(Reference Ramalingaswami, Jonsson and Rohde6). In Ramalingaswami et al.’s frequently quoted contribution, the poor nutritional status of South Asian children and women is attributed, at least partially, to the widely occurring phenomenon of female discrimination and the overall poor status of women in this part of the world.
Table 1 The Asian enigma

*Definitions of regions may vary slightly by data source.
†Data from World Bank (2006)(1); result for sub-Saharan Africa is a population-weighted average for thirty-six countries, results for other regions directly from the source.
‡Data from Macro International Inc. (2007)(2); for each region the population-weighted average is based on those countries for which Demographic Health Survey results are available; when China excluded, result for East Asia & Pacific 16·4 %.
§Data from UNICEF (2006)(3).
||Data from FAO (2003)(4), 1997/1999.
¶Data from Stoltzfus (2003)(Reference Stoltzfus5) (see also Table 7).
In subsequent publications reference has frequently been made to the occurrence of nutritional neglect and poor nutritional conditions of women in South Asia(Reference Osmani and Sen7, Reference Fikree and Pasha8). In one study it was concluded that it is not so much the absolute level of women’s status that determines children’s and adult women’s nutritional condition, but more the relative social position of women compared with men(Reference Smith, Ramakrishnan, Ndiaye, Haddad and Martorell9). However, it is also important to note that, in most studies in which quantitative assessments have been made, a large part of the differences between the nutritional status of children and adults from South Asia and other developing regions remains unexplained.
The purpose of the present paper is to shed some further light on the Asian enigma, and its possible explanation. There are two main reasons for undertaking this exercise. First, for some countries outside South Asia but which are home to considerable numbers of people of Asian descent, ethno-specific information is available on most variables of relevance, including nutrition, health, education and other indicators related to standard of living. This allows for a comparison of anthropometric results in population groups from different ethnic backgrounds but living under largely similar environmental and public health conditions. Second, while in the past information on the nutritional status of adults was largely restricted to women, in recent years information is increasingly becoming available on the nutritional status of men. This gives the opportunity to study in some detail the occurrence of gender differentials in as far as this concerns nutrition. In particular, the question can be addressed whether higher rates of low BMI in South Asia compared with other developing regions are applicable only for adult women or for both men and women.
The structure of the paper is as follows. After a brief section on data sources and methods, the possibility of an ethnically determined component in undernutrition prevalence rates is investigated on the basis of anthropometric data in adults from countries that are home to sizeable population segments of different ethnic descent, including people from Asian and African descent. In the section that follows it is explored, using limitedly available data on the nutritional status of adult males and females in South Asian and sub-Saharan African countries, whether there are significant gender differences in the prevalence of undernutrition. After a discussion section, the paper ends with conclusions.
Data sources and methods
Nutritional status of people from different ethnic backgrounds
Literature has been reviewed to identify data sets which provide information on nutritional status and undernutrition prevalence rates among population groups of different ethnic descent living in the same country. The main criterion for including a data set was that it contained anthropometric information on population groups from both Asian and non-Asian descent. A second criterion was that the data set included some information on mean levels of standard of living for the various population segments. The countries for which such data sets could be identified are South Africa, Fiji and the USA. For the literature review, use was made of the PubMed database, while also websites from international organizations, such as WHO and FAO, were consulted. Furthermore, use was made of general Internet search engines such as Google and Yahoo!, which made it possible to identify national health or nutrition reports, or other relevant studies which were not covered by the PubMed system.
Assessment of gender differences in nutritional status of adults
Literature has been reviewed to identify data sets which provide information on undernutrition prevalence rates among male and female adults. BMI is generally accepted as the main indicator of overall adult nutritional status, with a BMI of 18·5 kg/m2 as the most commonly used cut-off point below which individuals are classified as undernourished(10). For assessing possible differences between the nutritional status of male and female adults, the first criterion for a data set to be included was a sample size of at least 1000 individuals. As an exception, one data set on Sri Lanka with a sample size of 823 was also included as no larger suitable sample could be identified. Furthermore, in selecting data sets preference was given to results for low-income, often rural, population segments, as these are the population groups where undernutrition is generally highest. It may be noted that large-scale nationally representative surveys providing information on the nutritional status of both male and female adults are poorly available. For assessing possible gender differences in nutritional status, use has also been made of limitedly available data on the occurrence of micronutrient deficiencies (iron-deficiency anaemia, vitamin A deficiency, zinc deficiency) in males and females.
Results
Nutritional status of population groups from different ethnic background living in the same country
South Africa
Table 2(Reference Puoane, Steyn, Bradshaw, Laubscher, Fourie, Lambert and Mbananga11–Reference Rose and Charlton13) provides information on undernutrition prevalence rates among children and adults for four population groups living in South Africa: Africans (blacks), whites, Indian/Asian people and coloured people (mixed ethnic background). Information is also presented on two nutrition-related economic parameters (total household food expenditures and the percentage of households below the food poverty line).
Table 2 Undernutrition, food expenditures and food poverty, by ethnic group in South Africa
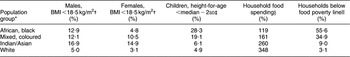
*African: ancestry from the African continent; Mixed, coloured: mixed heritage including aboriginal (Koi, San), Malay, European and African; Indian/Asian: ancestry from South and South-East Asia, primarily the Indian subcontinent; White: European ancestry.
†Adults, 15 years and over; data from Puoane et al. (2002)(Reference Puoane, Steyn, Bradshaw, Laubscher, Fourie, Lambert and Mbananga11).
‡Children <5 years of age; data from WHO (2006)(12).
§Household food spending as a percentage of the poverty line; data from Rose and Charlton (2002)(Reference Rose and Charlton13).
||Percentage of households below the food poverty line; data from Rose and Charlton (2002)(Reference Rose and Charlton13).
The table shows that out of the four population groups, the prevalence of undernutrition in children aged 0–5 years is highest among children in black African households. In line with this result is the fact that for these households, in comparison with the other population groups, the mean level of household food expenditures is lowest, while the percentage of households in food poverty is highest. However, when considering the results on the prevalence of low BMI in adults (BMI < 18·5 kg/m2), Table 2 shows that the highest prevalence rate is among men and women belonging to households of Indian/Asian descent, this despite the fact that these households have a much higher level of food expenditure than black African households and also despite the fact that the percentage of households in food poverty is much lower. Also with respect to other socio-economic characteristics, such as employment and education, both males and females of Indian/Asian descent are better off than black Africans and also better off than the population group of mixed ethnic background (Table 3(14, 15)).
Table 3 Employment and educational records for men and women in four population groups in South Africa

*African: ancestry from the African continent; Mixed, coloured: mixed heritage including aboriginal (Koi, San), Malay, European and African; Indian/Asian: ancestry from South and South-East Asia, primarily the Indian subcontinent; White: European ancestry.
†Unemployment rates in adults, aged 20 years and older, average for September 2003 and March 2004; data from Statistics South Africa (2004)(14).
‡Calculated from data in Statistics South Africa (2006)(15).
Thus, available data on undernutrition prevalence rates in four ethnically different population groups in South Africa reveal the highest level of child undernutrition among black African households, but the highest levels of low adult BMI among adult males and females from Indian/Asian households. The relatively high percentages of individuals, males and females, with low BMI in Indian/Asian households cannot be explained on the basis of a low level of access to food in these households, or on the basis of other socio-economic characteristics.
Fiji
The two main population groups living in Fiji (South Pacific) are the indigenous Fijians and the Indo-Fijians. Table 4(16–18) shows that there are large differences in nutritional status between these two population groups, with high levels of low weight-for-age and low BMI among Indo-Fijian children and adults, and a practical absence of undernutrition among indigenous Fijians(16). These differences in nutritional outcomes cannot be explained on the basis of differences in overall standard of living. For example, according to a household survey from 1990–1991, the percentages of households living below the poverty line are of similar magnitude for indigenous Fijian and Indo-Fijian households (Table 4). Furthermore, educational achievements in terms of finishing primary school are rather similar for ethnic Fijians and Indo-Fijians (Table 4). It may be noted that there are also studies which report less favourable socio-economic conditions for Indo-Fijian households compared with indigenous Fijian households, but in quantitative terms also in these reports differences are not very large(Reference Otsuka19, Reference Brown and Jimenez20).
Table 4 Prevalence of undernutrition in adults and children, and prevalence of food poverty in Fijians and Indo-Fijians in Fiji

USA
For different ethnic population groups in the USA, Table 5(Reference Schoenborn, Adams and Barnes21–24) provides results on prevalence rates of low BMI in adult males and females, on poverty prevalence, on infant mortality and on the occurrence of low birth weight.
Table 5 Prevalence of low BMI in adults, poverty, infant mortality and low birth weight by ethnic group in the USA
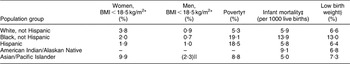
*Data of 1997–1998 National Health Interview Survey from Schoenborn et al. (2002)(Reference Schoenborn, Adams and Barnes21).
†Data from US Department of Commerce (2001)(22).
‡Data from Centers for Disease Control and Prevention (2005)(23).
§Data for year 2000 from Childtrends Databank (2007)(24).
||Value in parentheses: result does not meet set standards of precision.
While in the USA the overall prevalence of BMI < 18·5 kg/m2 is very low, for women of Asian descent it is considerably higher in comparison with the other ethnic population groups. Also for adult males, the prevalence of low BMI is highest among men of Asian descent but here the available information is of low statistical quality (Table 5). Also for the USA, the relatively high prevalence rate of low BMI among adults of Asian descent cannot be explained on the basis of differences in overall standard of living. For example, while the poverty rate among Asian/Pacific households is below 10 %, among black and Hispanic households it is about twice as high. Also in terms of health indicators, such as infant mortality and the occurrence of low birth weight, Asian/Pacific households appear to be better off compared with black households.
Other US data, such as for example from the Pediatric and Pregnancy Nutrition Surveillance Systems (PedNSS and PNSS), confirm the above pattern of high rates of low BMI among people of Asian descent living in the USA(25–Reference Lauderdale and Rathouz27).
Nutritional status and gender
Table 6(Reference Tetens, Hels, Khan, Thilsted and Hassan28–45) provides results on prevalence rates of low BMI in adult males and females as reported in samples (mostly non-representative at national level) from seven Asian and eleven African countries. For most samples, available data reveal relatively small differences in prevalence of low BMI between males and females, at most in the order of magnitude of a few percentage points. However, for India the most recent national survey clearly reveals a higher rate of low BMI among women than among men, in particular in the rural area(30). For Bangladesh, in one survey undertaken in slums in Dhaka, the prevalence of undernutrition appears to be considerably higher among females than among males; and in the age group 20–29 years this difference is even larger(Reference Pryer and Rogers29). On the other hand, in a study in rural villages in Bangladesh, high but similar rates of low BMI are reported for males and females(Reference Tetens, Hels, Khan, Thilsted and Hassan28). In two other studies in Bangladesh, not included in Table 6 (because only mean BMI and no prevalence rates of undernutrition are reported), the mean BMI is found to be very similar in men and women, implying that for these study populations the undernutrition prevalence rates are likely to be rather similar in men and women(Reference Zaman, Choudhury, Ahmed, Numan, Islam and Yoshiike46, Reference Hussain, Vaaler, Sayeed, Mahtab, Keramat Ali and Azad Khan47)Footnote *. Also for the sub-Saharan African countries included in Table 6, there is no clear pattern of higher rates of low BMI among either males or females. In five countries the differences are three percentage points or less; for Ethiopia and Mali reported undernutrition prevalence rates are higher among women; in Mauritania and South Africa undernutrition prevalence rates are higher among males. Two studies in Togo yield conflicting results.
Table 6 Prevalence of low BMI in adult males and females in nationally representative and non-representative population samples from South Asian and sub-Saharan African countries
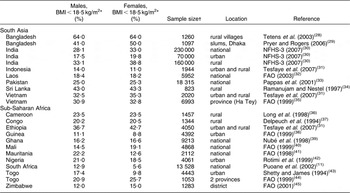
*Age group definitions for adults may differ somewhat in the various reports (>18 years, >20 years, 20–50 years, etc.).
†For India, urban and rural sample size estimated on the basis of an urban population share of 30 %.
Micronutrients
Table 7(Reference Stoltzfus5) provides information on estimated prevalence rates of anaemia in men and women in various regions in the world. At population level, anaemia is generally considered an indicator of iron deficiency, and high levels of anaemia as occur in particular in South Asian women have often been associated with nutritional discrimination(Reference Osmani and Sen7, Reference Brabin, Nicholas, Gogate, Gogate and Karande48).
Table 7 Prevalence of anaemia in males and females in different regions in the world
Data from Stoltzfus (2003)(Reference Stoltzfus5).
*Excluding Egypt, Morocco, Somalia, Sudan and Tunisia.
†Excluding Cuba.
‡Afghanistan, Djibouti, Egypt, Iraq, Morocco, Pakistan, Somalia, Sudan and Yemen.
§Indonesia, Sri Lanka and Thailand.
||Bangladesh, Bhutan, Democratic People’s Republic of Korea, India, Maldives, Myanmar and Nepal.
¶Including Cuba.
Table 7 shows first that prevalence rates of anaemia are higher in South Asia than in the other regions. Second, in all regions the anaemia prevalence is much higher among women than among men. When considering the magnitude of the differences in anaemia prevalence between males and females in the various regions in the world, the largest difference is recorded for the Eastern Mediterranean region. With respect to differences in anaemia prevalence between males and females at the level of individual countries or population groups within countries, outcomes are more varied. For example, according to India’s National Family Health Survey, the anaemia prevalence rates in adult women and adult men are respectively 56·2 % and 24·3 % (resulting in a ratio of 2·3)(30). On the other hand, in Bangladesh, where undernutrition rates in children are of similar magnitude as in India, large-scale survey data reveal only modest differences in anaemia prevalence between males and females(Reference Ahmed49). For other micronutrients only limited information is available which would allow for an assessment of possible gender differences in the prevalence rates of deficiencies. For iodine deficiency and goitre, most studies reveal a higher prevalence rate among women(Reference Darnton-Hill, Webb, Harvey, Hunt, Dalmiya, Chopra, Ball, Bloem and de Benoist50). For vitamin A deficiency, available data on children do not reveal any gender component(51) and for older children or adults, information on possible gender differences is not available. Also for zinc or other micronutrient deficiencies, gender-specific data are not available.
Discussion
Ethnic predisposition for low BMI among people of South Asian descent
Results from countries that are home to sizeable population segments from different ethnic backgrounds, including people of Asian and African descent, reveal consistently higher prevalence rates of low BMI among people of South Asian descent. These differences cannot be explained on the basis of indicators which relate to access to food, social status of women or overall standard of living. Apart from the presented results on South Africa, Fiji and the USA, similar results are also reported for England, although in these reports information on the socio-economic status of the various ethnic population segments is not presented(52). On the basis of these outcomes it is hypothesized that there exists among adults of South Asian descent an ethnically determined predisposition for low adult BMI. This ethnic predisposition can be based on both genetic and cultural factors.
The concept that ethnicity may affect the BMI characteristics of people is not new. However, literature and research appear to have a strong focus at the higher end of the BMI range, where the linkages between overweight and obesity and the risks of non-communicable diseases and disorders, such as hypertension, diabetes and cancer, are being extensively investigated. Many studies have shown that, at the higher end of the BMI range, there are significant ethnic differences in body composition between people of African, Asian and Caucasian descent, with a particular BMI representing, on average, a higher level of body fat and lower level of lean body mass in people of Asian descent compared with most other populations(Reference Deurenberg, Bhaskaran and Lian53–Reference Wang, Thornton, Heymsfield and Pierson55). Associated with these differences in body composition are differences in susceptibility to various non-communicable diseases.
But also at the lower end of the range, the existence of ethnic differences in BMI has been recognized in earlier studies. For example, the Cormic index (ratio of sitting height to standing height), introduced in the 1990s, has the objective to correct for differences in undernutrition prevalence between adults from different ethnic backgrounds(Reference Norgan56). The Cormic index is still occasionally used, but its acceptance appears to be limited(Reference Adak, Gautam, Bharati, Gharami, Pal and Bharati57). Of more recent date are studies on differences in BMI between adolescents from different ethnic backgrounds and also studies on ethnic differences in fetal growth(Reference Kumar, Holmboe-Ottesen, Lien and Wandel58, Reference Mathai, Schramm, Baravilala, Shankar, Antonisamy, Jeyaseelan and Bergstrom59).
The data presented in the current paper on undernutrition prevalence rates among people from different ethnic backgrounds in countries such as South Africa, Fiji and the USA strongly suggest that there are also differences in BMI characteristics between people from different ethnic backgrounds at the lower end of the BMI range, with a predisposition for a low BMI among adults of South Asian descent. It is further hypothesized that such predisposition is mainly expressed under relatively low levels of living conditions as prevailing in low-income countries or in low-income segments of higher-income countries.
Nutritional status of adult males and females
Comparing anthropometric results on undernutrition prevalence rates among adult males and adult females in samples from South Asian and sub-Saharan African countries gives a mixed picture. In general, differences in prevalence of low BMI between males and females are not very large, of the order of magnitude of a few percentage points, with some exceptions. Although for adult males nationally representative data on the occurrence of low BMI are still poorly available, on the basis of the presented results it can be concluded that not only for adult women, but also for adult men, prevalence rates of low BMI are much higher in South Asian countries than in sub-Saharan African countries.
It is important to stress that the present study does not pursue any mitigation or disguise of the occurrence of women’s discrimination in South Asia or in any other region of the world. Gender disparities continue to be a major concern in many countries or population groups within countries, affecting various aspects of life, including health, nutrition, education, access to labour markets, and even access to justice and human rights. For South Asia, a frequently mentioned characteristic of such discrimination is the phenomenon of ‘missing women’(Reference Osmani and Sen7, Reference Bhutta, Gupta, de’Silva, Manandhar, Awasthi, Hossain and Salam60). A specific period of time during which the nutritional and health needs of women are critical is pregnancy. Within the context of the Asian enigma, two aspects of the health and nutritional condition of pregnant women need to be mentioned. First, there are a number of studies, mainly from South Asia, which report on the occurrence of high workloads of women during pregnancy and the adverse effects of these workloads on the birth weights of their babies(Reference Rao, Kanade, Margetts, Yajnik, Lubree, Rege, Desai, Jackson and Fall61). Such high workloads of women could be considered an indication of insufficient care for women’s health during pregnancy. The second issue that needs to be mentioned is the often reported practice of women in South Asia to reduce food intake during pregnancy, in order to prevent complications during labour and delivery(Reference Hutter62).
Dietary quality and micronutrients
One other factor that could play a role in the high levels of undernutrition in South Asia, apart from ethnic predisposition and gender inequalities, is an overall poor quality of the habitual diet of low-income people in this region, and in particular an insufficient dietary intake of essential micronutrients such as iron, vitamin A, zinc, or other vitamins and minerals. In the introductory section of the present paper it was shown that anaemia levels are very high in South Asia. Apart from factors such as infectious diseases and, in women, blood losses related to reproductive functions, it is generally assumed that a low level of dietary intake of iron is the most important causative factor of anaemia. In South Asia, one specifically important factor contributing to a low dietary intake of iron is the very low level, on average, of meat consumption. In many studies a direct linkage between low levels of meat consumption and anaemia prevalence has been implied(Reference Sharma, Soni, Murthy and Malhotra63–Reference Ahmed, Rahman, Noor, Akhtaruzzaman and Hughes65).
Also with respect to other micronutrients, there are indications that in South Asia the occurrence of deficiencies is higher than in most other regions in the world. For example, a recent World Bank document reports vitamin A deficiency prevalence rate of 40 % and 32 % respectively for South Asia and Africa, and according to the same report South Asia is also the region in the world with the highest prevalence rate of zinc deficiency(Reference Caulfield, Richard, Rivera, Musgrove and Black66). For iodine deficiency, there are also large differences in prevalence rate between regions in the world, but the variations within countries are often even larger, which for iodine deficiency makes it less meaningful to make comparisons between such vast geographic entities as South India and sub-Saharan Africa.
Health consequences of low BMI in adults
For the assessment of undernutrition among adults there appears to be a broad international consensus to accept and use a BMI of 18·5 kg/m2 as the cut-off point below which individuals are classified as underweight, irrespective of ethnic background. Yet, in view of the differences in prevalence of low BMI between population groups of different ethnic descent living in the same country (South Africa, Fiji, United States, England) presented in the current report, it can be questioned whether the cut-off point for undernutrition in adults should be similar for populations of different ethnic descent or whether there is a need for differentiation. To address such a question, information is required on the possible adverse health effects of low BMI and whether ethnicity matters in this respect. A first and crude approach in evaluating the adverse health effects of low BMI is an analysis of the relationships between BMI and overall mortality. Most studies on the association between BMI and all-cause mortality show a U-shaped type of relationship, with mortality risks increasing at both ends of the BMI range. Lowest mortality risks are generally found in a BMI range between 20 and 22 kg/m2 and, at the lower end of the range, it is at BMI values somewhere between 18 and 19 kg/m2 where mortality risks begin to increase steeply(Reference Calle, Thun, Petrelli, Rodriguez and Heath67, Reference Gu, He, Duan, Reynolds, Wu, Chen, Huang, Chen and Whelton68). It is for these reasons that a BMI cut-off point of 18·5 kg/m2 has been selected for the classification of undernutrition in adults.
However, available data do not always show the same pattern in the relationship between BMI and mortality. For example, one longitudinal study in Bangladesh reveals lowest mortalities in the BMI range of 16·4–20·7 kg/m2, which is considerably lower than the commonly observed range of lowest mortality risk of about 20–22 kg/m2; moreover the study also reveals that at any particular BMI level the mortality risk for an individual in Bangladesh is lower compared with the mortality risk for an individual living in the USA(Reference Hosegood and Campbell69). In fact, in an earlier study also from Bangladesh, it was already reported(Reference Pryer70) that morbidity risks start to increase only at BMI values lower than 17 kg/m2, which is significantly below the commonly used cut-off point for undernutrition of 18·5 kg/m2. With respect to other aspects of health performance too, it cannot be assumed beforehand that the effects of a low BMI are similar for people from different populations or from different ethnic backgrounds. For example, while it is generally assumed(Reference Strickland71) that work capacity and productivity starts to decline around a BMI of approximately 18·5 kg/m2, in a study among female tea pluckers in Sri Lanka, there appears to be a significant relationship between blood Hb values and productivity but no relationship between BMI and productivity(Reference Selvaratnam, de Silva, Pathmeswaran and de Silva72).
One well-known adverse health effect of low BMI in women is the risk of low-birth-weight babies. Indeed, as shown in Table 1, the prevalence rate of low birth weight is much higher in South Asia than in sub-Saharan Africa. As a result of the well-established effects of low BMI of pregnant women on the occurrence of low birth weight of their babies and the also known relationships between low birth weight and child undernutrition, a predisposition for low BMI – as hypothesized in the present report – can be considered an important factor contributing to the high levels of child undernutrition in South Asia.
Conclusion
On the basis of anthropometric data on male and female adults in South Africa, Fiji and the USA, it is hypothesized that there exists an ethnic predisposition for low BMI among adults of South Asian descent.
This hypothesis concerns both adult males and adult females. Anthropometric data from several, mostly non-representative, population samples from both South Asian and sub-Saharan African countries indicate that prevalence rates of low BMI are much higher in South Asia than in sub-Saharan Africa not only for adult women, but also for adult men.
One other factor, apart from ethnicity, that might play a role in differences in undernutrition prevalence rates between South Asia and sub-Saharan Africa is an overall lower quality of the habitual diet of low-income people, resulting in particular in lower intakes of micronutrients such as iron, zinc and vitamin A. Finally, gender inequalities, as these occur in particular in South Asia, can contribute to the occurrence of high rates of low BMI in South Asia. However, such gender inequalities will at most only partially explain the observed high prevalence rates of low adult BMI in South Asian adults.
On the basis of the presented results, the applicability of one and the same cut-off point for undernutrition among adults from different ethnic backgrounds may be questioned. This observation runs parallel to the ongoing discussions with respect to the universal applicability of BMI cut-off points for overweight and obesity.
Acknowledgements
Conflicts of interest:There are no conflicts of interest.
Sources of funding:The present work was part of the regular research activities at the Centre for World Food Studies, VU-University, Amsterdam, The Netherlands.
Author’s responsibility:M.N. is fully responsible for the literature review, analysis and conclusions.


