


INTRODUCTION
Coastal northern Alaska holds an important place with regard to problems focused on understanding climatic and ecological change, as well as human adaptation and migration across the North American Arctic (Friesen et al. Reference Friesen and Ness2013; Tackney et al. Reference Tackney, Coltrain, Raff, O’Rourke, Friesen and Mason2016). The greater Bering Strait region, in particular, has been a center of prehistoric cultural diversity, interaction and innovation for several thousand years (Mason Reference Mason1998; Mason and Friesen Reference Mason and Friesen2017).
Radiocarbon (14C) dating of Arctic coastal archaeological sites can be problematic for several reasons, including, but not limited to (1) the use of driftwood or long-lived shrubs that produce older 14C ages, commonly referred to as the “old wood effect,” that incorrectly date the archaeological event; (2) organic materials can be preserved for relatively long periods of time (1000s to 10,000s of years) within permafrost (annually frozen) landscapes and incorporated into archaeological matrices; dating these materials yields erroneously old ages; and (3) some sites and features within sites may not contain terrestrial materials generally preferable for 14C dating, so that marine-derived materials are the only dateable material. In addition, people in these regions generally had mixed diets that included a large portion of sea mammals and anadromous fish that tend to contribute more marine carbon to their isotopic signature than terrestrial-based sources causing much older 14C ages than the date of a person’s death. Thus, understanding the marine reservoir effects (MREs) of different marine mammal species is essential to establishing accurate chronologies for Arctic coastal prehistory (Krus et al. Reference Krus, Jensen, Hamilton and Sayle2019).
Research around Arctic coastlines has focused on estimating regional MREs by either (1) calculating the difference in the 14C content of modern pre-Bomb marine specimens in relation to the calendar year in which they were collected; (2) using 14C dates on ancient marine and terrestrial remains from geological and archaeological deposits that are assumed to be contemporaneous; or (3) comparing 14C dates on marine organisms from geological deposits that contain an established date of a singular depositional event, such as tephra deposition from well-dated volcanic eruptions. Many of these studies show variance in MRE values between different marine species, and fluctuations through time and across regional geography (Arundale Reference Arundale1981; Dyke et al. Reference Dyke, McNeely and Hopper1996; Fitzhugh and Brown Reference Fitzhugh and Brown2018).
Several attempts have been made at providing corrective MRE values for 14C dates on marine species and human remains from populations that were highly reliant on marine-derived food sources from Arctic coastal zones. Marine mollusks are a focus in many MRE studies and useful in establishing local variations for oceanographic purposes (e.g., Kuzmin et al. Reference Kuzmin, Burr, Gorbunov, Rakov and Razjigaeva2007; McNeely et al. Reference McNeely, Dyke and Southon2006; Pearce et al. Reference Pearce, Varhelyi, Wastegård, Muschitiello, Barrientos, O’Regan, Cronin, Gemery, Semiletov, Backman and Jakobsson2017; Martindale et al. Reference Martindale, Cook, McKechnie, Edinborough, Hutchinson, Eldridge, Supernant and Ames2018). However, marine mollusks are generally not important to Arctic coastal populations as a dietary resource, as indicated by the dearth of mollusks in the archaeological record. Migratory marine mammals, such as seals, walrus and whales, as well as fish, held much more prominent roles in subsistence systems in the Arctic (Park Reference Park1994; Saleeby et al. Reference Saleeby, Moss, Hays, Strahe and Laybolt2009; Darwent Reference Darwent and Smith2011; Betts Reference Betts, Friesen and Mason2016; Coltrain et al. Reference Coltrain, Tackney and O’Rourke2016; Britton et al. Reference Britton, McManus-Fry, Nehlich, Richards, Ledger and Knecht2018; Dyke et al. Reference Dyke, Savelle, Szpak, Southon, Howse, Desrosiers and Kotar2019). In the archaeology of coastal high Arctic Canada, 14C dating of marine mammals has been problematic since McGhee and Tuck (Reference McGhee, Tuck and Maxwell1976) discovered that marine-derived dates were older than contemporaneous terrestrial materials such as short-lived shrubs. A similar offset was noted in archaeological samples from northwestern Alaska beach ridge sites (Mason and Ludwig Reference Mason and Ludwig1990).
Despite this need for accurate and precise MRE values, until the last decade, few researchers sought to understand the differences between 14C dates of marine mammal and terrestrial organisms over time across coastal northern Alaska (notable exceptions include Dumond and Griffin Reference Dumond and Griffin2002; Khassanov and Savinetsky Reference Khassanov, Savinetsky, Dumond and Bland2006; Ledger et al. Reference Ledger, Forbes, Masson-MacLean and Knecht2016; Krus et al. Reference Krus, Jensen, Hamilton and Sayle2019). In this paper, we document MREs in 14C dated seal remains from several sites spanning the last 1600 years in the Bering Strait and northern Bering Sea and Chukchi Sea regions (Figure 1), encompassing a period of significant cultural and climatic changes during the late Holocene (Mason and Jordan Reference Mason and Jordan1993; Mason and Gerlach Reference Mason and Gerlach1995; Anderson et al. Reference Anderson, Jordan and Freeburg2018, Reference Anderson, Brown, Junge and Duelks2019; Mason et al. Reference Mason, Jensen, Rinck, Alix, Bowers and Hoffecker2019). We present both the differences between 14C dated marine-terrestrial pairs, R(t) values, and from the global marine curve, ΔR values (Reimer and Reimer Reference Reimer and Reimer2017).
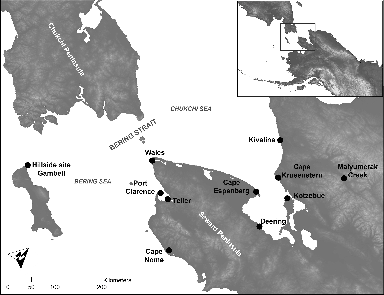
Figure 1 Map of the Bering Strait, northern Bering Sea and Chukchi Sea regions and the study site locations.
REGIONAL SETTING
The Chukchi Sea and northern Bering Sea are shallow, less than 100 m deep, and are the flooded continental shelves of the former Beringian subcontinent (Naidu and Gardner Reference Naidu, Gardner, Hameedi and Naidu1988). The Holocene transgression followed the flooding of the Bering Strait ca. 11,000 BP (Keigwin et al. Reference Keigwin, Donnelly, Cook, Driscoll and Brigham-Grette2006) and continued until the establishment of near modern sea level and marine ecology ca. 5000 BP (Jordan and Mason Reference Jordan and Mason1999; Khim et al. Reference Khim, Lee, Cho and Park2018). Opening north at 64°N at the Bering Strait, the microtidal Chukchi Sea is a triangular shaped compartment of the Arctic Ocean, oriented northwest/southeast and is subject to a complex array of atmospheric and marine processes that include frequent storm surges (Wise et al. Reference Wise, Comiskey and Becker1981) and the intrusion of water masses from both the Pacific and Atlantic Oceans (Coachman and Aagaard Reference Coachman and Aagaard1988; Lee et al. Reference Lee, Whitledge and Kang2007; Pisareva et al. Reference Pisareva, Pickart, Spall, Nobre, Torres, Moore and Whitledge2015; Pickart et al. Reference Pickart, Moore, Mao, Bahr, Nobre and Weingartner2016). Occasionally, warm, salty Atlantic water reaches the northern Chukchi Sea due to upwelling from Herald Canyon and southward transport along the Siberian coast. Several water masses flow through Bering Strait (Pisareva et. al. 2015) and provide organic carbon onto the Chukchi shelf; on the west, the Bering Sea and Anadyr water masses contribute old carbon derived from the world ocean (Grebmeier and McRoy Reference Grebmeier and McRoy1989). Organic carbon from Alaskan rivers is discharged into the eastern water mass (Grebmeier and McRoy Reference Grebmeier and McRoy1989); the geostrophically propelled Alaska current that continues along the northwest coast of Alaska spiraling into the shallow embayment of Kotzebue Sound (Aagaard Reference Aagaard1987). The current regime produces an upwelling of benthic nutrients (Grebmeier and McRoy Reference Grebmeier and McRoy1989; Walsh et al. Reference Walsh, McRoy, Coachman, Goering, Nihoul, Whitledge, Blackburn, Parker, Wirick, Shuert and Grebmeier1989) and supports a high biomass of ice-obligate migrating sea mammals (e.g., seal, walrus, and whale [Lentfer Reference Lentfer1988]), critically important to human subsistence, with discarded bone deposited near former settlements. While benthic organic carbon concentration varies across the shelf (Naidu et al. Reference Naidu, Cooper, Grebmeier, Whitledge, Hameedi, Ruediger and Macdonald2004), the organic carbon absorption by sea mammals is diluted by migration.
Previous Marine Reservoir Effect Estimates in the Bering Strait
Meyer Rubin (Reference Rubin1974) of the U.S. Geological Survey obtained two 14C ages on the valve of a living Astarte borealis dredged from the floor of the Bering Sea in 1969 and obtained an averaged 14C age of 540 ± 200 BP (W-2768), providing the first “disconcerting” confirmation that MRE should be a concern in the western Arctic (Rowland Reference Rowland1972). Knowledge of the marine carbon offset led Mason and Ludwig (Reference Mason and Ludwig1990) to compare marine and non-marine archaeological materials from St. Lawrence Island and Cape Krusenstern, noting an offset of between 400 to 500 years. Since 2000, several studies estimated MREs in the Bering Strait and northern Bering Sea. Dumond and Griffin (Reference Dumond and Griffin2002) calculated R(t) values from 14C dates on seal, walrus and whale bones and mussel shells and their terrestrial counterparts—grass, wood, charcoal, and peat samples—in the same archaeological contexts (e.g., strata and features). Dumond and Griffin (Reference Dumond and Griffin2002) obtained a wide range of R(t) values across the Alaska side of the Bering Sea, from the southern Seward Peninsula to the western Alaska Peninsula, spanning 383 ± 77 to 783 ± 50 years. Their data also displayed a difference of 330 ± 41 years between walrus-ivory and seal bone 14C dates, and mussel shells. Dumond and Griffin (Reference Dumond and Griffin2002) did not calculate ΔR values from their data.
Khassanov and Savinetsky (Reference Khassanov, Savinetsky, Dumond and Bland2006) calculated R(t) values between marine-terrestrial pairs from archaeological deposits on the northeastern coast of the Chukchi Peninsula in Siberia. This study used 14C ages on whale bones and baleen, human hair and unidentified sea-mammal bones and produced a wide range of R(t) values from 220 ± 202 to 927 ± 52 years. They subsequently calculated ΔR values for the northern Bering Sea using their Chukchi Peninsula estimates and Dumond and Griffin’s (Reference Dumond and Griffin2002) data from St. Lawrence Island, Wales and Teller. Khassanov and Savinetsky (Reference Khassanov, Savinetsky, Dumond and Bland2006) suggest that an average ΔR value of 188 ± 27 years be used as an MRE correction for the northern Bering Sea region.
McNeely et al. (Reference McNeely, Dyke and Southon2006) 14C dated marine mollusk (Hiatella, Mytilus, Serripes, and Mya sp.) shells that were collected live in 1913 around the Chukchi and Bering Seas. Four Hiatella arctica and Mytilus edulis shells from Port Clarence and Teller on the southern Seward Peninsula near the Bering Strait were dated. R(t) values from these four specimens range from 700 ± 50 to 930 ± 40 years, and ΔR values between 350 ± 50 and 580 ± 40 years with a weighted mean of 486 ± 65 years. In a marine core from the Chukchi Sea, just north of the Bering Strait, Pearce et al. (Reference Pearce, Varhelyi, Wastegård, Muschitiello, Barrientos, O’Regan, Cronin, Gemery, Semiletov, Backman and Jakobsson2017) calculated similar ΔR value of 477 ± 60 years based a comparison of 14C dates on Macoma sp. shells in close association with an Aniakchak tephra deposit that has a known age of ~3600 cal BP.
MATERIALS AND METHODS
Sample Selection
We 14C dated marine-terrestrial paired samples from archaeological sites along the coast of northwestern Alaska and surrounding the Bering Strait: Cape Espenberg, Cape Krusenstern, Deering, Kivalina, and Kotzebue (Figure 1). This broad sampling across the region allowed us to assess geographic differences in 14C offsets between seals and terrestrial samples, and compare reservoir values from previous research on shell, seals, walrus and whales in the Chukchi Sea, Bering Strait, and northern regions of the Bering Sea. Paired dates from several different periods over the last 1600 cal BP years were compared to understand potential MRE changes through time.
Our study hinges on the selection of closely associated seal and terrestrial samples in well-defined archaeological features, including house floors and fill, and cache pits (Table 1; see also Supplemental Information for detailed site information). Some features, such as the house Features 21 and 87 at Cape Espenberg, had multiple occupations, and potential reuse, that were distinguished in the stratigraphy and through 14C dating. In these contexts, paired samples were only used if they were from the same excavation units, stratigraphic levels and depths in order to minimize the potential combining of 14C dates from different occupational episodes.
Table 1 Summary of 14C samples by locations.

* 14C date outliers based on χ2 tests reported in Table S2.
Terrestrial samples consist of caribou remains, wood, wood charcoal fragments, and plant seeds. A total of 84 14C dates were compiled for this study: 34 on seal bones, 37 on caribou bones, and 13 on wood, wood charcoal fragments, and seeds (see Supplemental Table S1 for individual date information).
The context of each sample was scrutinized to avoid the selection of samples from archaeological features that potentially had multiple periods of deposition (i.e., long periods of occupation) or post-depositional disturbance. In instances with more than three dates on terrestrial or marine samples from an archaeological feature, we statistically compared dates (described below) to identify potential outliers within the groups. Outlier 14C dates can occur from subtle differences in depositional contexts that create the mixture of two different periods of materials, by exogenous contamination that was not fully removed from samples during pretreatments, or by laboratory error. Outlier dates can increase the inaccuracy of local reservoir values (Ascough et al. Reference Ascough, Cook and Dugmore2009). Outliers were removed from the study prior to calculating MRE values for seals. The total number of outliers and marine-terrestrial pairs are discussed below.
In addition to the archaeological samples, we 14C dated two seal (Erignathus barbatus and Pusa hispida) skulls collected by Otto William Geist in AD 1932 and 1946 from Cape Nome and the St. Lawrence Island region. These modern-aged specimens are housed in the Mammals Collection at the University of Alaska Museum of the North. The archaeology sites and features and the modern seal crania are described in more detail in the Supplemental Materials.
Laboratory Methods
14C AMS ages were assayed at six different labs: Beta Analytic, Inc., Center for Accelerator Spectrometry at Lawrence Livermore National Laboratory, Center for Applied Isotope Studies at the University of Georgia, the National Ocean Sciences AMS Facility, W.M. Keck Carbon Cycle Accelerator Mass Spectrometer Facility at the University of California Irvine, and the University of Arizona Accelerator Mass Spectrometry Laboratory. The species and skeletal element of each bone were identified by zooarchaeologists Carol Gelvin-Reymiller, then of Northern Land Use Research, Inc., and Dr. Holly McKinney of the University of Alaska Fairbanks, in addition to several of the coauthors on this paper (CD, AF, LN). We ideally aimed to sample from multiple individuals of caribou and seals from each archaeological feature to account for some variability within a species at any given particular time.
Seventy-one bones were sampled with pretreatments conducted at 14C labs (n = 37), and by Joan Coltrain at the Archaeological Center Research Facility for Stable Isotope Chemistry at the University of Utah (n = 34). All of the sites used in this study have substrates (such as perennially frozen ground) in Arctic settings that generally promotes relatively slow diagenetic changes in organic materials. Bones in these settings are typically well-preserved. Nevertheless, the atomic C:N ratios and collagen yields by weight (%yield) were measured for 41 of the 71 bone samples (58%) to establish the pattern of collagen diagenesis and potential for significant amounts of exogenous carbon contamination to alter the 14C ages. The methods used by each lab to pretreat samples and conduct stable isotope and 14C AMS and stable isotope measurements are provided in the Supplementary Materials.
Statistical Approaches
Groups of dates on either marine or terrestrial samples from the same archaeological feature were evaluated for statistical similarities using the χ2 tests (Ward and Wilson Reference Ward and Wilson1978; Ascough et al. Reference Ascough, Cook and Dugmore2009) in Calib 7.1 (Stuiver et al. Reference Stuiver, Reimer and Reimer2013). Groups of dates that showed statistically different results were then segregated into individual χ2 test comparisons to distinguish possible outliers within the groups (Table S2 in Supplementary Materials). Outliers were subsequently removed from the analysis (Table 1). Statistically similar dates for marine and terrestrial sample groups within features were combined into weighted mean ages using Calib 7.1 (Ward and Wilson Reference Ward and Wilson1978). Several features (n = 13) had only single sets of marine and terrestrial 14C dates.
Paired samples from features at sites were grouped by a general location and into four periods based on the 14C age BP of a pair’s terrestrial sample: >200 BP, 200–600 BP, 600–1000 BP, and 1100–1600 BP. The two historic samples from St. Lawrence Island and Cape Nome were defined as “Modern” considering the recorded dates of their collection in AD 1932 and 1946. Supplementary Materials Tables S4 through S8 provide detailed information on 14C pairs by general location and by the four periods.
We define R(t) as the difference, or offset, between paired marine and terrestrial (assumed “atmospheric”) 14C ages, along with the associated standard errors of the differences (Stuiver et al. Reference Stuiver, Pearson and Braziunas1986; Taylor and Bar-Yosef Reference Taylor and Bar-Yosef2014: 152). R(t) is calculated by subtracting the marine 14C age from the associated terrestrial 14C age. R(t) values for the two modern seal samples collected in 1932 and 1946 were calculated by subtracting the expected 14C age in IntCal13 (Reimer et al. Reference Reimer, Bard, Bayliss, Beck, Blackwell, Bronk Ramsey, Buck, Cheng, Edwards, Friedrich, Grootes, Guilderson, Haflidason, Hajdas, Hatté, Heaton, Hoffmann, Hogg, Hughen, Kaiser, Kromer, Manning, Niu, Reimer, Richards, Scott, Southon, Staff, Turney and van der Plicht2013) that is associated with the calendrical terrestrial date of collection.
ΔR weighted mean values and standard deviations were calculated using the deltar function in the Marine Radiocarbon Database from the 14CHRONO Centre (Reimer and Reimer Reference Reimer and Reimer2017). Modern seal ΔR values were calculated using the known collection date as the independent age determination. ΔR values for archaeological paired marine-terrestrial samples >200 BP were calculated in deltar, outlined in Reimer and Reimer (Reference Reimer and Reimer2017) using the Northern Hemisphere curve. Because the deltar program cannot calculate ΔR values for paired-samples with terrestrial pairs that have ages <200 BP, we followed procedures outlined in Southon et al. (Reference Southon, Rodman and True1995) to derive ΔR values for these pairs. Terrestrial 14C ages <200 BP were calibrated in OxCal v4.3 (Bronk Ramsey Reference Bronk Ramsey2009) using IntCal13, then terrestrial calibrated age range was converted to modelled 14C ages using the Marine14 curve (Reimer et al. Reference Reimer, Bard, Bayliss, Beck, Blackwell, Bronk Ramsey, Buck, Cheng, Edwards, Friedrich, Grootes, Guilderson, Haflidason, Hajdas, Hatté, Heaton, Hoffmann, Hogg, Hughen, Kaiser, Kromer, Manning, Niu, Reimer, Richards, Scott, Southon, Staff, Turney and van der Plicht2013). The Marine14 modelled 14C age was subtracted from the original 14C age of the marine sample of the marine-terrestrial pair to produce a ΔR value. Weighted means and errors (the square root of the sum of squares of individual uncertainties) were calculated for R(t) and ΔR values for a given group, along with overall all R(t) and ΔR values for seals in the Bering Strait and northern Bering Sea region
Shapiro-Wilk tests shows R(t) and ΔR values do not significantly deviate from normal distributions: R(t) (n = 23; W = 0.973693; critical W value = 0.914154; p = 0.776418), and ΔR (n = 23; W = 0.92713; critical W value = 0.914154; p = 0.094824). One-way analysis of variance (ANOVA) with Tukey HSD post-hoc tests were used to assess variation within and across groups of R(t) and ΔR values. R(t) and ΔR values for Dumond and Griffin (Reference Dumond and Griffin2002), Khassanov and Savinetsky (Reference Khassanov, Savinetsky, Dumond and Bland2006), and McNeely et al. (Reference McNeely, Dyke and Southon2006) were also recalculated using the same procedures outlined above for reliable comparisons to our study’s results (Tables S9 and S10). ANOVA and Tukey HSD post-hoc tests were used to assess variation among our study’s overall R(t) and ΔR values and those from the previous studies.
RESULTS AND DISCUSSION
Quality Control of Bone Samples and Radiocarbon Data
The atomic C:N ratios and collagen yields for 58% of the study’s bone samples were scrutinized to assess the potential for severe protein degradation and for significant amounts of exogenous carbon contamination that would alter the 14C ages. Atomic C:N ratios are between 3.1 and 3.5 with an average of 3.3 ± 0.1 falling within the recommended ranges of 2.9–3.5 or 3.1–3.5 for accepting collagen as preserved enough to yield an accurate 14C age (DeNiro Reference DeNiro1985; van Klinken Reference van Klinken1999).
Collagen yields on these samples are between 2.3% and 31.0 %yield, with an average of 17.6 ± 6.4 %yield, well above acceptable levels >1-to-3.5 %yield for well-preserved collagen (Ambrose Reference Ambrose1990; van Klinken Reference van Klinken1999). Therefore, we consider the collagen quality to be high and exogenous carbon contamination to be minimal in contributing to inaccurate 14C ages.
Chi-square tests for within groups of terrestrial and marine dates from a given feature were also preformed to define and reduce the influence of outliers on R(t) and ΔR values (Ascough et al. Reference Ascough, Cook and Dugmore2009) (Table S2). Five of the 84 (5.9%) 14C dates were removed due to internal inconsistencies (outliers) within groups of terrestrial and marine samples within a given feature (Table 1). Four bone ages (three caribou and one seal) were removed from the data set, as well as one 14C date on a piece of structural wood in the tunnel of a house feature at Cape Espenberg that may be driftwood.
As a result, the total included 80 paired samples after the statistical outliers were removed from the total data set. Features with multiple 14C dates on terrestrial and marine samples that were statistically similar were subsequently averaged to create 24 marine-terrestrial paired data sets to use in our calculations of R(t) and ΔR. Paired data sets are distributed across the general localities of the study area by the following (from highest to lowest amount): 11 at Cape Krusenstern, three at Deering, three at Cape Espenberg, three at Kotzebue, one at Kivalina, one at Maiyumerak Creek, and the sole modern sets from St. Lawrence Island and Cape Nome regions. When divided by general periods, the paired data sets are distributed as such (from most recent to oldest periods): three <200 BP, 10 between 200–600 BP, seven between 600–1000 BP, and four between 1000–1600 BP.
R(t) and ΔR values across general periods and locations across the northern Bering Sea.
R(t) and ΔR values for each pair and feature and ANVOA and Tukey HSD results for groups are detailed in the Supplemental Materials (Tables S4 through S8).
General Periods
Weighted means for R(t) values by period are between 875 ± 155 and 699 ± 50 years, a span of 176 years, with an overall weighted mean of 800 ± 140 years (Table 2; Figure 2). Weighted mean ΔR values are between 429 ± 148 and 384 ± 90 years, a 45-year span, with an overall weighted mean of 404 ± 112 years. The weighted means of the R(t) and ΔR values show significant variation within 2 out of the 4 periods (Table S4). However, there is little variation across the R(t) and ΔR weighted means of the periods (R(t) F [3,75] = 0.11, p = 0.95; ΔR F [3,75] = 0.02, p = 1.00).

By Location
Weighted mean R(t) values by location show a spread of 677 ± 22 and 948 ± 18 years, while ΔR values range between 302 ± 138 and 644 ± 50 years (Table 2). R(t) and ΔR values have overall weighted means of 834 ± 159 and 446 ± 73 years, respectively. ANOVA values for the weighted means for R(t) and ΔR values show no significant variation across locations (R(t) F [7,74] = 0.90, p = 0.51; ΔR F [7,74] = 0.70, p = 0.67; see Table S4).
The overall ΔR weighted mean of 404 ± 112 years based on values for the periods should be used as an MRE correction because it takes into account larger uncertainty than the overall ΔR value calculated for the locations. As expected, there are changes in the percent differences between the calibrated mean ages for terrestrial and seal samples occurs once the weighted mean of ΔR values 404 ± 112 years is applied as a corrective measure for seal 14C ages (see Table S4). The percent of change between uncorrected and corrected marine ages ΔR is between –83.7 to –36.8% for an average of –54.8 ± 14.3%. The difference between mean ages of terrestrial and seal calibrated ages range between 428 and 1020 years with percent differences between 40.9 and 149.2% and an average of 78.9 ± 29.1% when a ΔR value correction is not applied. The mean ages range between –262 and 197 years with percent differences between –57.8 and 46.5% with an average of 1.1 ± 23.7% after the application of the ΔR value quoted above.
Comparisons to Previous Studies
Our weighted mean R(t) and ΔR values are 165–252 years and 143–250 years, respectively, greater than Dumond and Griffin’s (Reference Dumond and Griffin2002) values. Our weighted mean R(t) and ΔR values are 20 and 56 years greater than the Khassanov and Savinetsky (Reference Khassanov, Savinetsky, Dumond and Bland2006) values (Table 3). The weighted means of the McNeely et al. (Reference McNeely, Dyke and Southon2006) R(t) and ΔR values are 38–80 years greater than ours. However, the large standard errors of weighted mean R(t) and ΔR values for all of the data sets (our study and previous studies) overlap in their ranges displaying little variation (Figure 3). ANOVA values show no significant variation across the R(t) and ΔR values of our study and the previous studies (R(t) F [5,51] = 0.20, p = 0.96; ΔR F [5,51] = 0.31, p = 0.90; see Table S10).

Figure 2 Weighted mean R(t) (above) and ΔR values (below) by general period from this study. Data summarized in Table 2.
Table 3 Comparison of marine reservoir effect values from studies in northwestern Alaska.

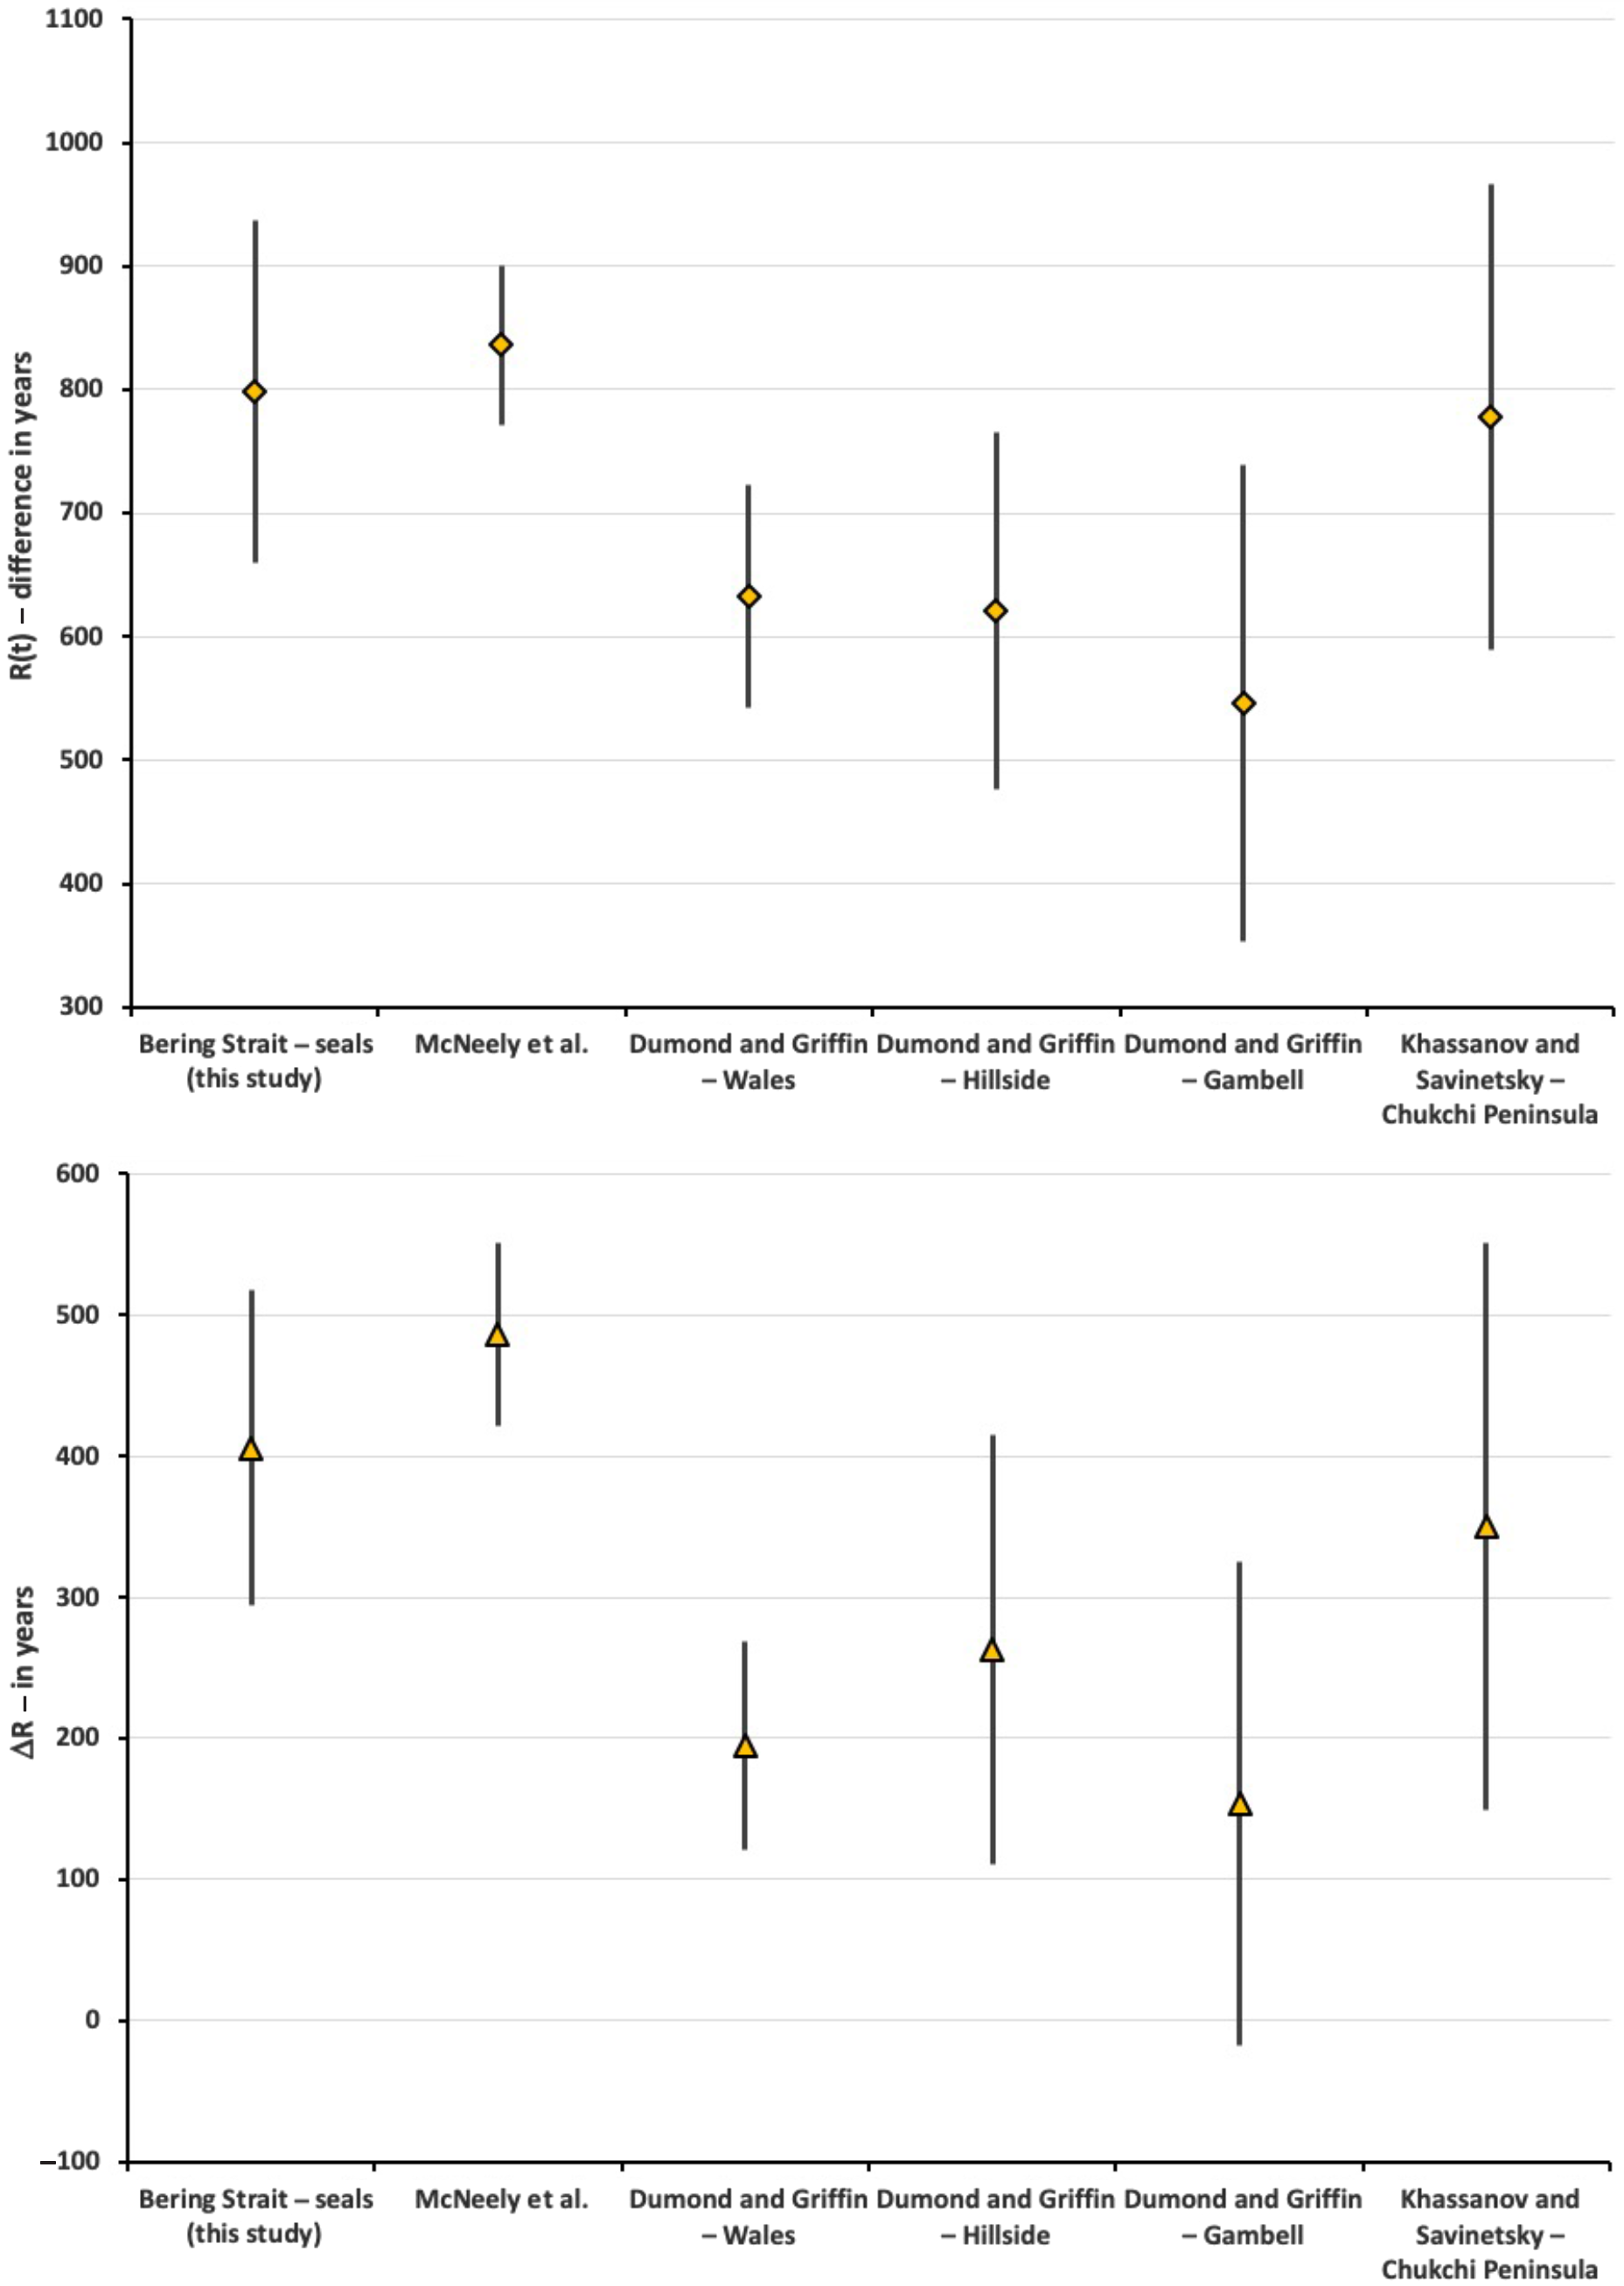
Figure 3 Weighted mean R(t) (above) and ΔR values (below) on Bering Strait seals from this study in comparison to data from McNeely et al. (Reference McNeely, Dyke and Southon2006), Dumond and Griffin (Reference Dumond and Griffin2002), and Khassanov and Savinetsky (Reference Khassanov, Savinetsky, Dumond and Bland2006). Data summarized in Table 3.
CONCLUSIONS
Our study provides an assessment of MREs of 14C content among seals in the northern Bering Sea over the last 1600 years. Weighted mean R(t) and ΔR values, given their large uncertainties, display little variation over the last 1600 years and across our sampling locations. The overall R(t) and ΔR weighted means for seal remains in the northern Bering Sea is 800 ± 140 and 404 ± 112 years, respectively; these values are similar to values calculated on marine mollusks by McNeely et al. (Reference McNeely, Dyke and Southon2006) but larger than values calculated on seal, walrus and whale remains by Dumond and Griffin (Reference Dumond and Griffin2002) for the region. If the standard error of predicted values, as suggested by Cook et al. (Reference Cook, Ascough, Bonsall, Hamilton, Russell, Sayle, Scott and Bownes2015), is applied to the weighted mean to account for increased uncertainty in using archaeological sample association than the R(t) and ΔR values are 800 ± 202 and 404 ± 176, respectively.
We suggest that the weighted mean ΔR value of 404 ± 112 years can be used as a local ΔR estimate to correct for MREs for 14C ages on seals in the region and for human remains for populations that relied on these types of pinnipeds as a food staple. Our estimate is slightly less than the Krus et al. (Reference Krus, Jensen, Hamilton and Sayle2019) value of 450 ± 84 years for the Point Barrow area based on paired caribou and seal 14C dates. However, both values overlap at 1 σ.
MRE corrections for human remains should consider the species that provide the largest contributions to a regional population’s diet, as well as accounting for potential subsistence preference changes over time. Dietary modeling using stable isotopes of human remains and summaries of zooarchaeological remains from sites for a given period provide a necessary context for which ΔR value corrections to use (Coltrain et al. Reference Coltrain, Tackney and O’Rourke2016; Krus et al. Reference Krus, Jensen, Hamilton and Sayle2019). The use of an accurate ΔR value in corrections can have profound differences in how we interpret changes in the archaeological record (Coltrain et al. Reference Coltrain, Hayes and O’Rourke2006; Coltrain Reference Coltrain2010; Kuzmin Reference Kuzmin2010; Misarti and Maschner Reference Misarti and Maschner2015; West et al. Reference West, Khasanov, Krylovich, Hatfield, Khasanov, Vasyukov and Savinetsky2019).
ACKNOWLEDGMENTS
We thank zooarchaeologists Carol Gelvin-Reymiller, then of Northern Land Use Research, Inc., and Dr. Holly McKinney of the University of Alaska Fairbanks for aiding in the identification of seal and caribou remains from many of the study sites. Northern Land Use Research Alaska, Inc. funded 14C ages for the Deering, Kivalina, and Kotzebue sites and modern seal skulls. We thank the Deering, Kivalina, Kotzebue, and Shishmaref communities for supporting these archaeological projects and allowing us to sample these collections for the purpose of this study. Eric Carlson, former NLURA archaeologist, supported us in selection of Kotzebue samples and provided notes on their context. National Park Service supported the Maiyumerak Creek excavations and analyses. The National Park Service also funded research at Cape Krusenstern through a cooperative agreement (J8W07070032) managed by the Pacific Northwest Cooperative Ecosystem Study Unit. The Cape Espenberg research has involved several successive projects, first supported by the National Park Service (1988–1995), and then through two consortia of researchers; the first consortia was supported from 2009–2013 by a National Science Foundation (NSF) grant to J. F. Hoffecker, O. K. Mason, C. M. Darwent, and N. H. Bigelow (ARC-0755725), and the second consortia of researchers were supported from 2015-present by a collaborative NSF grant to C. Alix and N. H. Bigelow (ARC-1523160), O.K. Mason (ARC-1523205), S. Anderson (ARC-1523059), and D.H. O’Rourke (ARC-1523059). Link Olson and Aren Gunderson of the University of Alaska Museum of the North Mammalogy Lab allowed for sampling of the modern seal skulls from their collection. Brian Hemphill generously advised us on the statistical procedures we used in this study. Sam Coffman drafted the main map for this article. We thank the reviewers that provided extremely valuable comments making this study fundamentally higher in its quality.
Supplementary material
To view supplementary material for this article, please visit https://doi.org/10.1017/RDC.2020.127


 Open access