Introduction
Maize is the ‘Queen of Cereals’ and it is used as food, fodder and feed apart from various industrial purposes. The Eastern Himalayan region, mainly the North-Eastern region (NER) of India, is a diverse hub for various crops, including maize. Maize in this region has acquired different unique characteristics like coloured grain having a diverse range from purple, blue, black, white, cream, yellow, orange, red, and variegated; multi-cob bearing (3–6 cobs per plant); mucus-producing roots having the potential to fix atmospheric nitrogen, stay green trait, and waxiness having high amylopectin content. In addition to the above traits, the local maize has high potential as fodder due to its vigorous growth and tillering habit which makes them unique. Local maize has tremendous morphological variability such as plant height, plant type, duration, kernel colour, texture, nutrient composition, and appearance. (Singh et al., Reference Singh, Devi, Dayal, Saha, Lungmauna, Dutta, Boopathi and Singh2019). The plant type of local landraces ranges from wild primitive types to advanced landraces/varieties maintained and selected by farmers from time immemorial.
As agriculture is at a subsistence level in the NER region, farmers still grow traditional landraces for family/community needs. The region is characterized by high rainfall and acidic soils with temperatures varying from temperate to sub-tropical. The maize is grown mainly in hill ecology with slash and burn system of cultivation. The weather conditions in the North Eastern Region (NER) of India are erratic; drought and floods are common phenomena in the region. The local maize germplasm has evolved in balance with the prevalent agroecological conditions of the region and, therefore, they are expected to possess better adaptation to regional stresses.
The advent of molecular markers provides a key breakthrough to surmount the key drawback of classical crop improvement programmes (Devi et al., Reference Devi, Devi, Kumar, Sharma, Beemrote, Chongtham, Singh, Ch, Singh, Ningombam, Akoijam, Singh, Singh, Monteshori, Omita, Prakash and Ngachan2017b; Hasan et al., Reference Hasan, Choudhary, Naaz, Sharma and Laskar2021) as well as provide a platform for an efficient assessment of diversity present within and between plant populations (Boakyewaa et al., Reference Boakyewaa Adu, B-Apraku, Akromah, Garcia-Oliveira, Awuku and Gedil2019; Borah et al., Reference Borah, Bhattacharjee, Rao, Kumar, Sharma, Upadhaya and Choudhury2021). They are preferred over the morphological or biochemical markers as they are not affected by environmental factors and by the developmental phase of the plant (Badu-Apraku and Fakorede, Reference Badu-Apraku and Fakorede2017). Among the various types of molecular markers, microsatellites or simple sequence repeats (SSRs) are considered sufficient for genetic diversity assessment (Laosatit et al., Reference Laosatit, Amkul, Somta, u ma Tanadul, Kerdsri, Mongkol, Jitlaka, Suriharn and Jompuk2022; Islam et al., Reference Islam, Alam, Maniruzzaman and Haque2023) due to their high level of polymorphism, abundance, reproducibility, cost effective and amenability to automation (Govindaraj et al., Reference Govindaraj, Vetriventhan and Srinivasan2015). Studies on the comparative utilization of different molecular markers have publicized that SSRs with moderate density are more effective in assessing the molecular diversity study in maize than SNPs (Jones et al., Reference Jones, Sullivan, Bhattramakki and Smith2007; Yang et al., Reference Yang, Xu, Shah, Li, Han, Li and Yan2011; Adu et al., Reference Adu, Awuku, Amegbor, Haruna, Manigben and Aboyadana2019). Likewise, a study by Singh et al. (Reference Singh, Choudhury, Singh, Kumar, Srinivasan, Tyagi, Singh and Singh2013) in a series of Indian rice varieties concluded that for population structure study SNP markers showed better genetic relatedness with more population number. However, for the diversity studies SSR showed better grouping samples even at trait level.
Information on the genetic variability and population structure of the base population is a pre-requisite and crucial step for undertaking a successful crop improvement programme (Boakyewaa et al., Reference Boakyewaa Adu, B-Apraku, Akromah, Garcia-Oliveira, Awuku and Gedil2019; Hasan et al., Reference Hasan, Choudhary, Naaz, Sharma and Laskar2021). In the past few years, crop diversity has been intensely reduced due to genetic erosion. Therefore, indigenous germplasm has been given preference for the development of mapping populations, heterotic pools and inbreds (Yadav et al., Reference Yadav, Hossain, Karjagi, Kumar, Zaidi, Jat, Chawla, Kaul, Hooda, Kumar, Yadava and Dhillon2015). Conservation and utilization of diverse germplasm for the introgression of unique and desirable genes into the genetic base is essential.
Population structure is an important tool to understand the evolution of plants and the introduction of molecular techniques and DNA sequencing analysis has led to significant improvements in the insights into the genetics of natural populations (Sbordoni et al., Reference Sbordoni, Allegrucci, Cesaroni, White and Culver2012; Boukteb et al., Reference Boukteb, Sakaguchi, Ichihashi, Kharrat, Nagano, Shirasu and Bouhadida2021). Therefore, the objective of the present study was to (i) examine the morphological and genetic diversity of maize inbred lines derived from different source germplasm of eastern Himalayas using SSR markers; (ii) genetic relationships analysis among early generation maize inbreds; (iii) population structure analysis and allelic patterns across populations; (iv) studying the correlation and linkage of major QTLs with agronomic traits.
Materials and methods
Plant materials
A set of 30 indigenous early-generation maize inbred lines were selected based on the phenotypic diversity, grain colour and unique traits like mucous producing roots (self-fertilizing ability), prolificacy or multiple cobs bearing and stay green trait to assess the genetic diversity and study the population structure. These early-generation lines were developed through continuous inbreeding accompanied by selection of desirable traits at ICAR-Research Complex for North Eastern Hill Region (ICAR-RC-NEHR), Manipur Centre using local germplasm collected from different places of Manipur and Mizoram states of India.
Genomic DNA isolation and PCR amplification
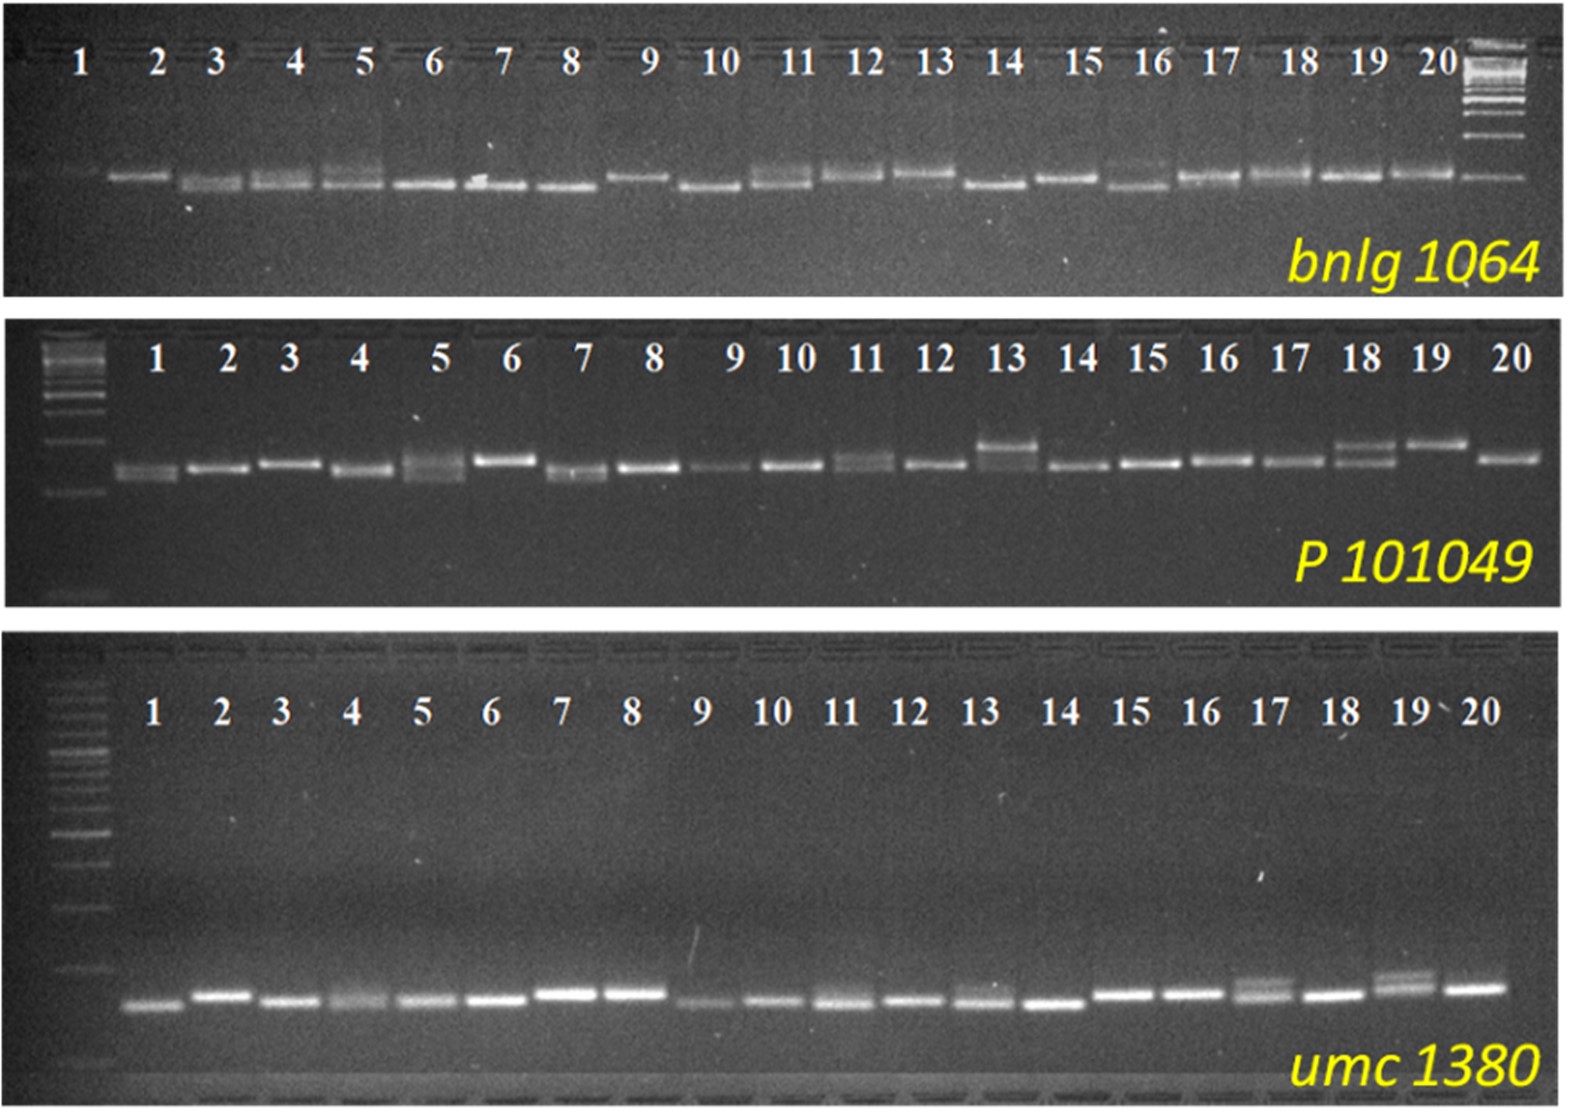
Genomic DNA was extracted from the leaf of the selected genotypes using a modified CTAB extraction protocol (Porebski et al., Reference Porebski, Bailey and Baum1997). DNA concentration was measured on Genova Nano Analyzer UV/VIS (Mumbai, India). The final concentration of extracted genomic DNA was adjusted to 10 ng/μl and used for the PCR amplification. A set of 52 polymorphic Simple Sequence Repeats′ (SSR) markers, selected on the basis of different bin locations to maximize the genome coverage were used to study the allelic diversity and population structure of the maize lines. The primer sequences were collected from the maize genomic database (http://www.maizegdb.org/) and the oligonucleotide primers were synthesized in purified and lyophilized form from GCC Biotech India Pvt. Ltd. (Kolkata, India).
Polymerase chain reactions were carried out on 96-well thermal cycler, Eppendorf-Mastercycler Nexus Gradient (Hamburg, Germany). All PCRs were performed in a final reaction volume of 20 μL with the following reagent components: 2 μl of template DNA (20 ng/μl), 10 μl 2X Hi-Primer Taq PCR Master Mix (GCC Biotech India Pvt. Ltd., India), 1 μl of each forward and reverse primers and 6 μl RNA grade nuclease-free water (GCC Biotech India Pvt. Ltd., India). The amplification conditions were set as follows: initial denaturation at 95°C for 5 min, four cycles consisting of denaturation at 95°C for 45 s, primer annealing ranged between 57 and 60°C for 45 s, primer extension at 72°C for 45 s and then 35 cycles consisting of denaturation at 95°C for 45 s, primer annealing 60°C for 45 s, primer extension at 72°C for 45 s and final extension at 72°C for 8 min. The amplified PCR products were resolved using 3.0% ISSR Agarose (GCC Biotech India Pvt. Ltd., India) stained with ethidium bromide, documented under the gel doc system (Gel DocTM XR+, Biorad, India).
Agronomic performance of inbreds
Each of the 30 maize inbreds (details given in online Supplementary Table S1) was grown in two rows of 3 m length each during spring 2019 and 2020 at the Research Farm of the ICAR-RC-NEHR, Manipur Centre, Lamphelpat and spring 2021 at the Research Farm of the ICAR-RC-NEHR, Sikkim Centre, Tadong following the standard package of practices for maize cultivation. The row-to-row and plant-to-plant distances were maintained at 60 and 20 cm, respectively. The individual plants were carefully selfed and harvested to avoid contamination of inbreds. These early generation inbreds were evaluated for plant height (PH), ear height (EH), number of kernel rows per ear (KRPE), number of kernels per row (KPR), cob length (CL), cob diameter (CD) and 100 kernel weight (KW).
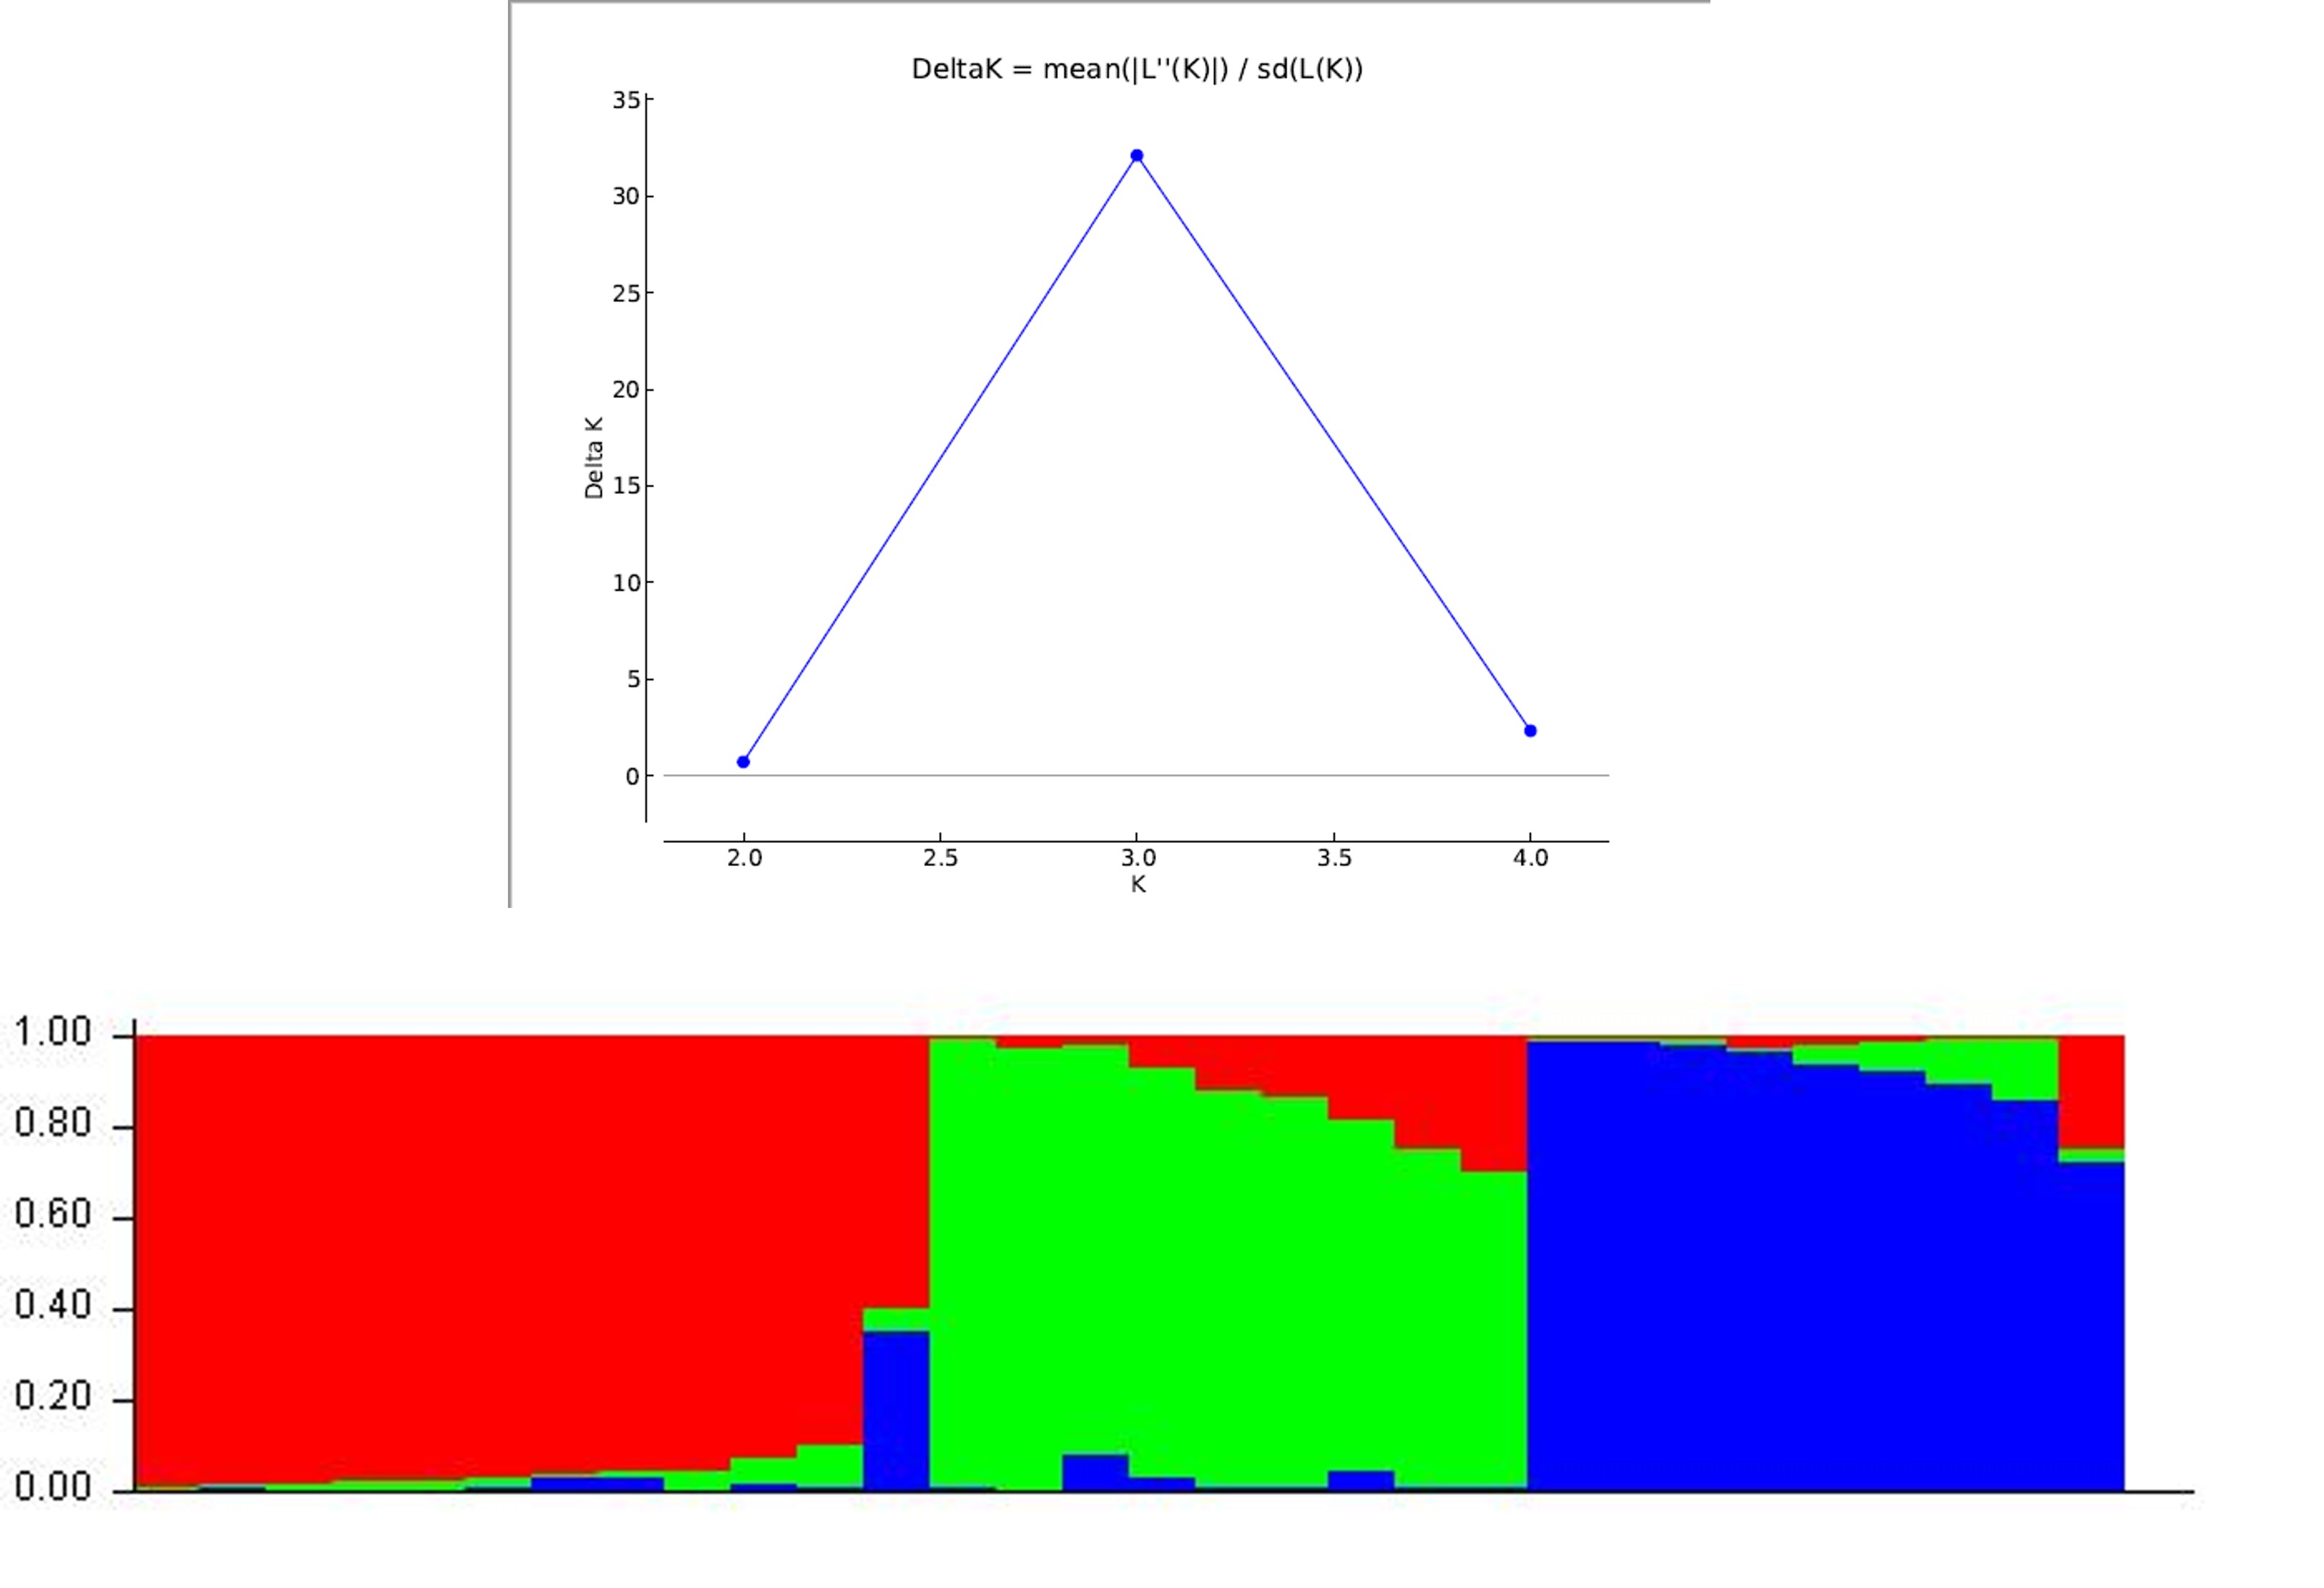
Statistical analyses
The genotypic data of 52 SSR markers were used for the estimation of genetic diversity parameters such as number of alleles per locus (K), observed heterozygosity (H Obs), expected heterozygosity (H Exp) and polymorphic information content (PIC) using the Cervus 3.0 program (Field Genetics Ltd., London, England). GenAlEx 6.502 software (Peakall and Smouse, Reference Peakall and Smouse2012) was used to compute the principal coordinate analysis (PCoA) by plotting the eigenvector values in a scatter graph taking the first principal component and the second principal component as the axes. A hierarchical analysis of molecular variance (AMOVA) of 30 genotypes between the populations was also conducted using GenAlEx 6.502 software (Peakall and Smouse, Reference Peakall and Smouse2012). To determine the presence of the genetic structure, STRUCTURE version 2.3.4 (Pritchard et al., Reference Pritchard, Stephens and Donnelly2000) was run with the number of clusters from K = 1 to K = 5, with five independent replications per K using the admixture model and correlated allele frequencies, a 50,000 burn-in period and 50,000 MCMC to determine approximations of posterior distributions. The optimum K value was determined through the STRUCTURE HARVESTER programme (Earl and Vonholdt, Reference Earl and Vonholdt2012) by estimating the peak value of ΔK using the method of Evanno et al. (Reference Evanno, Regnaut and Goudet2005). The STRUCTURE analyses give a Q-matrix (QST) for each value of K, which lists the estimated membership coefficients for each genotype in each subgroup. An individual has more than 70% of its genome fraction value under a particular K subgroup was assigned to that subgroup. The allele size was evaluated by comparing it with a 100 bp DNA ladder (GCC Biotech India Pvt. Ltd., India) and a phylogenetic tree was constructed using the neighbour-joining method implemented in DARwin-6.0 (Perrier and Jacquemoud-Collet, Reference Perrier and Jacquemoud-Collet2006).
All the statistical analysis of agronomic data was carried out using XLSTAT v2020.4.1 software (www.xlstat.com). The association analysis of seven agronomic traits along with the 52 SSR markers was calculated using GGT 2.0 software (van Berloo, Reference van Berloo2008). The association analysis was calculated based on the squared correlation coefficients between the marker data and trait values (R 2 values) and the associated probabilities of the correlation values. The threshold to declare a significant marker-trait association was set to –log10 (P) = 3.
Results
Genetic diversity of maize inbreds
In the present study, all 52 markers were successfully amplified in 30 maize-inbred lines (online Supplementary Fig. S1). A total of 189 alleles were generated across the 30 genotypes with a mean of 3.63 alleles per locus (online Supplementary Table S2). The allele size of the 52 SSR markers ranged from 50 bp (phi 036) to 295 bp (p 101049) which revealed a high level of genetic diversity among the loci. The PIC value of the markers varied from 0.17 (umc 1622) to 0.76 (umc 1153) with an average value of 0.49 (online Supplementary Table S2). Out of the 52 SSR markers, 24 SSR loci (46.15%) were found to be more informative by having of PIC value of ⩾0.50, depicting the higher capability of these loci to differentiate between the genotypes, determine genetic diversity, gene introgression, genetic conservation, etc. The number of alleles per locus (K) ranged from 2 to 8 with an average of 3.634 ± 1.428. The bnlg1031 marker mapped at 8.06 bin showed the highest number of alleles (eight). The value of expected heterozygosity (H Exp) ranged from 0.19 to 0.80, whereas the observed heterozygosity (H Obs) ranged from 0 to 0.89.
The heterozygosity percentage ranged from 0 (SCM 15/9LC) to 27.45 (GP H 6) (online Supplementary Table S3). The graphical representation of heterozygosity in 30 maize inbreds is depicted in Fig. 1. Out of 30 inbred lines, 13 lines showed heterozygosity ⩽ 10%, which means 43% of the lines attained more than 90% homozygosity. Another three inbred lines viz. GP (H) 38, MN 1, and SCM15/9LC showed heterozygosity of less than 5%, which revealed a high level of homozygosity in these lines. These three inbred maize lines may be considered pure lines which will be useful as parents for the development of hybrid, mapping population, genetic mapping, etc. In the present study, the AMOVA result revealed a higher molecular variance within individuals of the population (96%) than among individuals of the population (4%) (online Supplementary Table S4).

Figure 1. Depiction of allelic patterns of the 52 SSR markers among the 30 early maize inbreds lines through GGT 2.0 software (Van Berloo, Reference van Berloo2008). The colour legends such as red, purple, yellow and grey denotes A, B, H (heterozygotic) and missing alleles, respectively.
Genetic relationships analysis among early generation maize inbreds
The genetic dissimilarity between the genotype pairs ranged from 0.40 to 0.64 with a mean value of 0.57. The cluster diagram grouped the 30 maize genotypes into six distinct major clusters (Fig. 2). The lines developed from the same source population fall under the same cluster/sub-cluster. For instance, lines developed from populations collected from Manipur viz. GP (H) 2, GP (H) 28 and SCM 15/9LC were together in the same cluster i.e., A. Likewise, lines like MZ 2, MZ 70, MZ 24, MZ 42, MZ 40, Kolasib 1(2) and MZ 46(B) developed from populations collected from Mizoram clustered together in the same sub-group viz., B1.

Figure 2. Cluster analysis revealed by 52 SSRs depicting genetic relationship among 30 lines. A, B and C indicate the major cluster, whereas 1, 2 and 3 indicate sub- clusters within each major cluster.
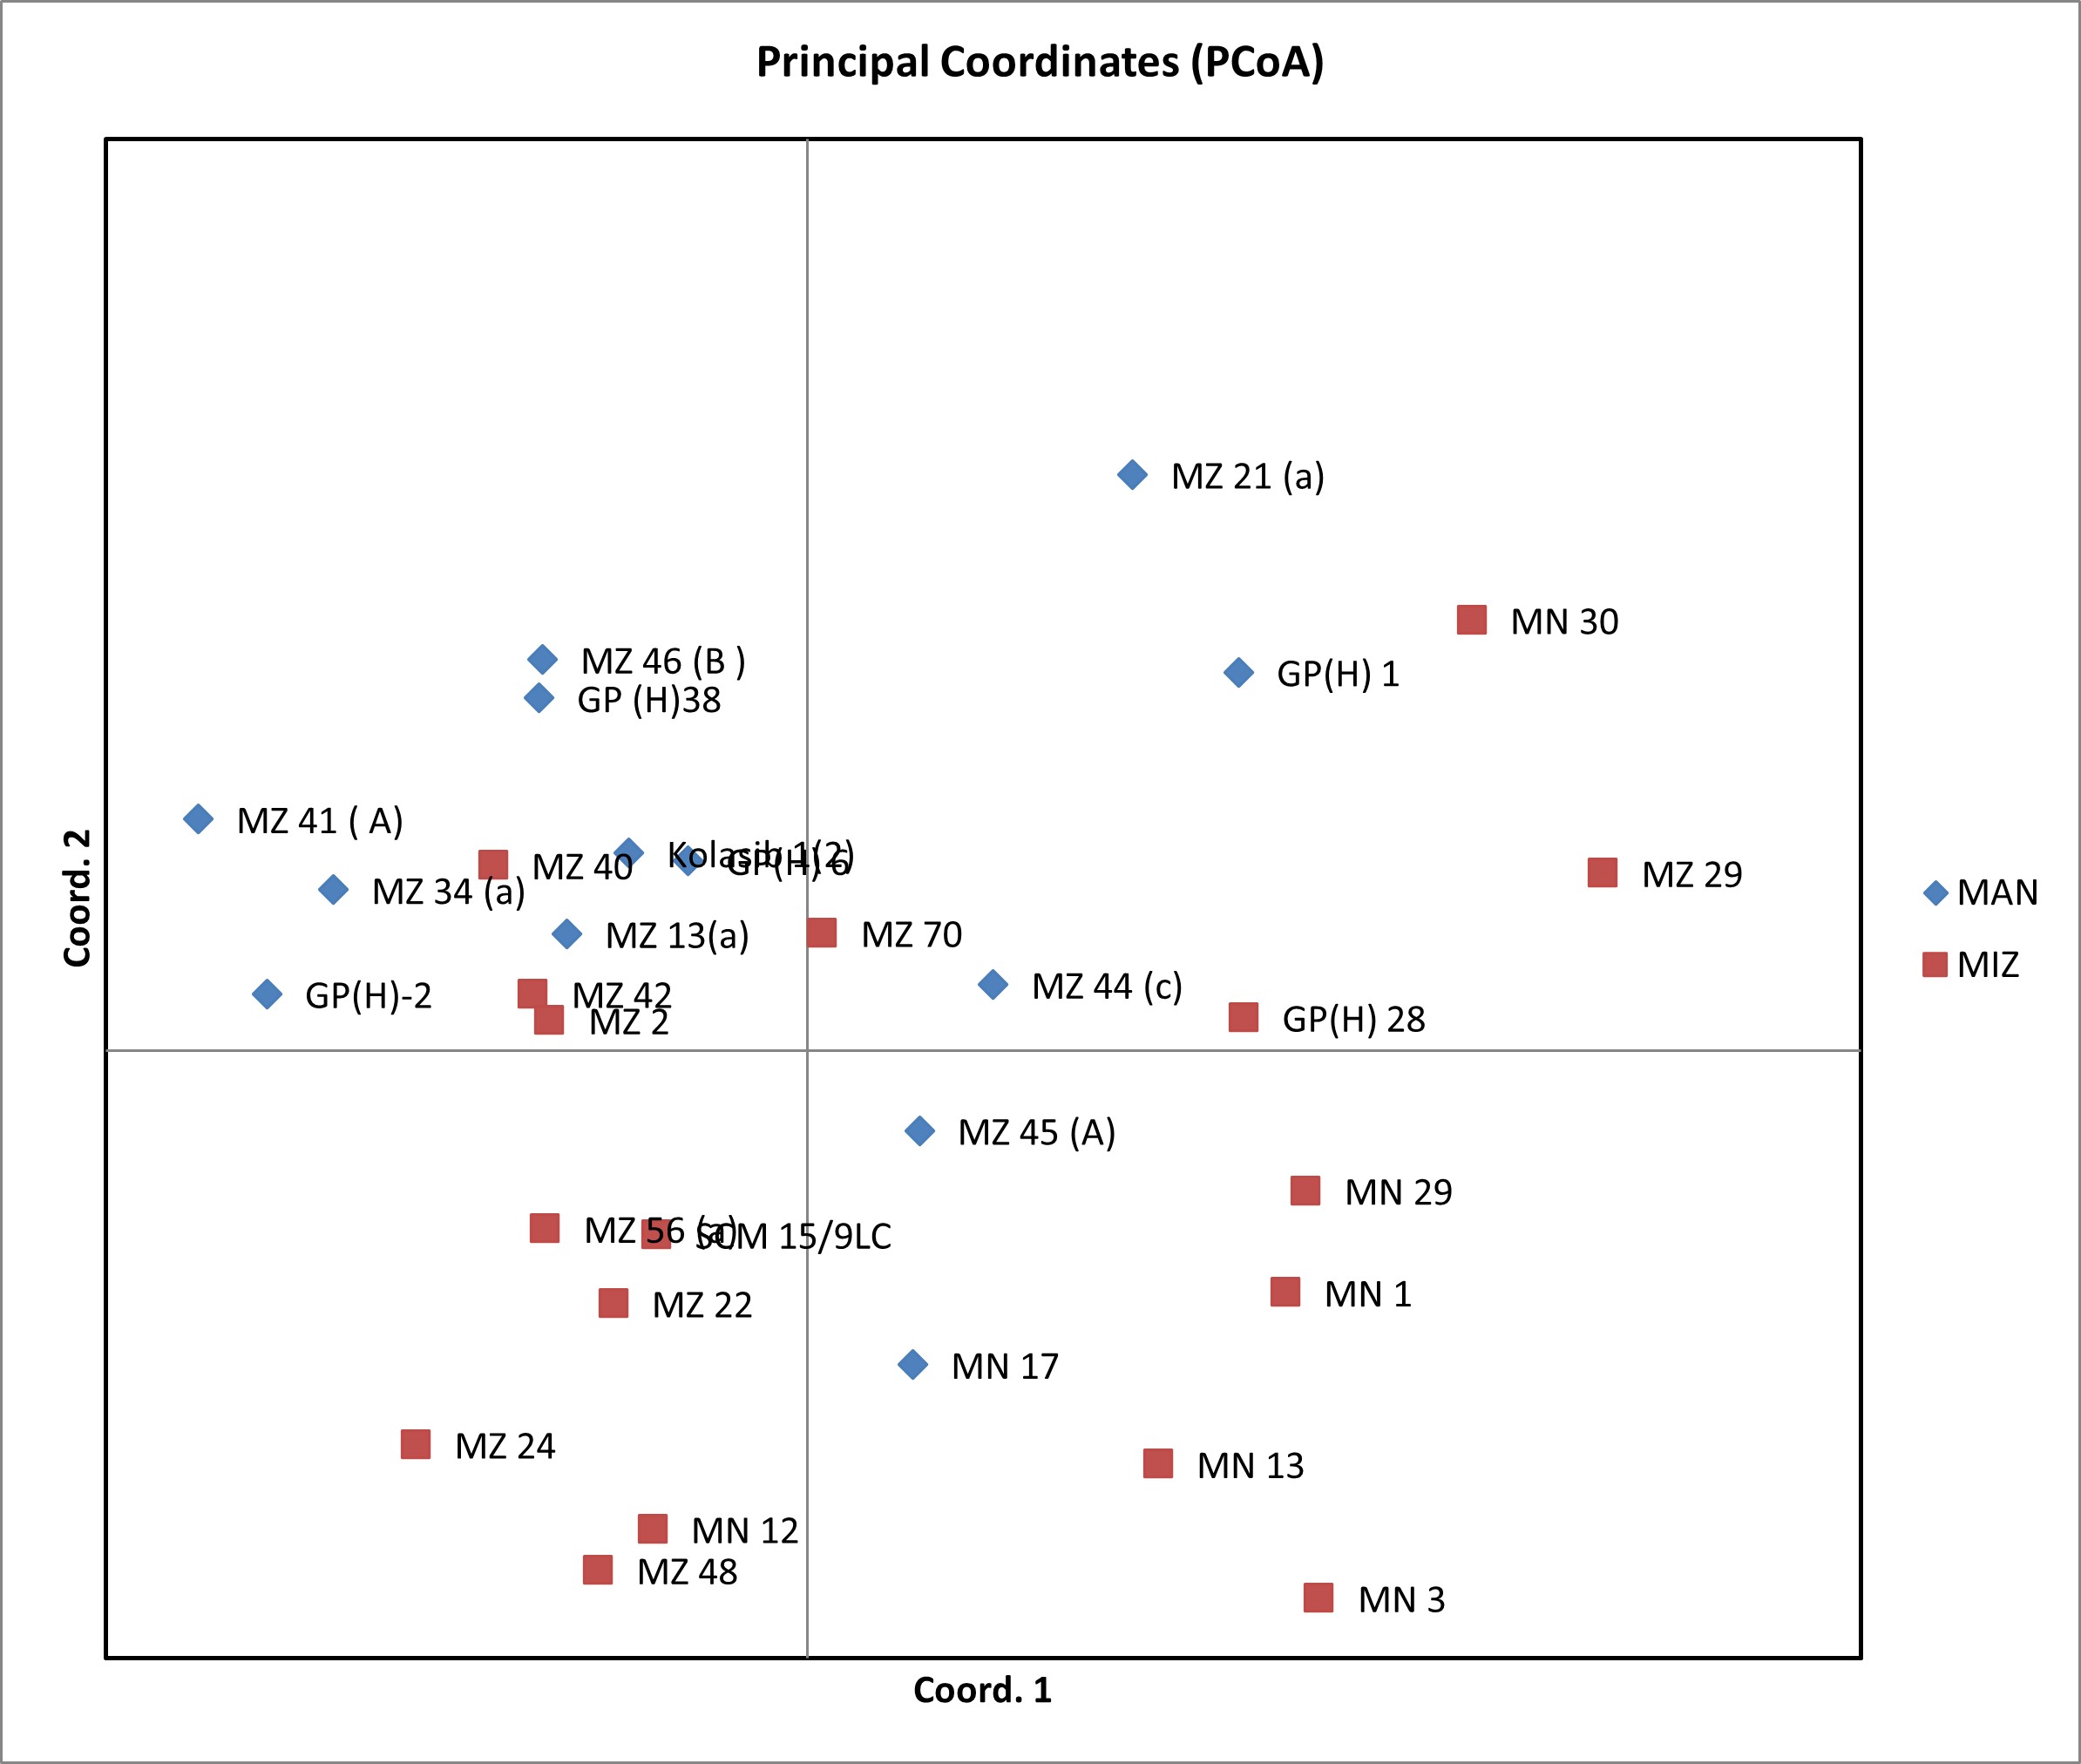
The genotypic PCoA revealed that the lines were distributed in all four quadrangles, showing a high degree of genetic variability. A scatter plot generated from the PCoA analysis showed that the first two components accounted for 9.82% and 8.23% of the genetic variation which resulted in a total genetic variation of 18.05% (online Supplementary Fig. S2). Lines derived from the populations from Manipur were found to be closely placed in genotypic PCoA, while that from Mizoram occupied the nearby axes in the PCoA.
Population structure analysis and allelic patterns across populations
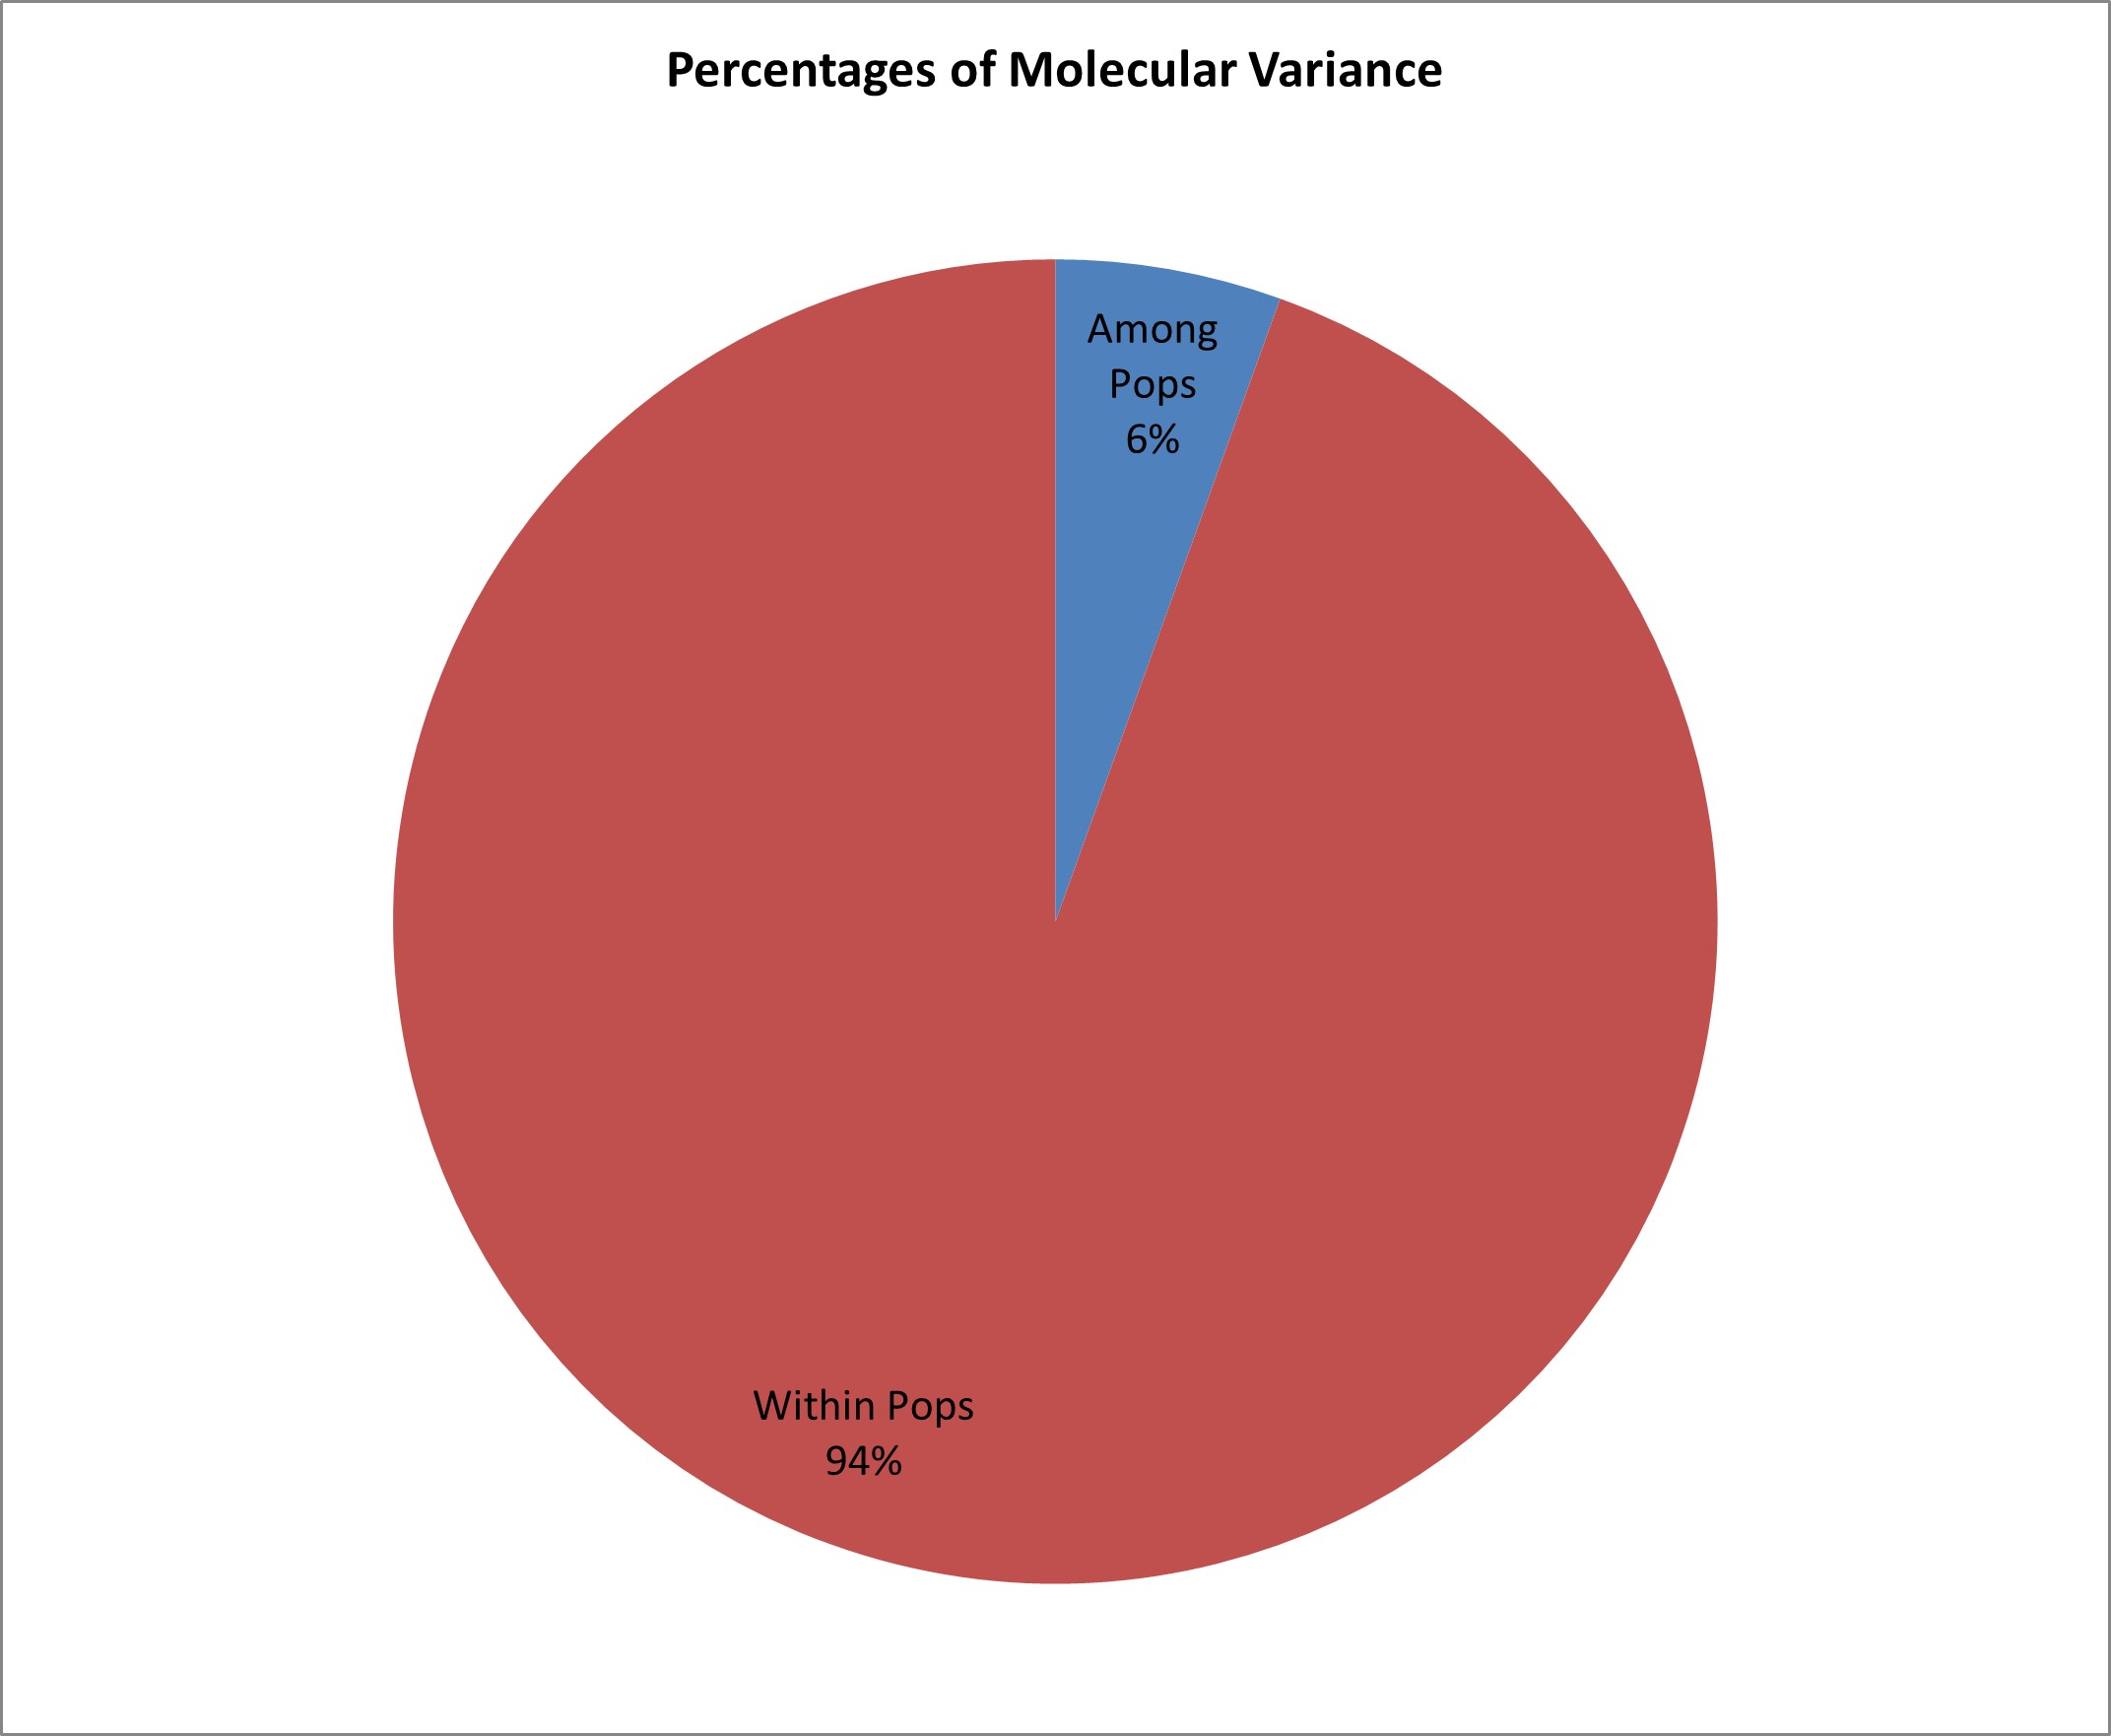
The peak plateau of ad hoc measure ΔK was detected at K = 3 (online Supplementary Fig. S3), which indicated that the entire population can be grouped into three possible groups or sub-populations. The results of the population structure analysis were confirmed by the phylogenetic tree which divided the 30 inbred lines into three clusters and each cluster was further subdivided into sub-clusters. Population structures of 30 genotypes based on 52 SSR markers are shown in online Supplementary Fig. S3. Different colour within the group indicates the proportion of shared ancestry with another group that has the same colour as the admixture. The population structure group of 30 genotypes based on inferred ancestry values was also estimated (online Supplementary Table S3). The percentage of individuals in each population belonging to each group was estimated based on Q-matrix (QST) for each value of K and the cut-off probability for assigning to a group was assumed to be 70%. A set of 29 genotypes out of 30 showed the estimated membership coefficients of more than 70% of its genome fraction value and were therefore assigned to a specific group. Whereas, only one genotype was classified as admixture since it showed estimated membership coefficients of less than 70%. To conduct the analysis of molecular variance (AMOVA), the 30 maize inbred lines were grouped into two: Manipur (developed from the Manipur collection) and Mizoram (developed lines using the Mizoram collection). AMOVA revealed highly significant variance among populations and within individuals of the population (online Supplementary Table S4). The overall genetic differentiation indicated that 6% of the total variance is due to differences among populations, while 94% of the total molecular variance is accounted for within-population molecular variance (online Supplementary Fig. S4).
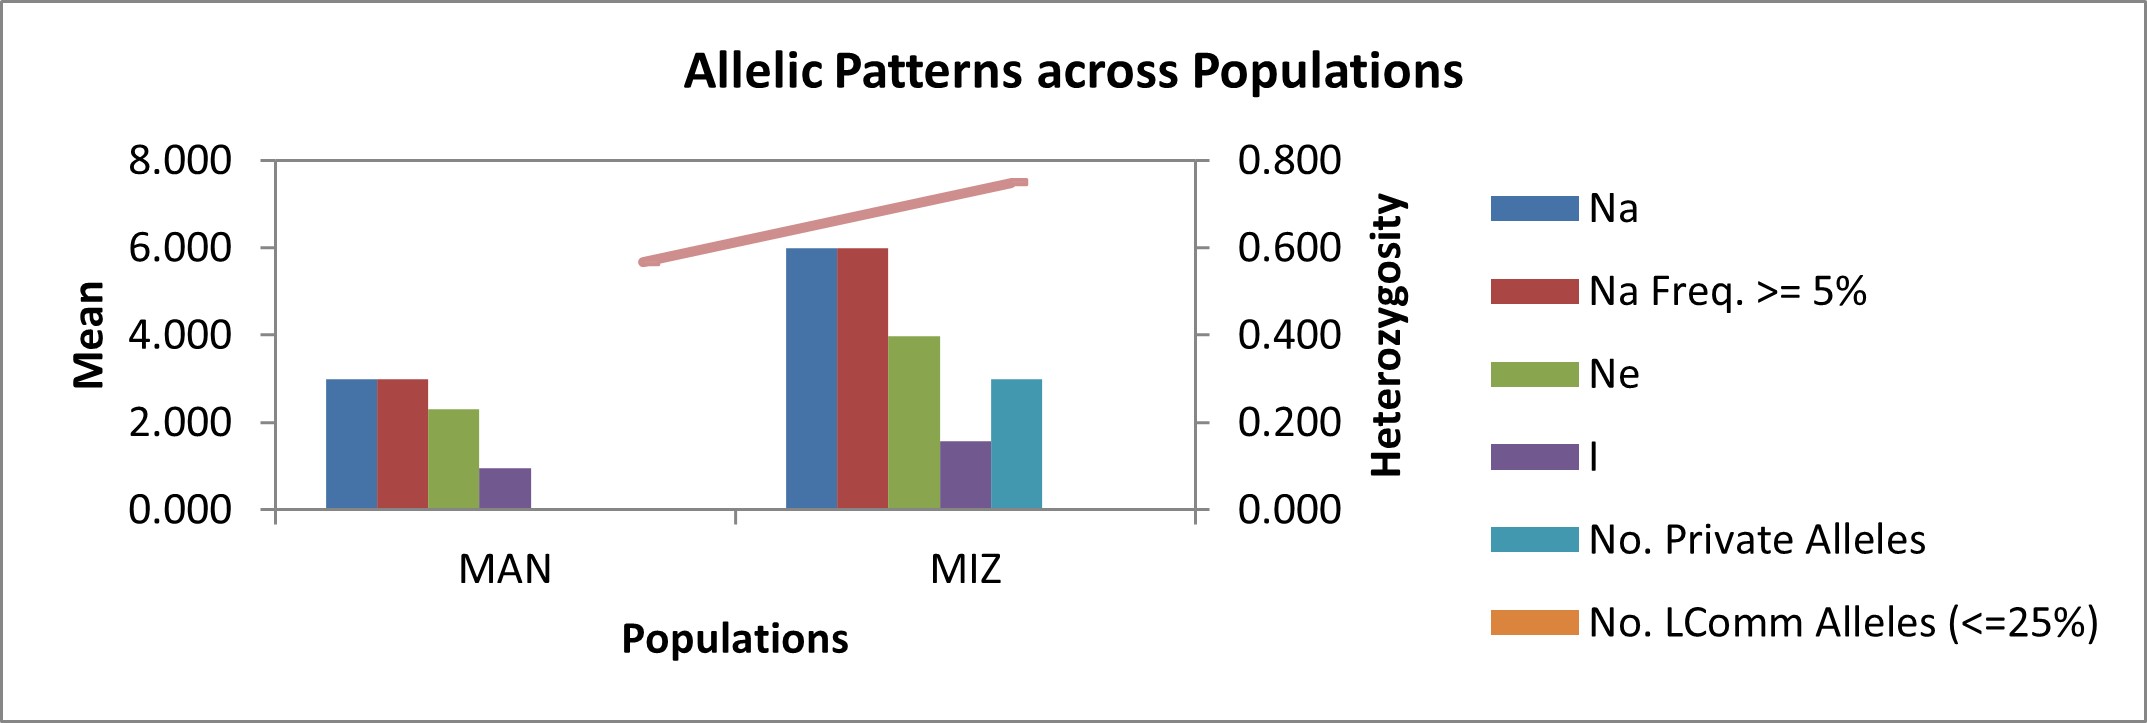
The mean effective numbers of allele (Ne) were estimated to be 2.31 and 3.99 for Manipur (MAN) and Mizoram (MIZ) populations, respectively (online Supplementary Table S5). The number of alleles (allelic richness) in a population is an important and fundamental measure of genetic variation in a population and is a useful statistic for identifying populations for conservation. The Shannon's information index (I) was calculated as 0.96 and 1.58 for MAN and MIZ populations, respectively. Among 189 alleles generated across the 30 genotypes, three private alleles (number of alleles unique to a single population) were detected in SSR marker umc 1354. These private alleles were revealed in three genotypes originating from Mizoram. A graph depicting allelic patterns across populations is given in online Supplementary Fig. S5. The results of this study provide useful information to maize breeders for the selection of inbred lines and for making promising cross combinations based on genetic distance and clustering.
Agro-morphological diversity and marker-trait association
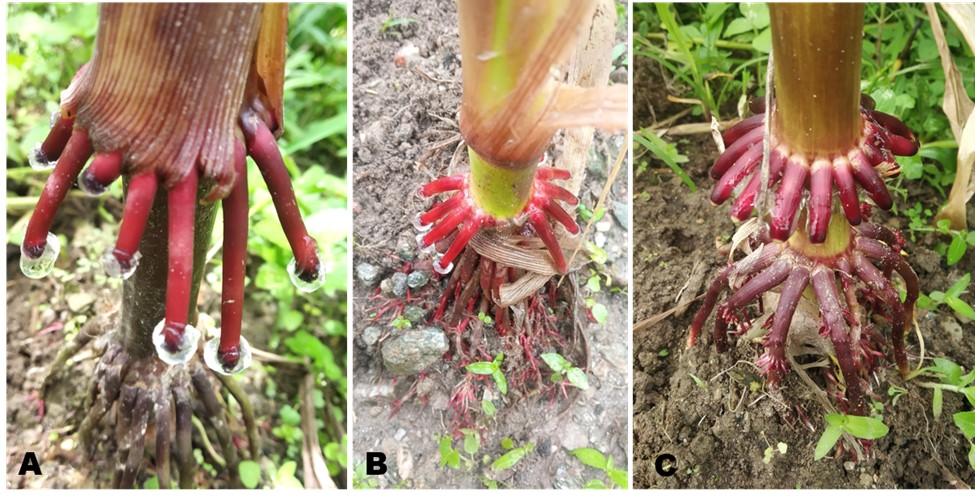
The statistical parameters related to agro-morphological traits of the lines are presented in Table 1 and huge morphological diversity was observed. The mean phenotypic data of the 30 lines are provided in online Supplementary Table S6. A positive correlation was found between important agronomic traits (Table 2). The significant and highest positive correlation was observed between PH and CD (r = 0.22) followed by KPR and CD (0.21) and EH and KW (r = 0.16). We have identified three lines viz. MZ 46 (B), MN 13 and MN 3 producing mucous in the bract roots (online Supplementary Fig. S6). The identified lines have reddish colour aerial roots extending up to 2–3 nodes with high branching of brace roots. These lines can be used in developing mapping populations and further in developing hybrids with the potential to fix atmospheric nitrogen.
Table 1. Descriptive statistics of seven traits in the 30 early maize inbreds used in the study

PH, plant height (cm); EH, ear height (cm); KRPE, number of kernel rows per ear; KPR, number of kernel per row; CL, cob length (cm); CD, cob diameter (cm); KW, 100 kernel weight (g).
Table 2. Estimation of correlation coefficients at seven agronomic traits in the 30 early maize inbred lines used

*, ** & ***Significance at P value < 0.001, 0.01 and 0.05.
In our study, significant marker-trait associations were conducted between the SSR markers and the seven agro-morphological traits (Table 3). The lowest R 2 value (0.12) was detected in mmc 0411, umc 2064, umc 1506 and bnlg 2190, which was associated with KRPE, CL, CD and KW and the highest (0.25) was in umc 1153, which was associated with KPR. It was observed that seven major QTLs were probably linked with different agronomic traits viz. PH, EH, KRPE, KPR and KW since the phenotypic variance (%) were estimated to be more than 15%. The SSR markers identified in the present study may serve as useful molecular markers for selecting important agronomic traits in maize breeding.
Table 3. Association analysis of seven agronomic traits with 52 SSR markers in 30 maize inbred lines

Discussion
We investigated the extent of genetic diversity, genetic relationship, population structure and allelic pattern using microsatellite markers apart from the study of agro-morphological diversity. The different multivariate techniques revealed the presence of three major possible groups, which was in support with the pedigree information, as most of the lines originated from Mizoram clustered in one group while that originated from Manipur tended to cluster into the same group. However, it was observed that the clustering patterns did not distinguish the lines based on phenotypes and traits like grain colour, stay green character, mucous producing roots, etc. Our findings are in agreement with previous studies by Xia et al., Reference Xia, Reif, Melchinger, Frisch, Hoisington, Beck, Pixley and Warburton2005 and Semagn et al., Reference Semagn, Magorokosho, Vivek, Makumbi, Beyene, Mugo, Prasanna and Warburton2012 who also reported lack of clear clustering patterns in maize germplasm from CIMMYT based on phenotypes, grain colour or type, maturity, environmental adaptation and heterotic groups. The lines we used in our present studies are unique at its own since they have been developed from the landraces collected from the unexplored remote areas of eastern Himalayas. In our studies, the allele size of the 52 SSR markers ranged from 50 bp (phi 036) to 295 bp (p 101049) with an average of 3.63 alleles per marker locus which revealed a high level of genetic diversity among the loci. Compared to the finding of previous researchers including, Hung et al. (Reference Hung, Huyen, Loc and Cuong2012) (117 alleles, 3.26 average alleles/ locus), Yu et al. (Reference Yu, Wang, Sun and Liu2012) (60 alleles, 2.73 average alleles/locus), Devi et al. (Reference Devi, Devi, Kumar, Sharma, Beemrote, Chongtham, Singh, Ch, Singh, Ningombam, Akoijam, Singh, Singh, Monteshori, Omita, Prakash and Ngachan2017b) (203 alleles, 2.69 average alleles/ locus), more diversity was observed in our lines since high number of alleles per locus is attributable to the higher genetic diversity of the lines.
In the present study, a large variation was observed among the inbreds (online Supplementary Table S4). Similar findings were also reported by Prasanna (Reference Prasanna2012), Silva et al. (Reference Silva, Cantagalli, Saavedra, Lopes, Mangolin, Pires, Machado and Scapim2015), Belalia et al. (Reference Belalia, Lupini, Djemel, Morsli, Mauceri, Lotti, Khelifi-Slaoui, Khelifi and Sunseri2019) and Mukri et al. (Reference Mukri, Gadag, Bhat, Nepolean, Gupta, Mittal S, Kumar and Pal2022). Such inbreds can be used as parental lines in developing hybrids that are well adapted to the erratic weather conditions of northeast India. In the cluster diagram, inbreds derived from the same source population clustered themselves in the same group. Similar results on genetic relationship analysis in maize were also reported by Devi et al. (Reference Devi, Devi, Kumar, Sharma, Beemrote, Chongtham, Singh, Ch, Singh, Ningombam, Akoijam, Singh, Singh, Monteshori, Omita, Prakash and Ngachan2017b) and Badu-Apraku et al. (Reference Badu-Apraku, Garcia-Oliveira, Petroli, Hearne, Adewale and Gedil2021). Most of the inbreds derived from the landraces of Mizoram fall in the same group (group B) in the cluster diagram, suggesting the presence of high genetic similarity that may be due to the same selection history and the use of closely related populations to derive the inbreds. The presence of a high level of genetic similarity among the inbreds was also reported by Semagn et al. (Reference Semagn, Magorokosho, Vivek, Makumbi, Beyene, Mugo, Prasanna and Warburton2012), Wu et al. (Reference Wu, Vicente, Huang, Dhliwayo, Costich, Semagn, Sudha, Olsen, Prasanna, Zhang and Babu2016) and Wegary et al. (Reference Wegary, Teklewold, Prasanna, Ertiro, Alachiotis, Negera, Awas, Abakemal, Ogugo, Gowda and Semagn2019). The genotypic PCoA revealed that the lines were distributed in all four quadrangles, showing a high degree of genetic variability.
In our study, only one inbred was under the category of admixture, indicating that it is of mixed pedigree, possibly because of the introgression of the gene(s) while developing the inbred line (Yin et al., Reference Yin, Sa, Lim and Lee2019). Group 3 had the greatest diversity comprising diverse source populations from Manipur and Mizoram. Such findings were also reported by many researchers namely Boakyewaa et al. (Reference Boakyewaa Adu, B-Apraku, Akromah, Garcia-Oliveira, Awuku and Gedil2019) and Badu-Apraku et al. (Reference Badu-Apraku, Garcia-Oliveira, Petroli, Hearne, Adewale and Gedil2021). The clustering pattern of all the genotypes based on marker information had a close correlation with their pedigree information. The lines developed from the same source population fall under the same cluster/sub-cluster. For instance, lines developed from populations collected from Manipur viz. GP (H) 2, GP (H) 28 and SCM 15/9LC were together in the same cluster i.e., A. Likewise, lines like MZ 2, MZ 70, MZ 24, MZ 42, MZ 40, Kolasib 1(2) and MZ 46(B) developed from populations collected from Mizoram clustered together in the same sub-group viz., B1. Thus, the presence of distinct subgroups among the inbreds could be attributed to artificial selections made at different locations.
A high range of variation was found for all seven agronomic traits which revealed a high level of variation in these lines. The marker-trait association study showed that many markers are associated with the agronomic traits studied and these markers will be useful for identifying major QTLs linked with desirable traits and also in selecting lines having good agronomic characteristics.
The self-fertilizing maize was reported for the first time in a landrace of maize in the Sierra Mixe region of Oaxaca, Mexico which was reportedly grown using traditional practices with little or no fertilizer (Van Deynze et al., Reference Van Deynze, Zamora, Delaux, Heitmann, Jayaraman, Rajasekar, Graham, Maeda, Gibson, Schwartz, Berry, Bhatnagar, Jospin, Darling, Jeannotte, Lopez, Weimer, Eisen, Shapiro, Ane and Bennet2018). Such maize plants have finger-like roots protruding from their stalks that secrete mucus, in which bacteria live. The bacteria fix nitrogen from the air and convert it to a different form of nitrogen and later the plants soak up the fixed nitrogen in the mucous through the finger like roots (Devi et al., Reference Devi, Avasthe, Meetei, Dutta, Das, Singh, Bhutia, Kumar, Saha and Mishra2022). Three of our lines viz. MZ 46 (B), MN 13 and MN 3 has secreted mucous in the roots. However, further detailed studies regarding the microbiome association might provide insight of the microbes involved and the related mechanism.
Conclusion
The present study is focused on the estimation of genetic diversity, population structure, marker–trait association as well as agro-morphological diversity of the early generation inbreds developed from the local germplasm collected from different places in the eastern Himalayan region. The lines developed from the local germplasm may not be good yielder but it may harbour many useful unique traits. These lines can be exploited as donor in various maize improvement aspects as well as parents in hybrid development programmes.
Supplementary material
The supplementary material for this article can be found at https://doi.org/10.1017/S1479262123000862
Acknowledgements
The research work is a part of the ICAR-funded project (code IXX13387). The authors would like to acknowledge the farmers of Manipur and Mizoram for sharing seeds of maize germplasm and the Director, ICAR-RC- NEH Region, Umiam for the funds and facilities provided.
Competing interests
The authors declare that they have no competing interest.