


1. Introduction
Preferential Trade Agreements (PTAs) require Rules of Origin (RoO) to establish the conditions products must meet to be eligible for preferential market access to prevent transshipment of products across partners with low tariffs in which there is negligible regional content (e.g. repackaging). These RoO are almost invariably product-specific rules (PSRs). They vary across partners for the same product with countries often engaged in multiple PTAs with the same partner, adding to the compliance costs of meeting origin requirements to benefit from preferential access. In practice, as documented in the literature, RoO are a nightmare for producers and customs officials alike and may undercut the objective of stimulating trade flows among PTA partners.Footnote 1 Some observers describe the result as giving preferences with one hand and taking them away with the other through RoO.Footnote 2 Observers have advocated reforms, ranging from simplification to outright elimination of RoO.Footnote 3
The proliferation of PTAs has created a situation reminiscent of the rise in non-tariff barriers (NTBs) following the reduction in tariffs negotiated under the GATT rounds of multilateral tariff reductions. Noguès et al. (Reference Noguès, Olechowski and Winters1986) were the first to systematically document the rise, extent, and diversity in NTBs across industrial countries’ imports. As in Noguès et al. (Reference Noguès, Olechowski and Winters1986), our interest is in moving the international community towards liberalization [simplification] of such restrictions. We draw on the World Bank Deep Trade Agreements (DTA) database that collects information on 172Footnote 4 PTAs covering 181 exporter/importer country pairs for the period 1990–2015. The DTA data base does not cover all preferences – non-reciprocal preferential schemes are excluded – and important information is missing, notably Preference Utilization Rates (PURs). As in Noguès et al. (Reference Noguès, Olechowski and Winters1986), our first objective is to inform on the landscape of PSRs across a large number of PTAs. Our second objective is to try to detect the impact of PSRs on bilateral trade flows.Footnote 5 This exercise is exploratory because of the lack of data on PURs. The lack of systematic data on PURs imposes challenges on the evaluation of the effects of PSRs as they cannot be directly associated with the corresponding amount of trade realized under a specific PTA.Footnote 6 Hence the ‘(more)’ in the paper's title.
We use gravity estimation at the detailed Harmonized System (HS) 6-product level where PSRs apply to compare trade flows between PTA partners and nonmembers. Controlling for the level of preferential margins, our estimates show that rules allowing choice between alternatives of rules have the strongest positive impact on trade value. However, adopting stricter rules such as imposing combinations of different rules annihilate the positive trade effect of granting preferential tariffs. Simulation-based estimates suggest that a simplification of PSRs would be associated with larger bilateral trade flows at the product level. A simulation of a radical simplification reform that leads to the adoption of flexible rules (i.e. choice of PSRs) increases global trade under PTA by between 2.7% and 4% on average during the sample period.
The remainder of the paper is organized as follows. Section 2 classifies different PSRs across 128 reciprocal PTAs covered in the paper explaining assumptions used to classify them in sufficiently broad categories to be amenable to statistical analysis. Section 3 presents the final dataset and descriptive statistics. Section 4 presents the gravity results and Section 5 reports simulation estimates of the effects of a move towards simpler PSRs. Section 6 concludes. The discussion paper version gives a fuller description of the PSRs, of the sample construction and additional estimates.
2. Classification of PSRs
We use the Deep Trade Agreement (DTA) database (Angeli et al., Reference Angeli, Gourdon, Gutierrez, Kowalski, Mattoo, Rocha and Ruta2020).Footnote 7 The working paper version of this article (Gourdon et al., Reference Gourdon, Gourdon and de Melo2023) provides further details on classification, the sample of PTAs and other data choices. The DTA classifies RoO under two categories: regime-wide rules (RWRs) and product-specific rules of origin (PSRs). RWRs cover general conditions for qualification under the preferential regimes as well as certification requirements. While both general conditions and certification requirements vary across PTAs, differences across RWRs are much less than for PSRs. We focus only on the impact of PSRs which, unlike RWRs, are non-overlapping at the product–country–PTA level, whereas the RWRs are not unique at the HS level. Hence, it is difficult to compare two sets of RWRs as the selected criteria often have little overlap. Non-overlap in PSRs is important since the objective is to use observed trade flows at the same HS6 level under different PSRs to estimate differences in compliance costs across PSRs.
PSRs are defined at the HS6 tariff level. As the HS was not designed to confer origin, methods for determining sufficient processing or substantial transformation of a product differ across the universe of PTAs. Figure 1 describes the two types of criteria used to identify origin and how they are mapped into the 7 non-overlapping PSR categories.Footnote 8

Figure 1. Mapping of types and construction of PSR categories
Notes: Numbering in parenthesis relates to the PSR category indicated.
Source: Based on Gourdon et al. (Reference Gourdon, Kniahin, de Melo and Mimouni2021) and Cadot and Ing (Reference Cadot and Ing2016). Authors’ classification.
The Wholly Obtained (WO) criterion is self-explanatory: all materials entering production of the final good must originatefrom PTA members. The ‘Substantial transformation criterion (STC) specifies that the country of origin is the country where the last substantial transformation took place, and this transformation must be sufficient to give its essential character to a commodity’. STC is further identified by three additional rules: Change of Tariff Classification (CTC) at three levels (chapter, heading, and subheading); Value Content Requirement (VCR); and a Technical Requirement (TR). Under the Value Content (VC) rule, the exported good must reach a threshold percentage value of locally or regionally (i.e. among PTA members) produced inputs. In our sample, a percentage value is reported for about 60% of PSRs with a VC. About a quarter of VCs with available values require a VC of 40% with the rest being about equally distributed below and above this value. In some comparisons, we break down VCs into three categories, below 40%, equal to 40%, and above 40%. A technical requirement (TR) rule requires an exported good to have undergone specified manufacturing or processing operations, such as a chemical reaction, which are deemed to confer origin of the country in which they were carried out.
The STC criterion is also implemented by composite alternatives (variations on the right-hand side of Figure 1). First, the three STC categories are used in existing trade agreements as stand-alone or in combination with other rules (COM), or as alternative rules (ALT). when there is a choice between rules. Second, exceptions (EXC) can be attached to a particular CTC rule, generally prohibiting the use of non-originating materials from a particular HS subheading, heading, or chapter for goods supposed to qualify via a CTC.
Figure 1 lists the seven mutually exclusive categories we designed for this exploration.Footnote 9 This reflects decisions not to disaggregate CTC according to sub-levels and to group all types of combinations into one group (COM), all types of alternatives into one group (ALT), and all rules with an exception to CTC into one group (EXC). These seven categories are entered separately in the regressions reported in Section 4.
2.1 Ranking PSRs by Degree of Restrictiveness
Overlapping membership in PTAs complicates the exporter's decision whether to apply for preferential status. Put simply, if the preferential margin for an HS product is less than the compliance cost that must be added to unit production costs, it is not profitable for a firm to file for preferences. Assuming the exporter knows all opportunities and RoO associated with each one, observing which option was selected when filing at customs would be an indicator of the least-cost option and an indication that choosing preferential access is less costly than exporting under MFN status.Footnote 10
Unfortunately, data on utilization of preferences required to assess the restrictiveness of RoO are limited. Only a few countries publish trade statistics according to the trade regime requested by exporters.Footnote 11 Thus, data on PURs are rarely available even at the aggregate (annual) flow level. Data at the transaction level, needed to disentangle fixed from variable costs, are only available in a few instances.Footnote 12 Even if PURs are available, positive PURs are only suggestive that preferential margins are greater than compliance costs given that firms have different production costs, may produce multiple products, and prices will deviate from production costs under imperfect competition.Footnote 13
The literature attempts to rank PSRs using an observation rule inspired from Estevadeordal's (Reference Estevadeordal2000) restrictiveness index (‘R-index’) as, for example, Ayele et al. (Reference Ayele, Gasiorek and Koecklin2023) with their constructed RoO Restrictiveness Index (RoO-RI). To facilitate comparison across PSRs, we decide to classify most categories as stand-alone rules with composite rules classified under the ALT and COM categories.. Also, we refrain from assigning an ordinal index to each category, preferring to keep comparisons by broad groups of PSRs to help design simulations simplifying choices among PSR categories.
Despite these efforts at clarity, as discussed below, one can only be sure of restrictiveness for different values of value-content percentages at the firm level (when percentages are available) and for one classification among stand-alone rules, the CTC (with no exceptions attached): A change of chapter (CC) has higher compliance costs than a change of heading (CH), itself easier to satisfy than a change of subheading (CS), i.e. CS ≤ CH ≤ CC across CTC categories. Ranking other PSRs is ambiguous given heterogeneity in firm costs within an HS6 category. Expected rankings of compliance costs are discussed in the results section.
3. The PSR Landscape
Figure 2 shows the number of PTAs over the panel for five of the six 5-year periods (data for 1990 dropped because of only three PTAs in that year) with the composition across the seven categories of PSRs. For each year, the panel is obtained by omitting trade flows less than $1000 and export values below the 25th percentile. We also drop observations for which MFN tariffs are already zero prior to the implementation of the PTA. The final data sample represents around 68% of global imports (excluding intra-EU trade) on average across years. This is the dataset used in the results reported in Sections 4 and 5.

Figure 2. Composition of PSR categories over the sample period
Note: Average number of PTAs in parenthesis below year.
Source: Authors.
During the 1995–2015 period, the following shifts in the distribution on PSRs are observed:
(i) the share of ALT rules diminished by one half;
(ii) the share of value content requirements (VCR) doubled;
(iii) the share of technical requirements (TR) and exceptions (EXC) fell;
(iv) the share of wholly obtained (WO) remained constant.
Overall, except for WO, which is by far the least used PSR (about 10% of the other categories), the distribution of PSRs is fairly evenly distributed around the other categories. Prima facie, these observations over the period 1995–2015 suggest two opposite trends since, (i) is an indication of a shift towards more restrictiveness while (iii) suggests a shift towards less restrictive rules.
Since we assume full liberalization among PTA members, the preferential margin equals the MFN tariff. About half of the observations are in the 5%–15% margin across all PSR categories. The distribution of PSRs at the HS2 level (see discussion paper version) with the WO PSR concentrated in animal products and VCR concentrated in. Textiles and Machinery/Electrical stand out as the two sections with the largest dispersion of PSRs, particularly the COM and ALT PSR categories.
In sum, the 7 categories of PSRs constructed for this paper are widespread, being present in all sections with some sections having simultaneously a high combination of ALT and COM categories, the combination making it difficult to assess the restrictiveness of the PSRs on that product, and even more so at the section level. To borrow from Johnson's (Reference Johnson1960), appraisal of tariffs in the period of high tariff protection, the overall picture is one of ‘made-to-measure’ PSRs. The next sections try to tease out patterns in this maze of PSRs.
4. Trade Flows Sensitivity to PSRs
We start by investigating the sensitivity of bilateral trade flows to PSRs by comparing correlates of bilateral trade flows in the group of countries that have reciprocal PTAs (almost all FTAs) against corresponding bilateral trade flows in a control group consisting of all other trade flows under MFN (i.e. all products under bilateral PTAs have a PSR). Then, we restrict the sample to countries which have reciprocal PTAs. This sample allows for a sharper identification of the effect of PSRs on trade flows by comparing trade flows with different PSRs across PTAs.
4.1 Full Sample
The full sample consists of bilateral imports from origin i, to destination j of HS6 product k in panel year t where ijkt-combinations are either not part of a reciprocal PTA and hence are assumed to trade under MFN-tariff, or are part of a reciprocal PTA between countries ij in year t. Under a given PTA between a pair of ij-countries, each bilateral trade flow included in the agreement has one of the seven (l = 1, ⋅ ⋅ ⋅ , 7) PSR categories described in Figure 1. Within the same PTA, different HS6 products will typically have PSRs in different categories. For example, for all countries that have signed the CAFTA-DR agreement, trade under HS6 product 8207.19 (rock drilling or earth boring tools) falls under the PSR category CTC which needs to be fulfilled to obtain a preferential tariff (if not fulfilled, the firm exports under MFN tariff). HS6 product 854419 (insulated electric conductors) was allocated a PSR category COM. These PSR categories are indexed at the HS6 level (r ijkl) within a PTA and do not change over time once the PTA has been signed. Products excluded from the PTA negotiations are not included in the dataset.Footnote 14
We estimate the following baseline specification (1) in the spirit of Cadot and Ing (Reference Cadot and Ing2016):
 $$\eqalign{X_{ijkt}& = exp[ \beta _0 + \beta _1ln( {1 + tar} ) _{\,jkt}^{MFN} + \beta _2I_{ijt}^{RTA} + \beta _3( {I_{ijt}^{RTA} \;x\;ln( 1 + tar_{\,jkt}^{MFN} ) } ) + \mathop \sum \limits_{l = 1}^7 \beta _{4l}\;r_{ijkl}\cr & \quad + \sigma _{ijk2} + {\rm \eta }_{it} + {\rm \theta }_{\,jt}] + {\rm \epsilon }_{ijkt}\;}$$
where i = 1, …, 135; j = 1, …, 181; k = 1, …, 5018; t = 1, …, 6
The dummy variable
 $$I_{ijt}^{RTA} = \left\{{\matrix{ {1, \;} \hfill & {i\,\hbox{and}\,j\,\hbox{are}\,\hbox{members of the same PTA in year}\,t} \hfill \cr {0, \;\;} \hfill & {\hbox {otherwise}} \hfill \cr } } \right.$$
indicates whether i and j belong to the same PTA.
 $$r_{ijkl} = \left\{{\matrix{ {1, \;} \hfill & {{\hbox{if rule}}\,PSR_l\,{\hbox{applies to product}}\,k\,{\hbox{in the agreement between}}\,i\,{\hbox{and}}\,j} \hfill \cr {0, \;} \hfill & {\hbox {otherwise}} \hfill \cr } } \right.$$
is a set of dummies indexed over l for each of the 7 PSR categories. Since the categories are non-overlapping, only one PSR is applicable to each HS6 product k in a PTA between i and j.
In (1), X ijkt is the trade value of HS6 product k, between origin i and destination j in panel year t,  $ln( 1 + tar_{jkt}^{MFN} ) $ is the logarithm of the applied MFN tariff (ln(1 + MFNjkt/100)) on product k defined by the destination country for all origin countries (most-favored nation rule). Coefficient (β 0) measures the average trade value of the control group. Coefficient (β 1) is the tariff elasticity. It measures the response of bilateral trade flows to a percentage change in the MFN tariff. Coefficient (β 2) captures the effect of PTA membership alone. The coefficient, (β 3), on the interaction between PTA membership and the MFN tariff captures the trade effect of a change in tariff-preferential margins in a PTA $( {I_{ijt}^{RTA} x\;tar_{jkt}^{MFN} } ) $ as we assume full tariff liberalization for products under a PTA.Footnote 15 Coefficient β 4l captures the differential effects of PSRs on trade flows among PTA.
A set of fixed effects controls for omitted confounding factors: σ ijk2 are omitted origin–destination–product fixed effects (ijk2-level) at the HS2 product level. These fixed effects account for endogeneity concerns due to reverse causality since signing a PTA and thereby offering preferential tariffs seems more likely with economies that are already a significant trading partner with the liberalizing economy (Baier and Bergstrand, Reference Baier and Bergstrand2007). With these fixed-effects we exploit variation across time and control furthermore for time-invariant origin–destination characteristics, such as bilateral distance.Footnote 16 Non-observable outward and inward Multilateral Resistance (MLR) terms are captured by η it and θ jt.Footnote 17 As these fixed-effects capture any time-varying origin and destination specific characteristics, they also absorb the size terms Y i,t and E j,t in the gravity equation.  ${\rm \epsilon }_{ijkt}$ is the error term clustered at the treatment level (ijk2).
All estimates are over 5-year intervals. This gives trade flows enough time to fully adjust to the implementation of PTAs (Trefler, Reference Trefler2004; Baier & Bergstrand, Reference Baier and Bergstrand2007; Anderson & Yotov, Reference Anderson and Yotov2016; Heid et al., Reference Heid, Larch and Yotov2021). This time-interval approach does not allow to capture dynamic adjustment effects that can be identified using consecutive-year data as in Egger et al. (Reference Egger, Larch and Yotov2022). The trade data are from CEPII's BACI data base based on UN COMTRADE but that reconciles direct and mirrored data. Applied MFN tariffs are from UN COMTRADE.
We use the Poisson Pseudo Maximum Likelihood (PPML) estimator to account for heteroscedasticity in trade data (Silva and Tenreyro, Reference Silva and Tenreyro2006).Footnote 18 Due to data limitations, we cannot include intra-national trade flows as suggested in Yotov (Reference Yotov2012) and Bergstrand et al. (Reference Bergstrand, Larch and Yotov2015).Footnote 19
Table 1 reports the results. Column 1 explores membership in reciprocal PTAs relative to all other trade flows. The estimates do not include PSRs. The coefficient estimate (β 2) is insignificant indicating that PTA membership alone does not result in a significant difference in bilateral trade flows. The trade elasticity to a change in MFN tariffs in the control group is negative and significant (β 1 = −2.216). For PTA members, an increase in tariffs is an increase in the preferential margin (under the assumption of full tariff liberalization), (β 3 = +1.457). Both coefficients are estimated with precision and conform with expectations.
Table 1. Results (full sample)

Standard errors are in parentheses. ***p < 0.01, **p < 0.05, *p < 0.1.
Notes: PPML estimates. Standard errors are clustered at the treatment level (ijk2). Huntington-Klein (2021).
Source: Authors’ estimates.
Column 2 decomposes the distribution of bilateral trade flows PSR categories, (β 4l), relative to corresponding trade flows under the control group. To identify all seven categories of PSRs in the estimations, Table 1 drops the stand-alone dummy on PTA membership  $(\beta _2I_{ijt}^{RTA} ) $. Trade flows are significantly larger under the PSR category of technical requirements (TR) and significantly smaller under the large group of trade flows with a change of tariff classification (CTC). Therefore, complex PSRs, such as technical requirements, appear to be prevalent among large bilateral trade flows under RTAs. All other categories are insignificant. The estimate of the elasticity of trade with respect to MFN tariffs decreases in absolute terms to β 1 = −1.854 compared to column 1, which is plausible as we do not control in this specification for the positive effect of the preferential margin on trade under a PTA.
Column 3 adds the preferential margins through the interaction term (β 3). The results suggest that the major driver of the positive effects of PTA arises through the preferential tariff ((β 3) = 1.396), slightly lower than the coefficient in column 1.
Column 4 decomposes the effect of changes in the preferential margin on bilateral trade flows across the PSR categories by interacting changes in the preferential margin with each of the seven PSR categories, (β 4l). An increase in the MFN tariff significantly reduces bilateral trade for the control group with an elasticity of (β 1 = −2.21). This estimate, stable across specifications further splits PSR categories into sub-groups (different CTCs and two categories of VCRs) has the expected sign but is on the high side, possibly reflecting omitted factors not captured by the fixed effects.
Importantly, the estimates of the interaction term across PSR categories are heterogenous, suggesting that a same percentage change in the preferential margin has significantly different trade effects across the seven categories. The estimated response is strongest under the ALT rule (2.934) followed by WO, TR, CTC, and COM while EXC and VCR are insignificant.
In column 5, we therefore exclude bilateral trade flows of partner countries that are part of a non-reciprocal PTA. This reduces the sample by 5%. Results are largely unchanged. Overall, the trade elasticity of preferential margins is stronger for PSRs with choice (ALT) while PSRs requiring meeting several criteria (COM) have the lowest elasticity.
To sum up, our specification is based on the idea that we exploit variation across time to capture the trade effect of PTA membership with different PSR categories at the product-level. The results in Table 1 suggest that the preferential margin is the driving force of the trade effect of PTA membership. Since compliance costs vary across PSRs, they will offset to a different extent the tariff reductions realized when complying to a specific PSR category. Furthermore, the results in Table 1 suggest that flexible PSRs where exporters have a choice among PSRs respond more strongly to an increase in the preferential margin than all other (less flexible) PSR categories. This suggests that variable compliance costs (as captured by a % of trade value) are significantly lower for flexible rules than for all other PSR categories. PSR categories with a low trade elasticity of preferential margins would be stricter as the costs of complying offset the tariff reductions reflected in the preferential margin.
4.2 PTA Sample
Now we restrict the sample to all countries involved in a reciprocal PTA. As in Carrère et al. (Reference Carrère, Olarreaga and Raess2021), all comparisons are across the different PSRs within this more homogenous sample. The baseline specification becomes:
 $$X_{ijkt} = exp[ \beta _0 + \beta _1( 1 + tar_{\,jkt}^{MFN} ) + \mathop \sum \limits_{l = 1}^6 \beta _{4l}\;r_{ijkl} + \sigma _{ijk2} + {\rm \eta }_{it} + {\rm \theta }_{\,jt}] + {\rm \epsilon }_{ijkt}$$
All coefficients have the same interpretation as for Table 1 except that (β 1) captures the effect of a change in preferential margin for the EXC category which is excluded and used as reference category.Footnote 20
Table 2 reports the results of estimating equation (2). The sample is still large (1,455,683 observations) even though it is reduced to around 10% of the full sample used in Table 1. The overall fit, as measured by the pseudo R2 is tighter (0.59) than in the full sample (0.55). Note that restricting the sample to PTAs, results in little variation across time as the observations are always part of a PTA throughout the sample period and PSRs do not change across time.
Table 2. Results for PTA sample

Notes: PPML estimates. ***p < 0.01, **p < 0.05, *p < 0.1.
Source: Authors’ estimates.
Column 1 shows that the effect of MFN tariffs on bilateral trade under PTA (β 1) is negative: a 1% increase in tariffs is associated with a decline in bilateral trade of 0.58%. A comparison of the PSR coefficients, (β 4l), trade under the VCR rule is on average significantly higher (1.06) compared to the EXC category followed by WO, TR, while COM and ALT are not significantly different from the EXC rule.Footnote 21 This could be an indication that compliance costs are less under a VCR rule than other rules.
Column 2 reports the trade elasticities of PSRs to a change in preferential margin. In this specification the coefficient on the MFN tariff (β 1) captures the trade elasticity of preferential margins associated with the reference category, EXC. Coefficient estimates for the PSRs dummies are close to those in column 1 except for the WO and TR dummies, which are now insignificant. The relatively close values for the PSR dummies in columns 1 and 2 suggest that the model is not mis-specified. The trade elasticities to an increase in preferential margin (coefficients on the interaction term between MFN tariff and preferential margin) are heterogenous across PSRs and are not significant under clustering for the standard errors. This is confirmed by the ordered elasticities with associated 5% confidence intervals shown in Figure 3. However, the rankings are the same as those that would obtain in the much larger full sample.

Figure 3. PSR responses to an increase in preferential margin (PTA sample)
Notes: The figure reports the coefficients in table 2, column 2 relative to the excluded group, EXC. Note that those coefficients crossing the red line are not significantly different from the effect on the control group (EXC rule).
Source: Authors’ estimates
Column 3 reports the results when errors are not clustered so that any remaining correlation pattern between pairs of countries over time are not controlled for, as it is when errors are clustered over country pairs as done in Table 1 following the suggestion of Bertrand et al. (Reference Bertand, Duflo and Mullainathan2004). Now, coefficient estimates for ALT, TR, VCR, and WO are significant. Since the point estimates are unchanged, the descending order is still: ALT, WO, TR, and VCR. In sum, the pattern follows those in the full sample where the trade elasticity of preferential margins is stronger for PSRs with choice (ALT).Footnote 22
For robustness, column 4 replicates the estimates of column 2 by controlling for confounding factors at the HS6-product level instead of HS2-level through ijk6-level fixed effects. The overall fit improves (pseudo R2 of 0.92). The coefficients on the PSR dummies are now positive and significant for the ALT and CTC category and negative for the WO rule. Compared with column 2, the point estimates on the interaction between PSR dummies and MFN tariffs are still positive and significant for the WO rule but insignificant for the ALT rule. Also, the estimate of the elasticity of MFN tariffs associated with the COM rule is negative (−2.22) and significantly different from the EXC rule (reference category). In sum, the conclusion holds that the COM rule, often classified as one of the most stringent PSRs, has the strongest negative effect on changes in tariffs on bilateral trade.Footnote 23
5. Simulating Trade Effects from Moving to a Flexible PSR Category
To quantify the trade effect of simplifying PSRs, we use the estimates in Table 1, column 5 in the full sample and those in Table 2, column 3, for the PTA sample.Footnote 24 We simulate a scenario in which observations with restrictive PSR categories, namely EXC, COM, TR, WO, CTC, and VCR, adopt the alternative rule, ALT, arguably the most flexible PSR rule in our classification. This amounts to replacing in equation (1) for the full sample the estimated coefficient values for each of the restrictive PSRs for observation ijkt with the corresponding ALT coefficient, keeping the original preferential margin attached to each ijkt combination.
Adopting the more flexible ALT rule in the PTAs in the DTA database would increase bilateral trade under PTA on average by 2.7% during the sample period by using the coefficients of the full sample (Table 1, column 5) and 4% by using the results of the PTA sample (Table 2, column 3). Figure 4 plots the densities of simulated trade growth separately for OECD and non-OECD exports for all pairs of countries under PTAs when adopting the ALT rule across the board using the coefficients of the full sample. Both densities are right-skewed. The average effect on the intensive margin of trade is highest for non-OECD exports to non-OECD countries (3%) and OECD exports to non-OECD countries (2.9%), followed by non-OECD exports to OECD countries (1.86%) and OECD to OECD countries (1.5%).Footnote 25 The simulation results suggest that the trade effect is generally stronger for accessing to non-OECD markets, where preferential margins are higher on average due to higher MFN tariffs.Footnote 26
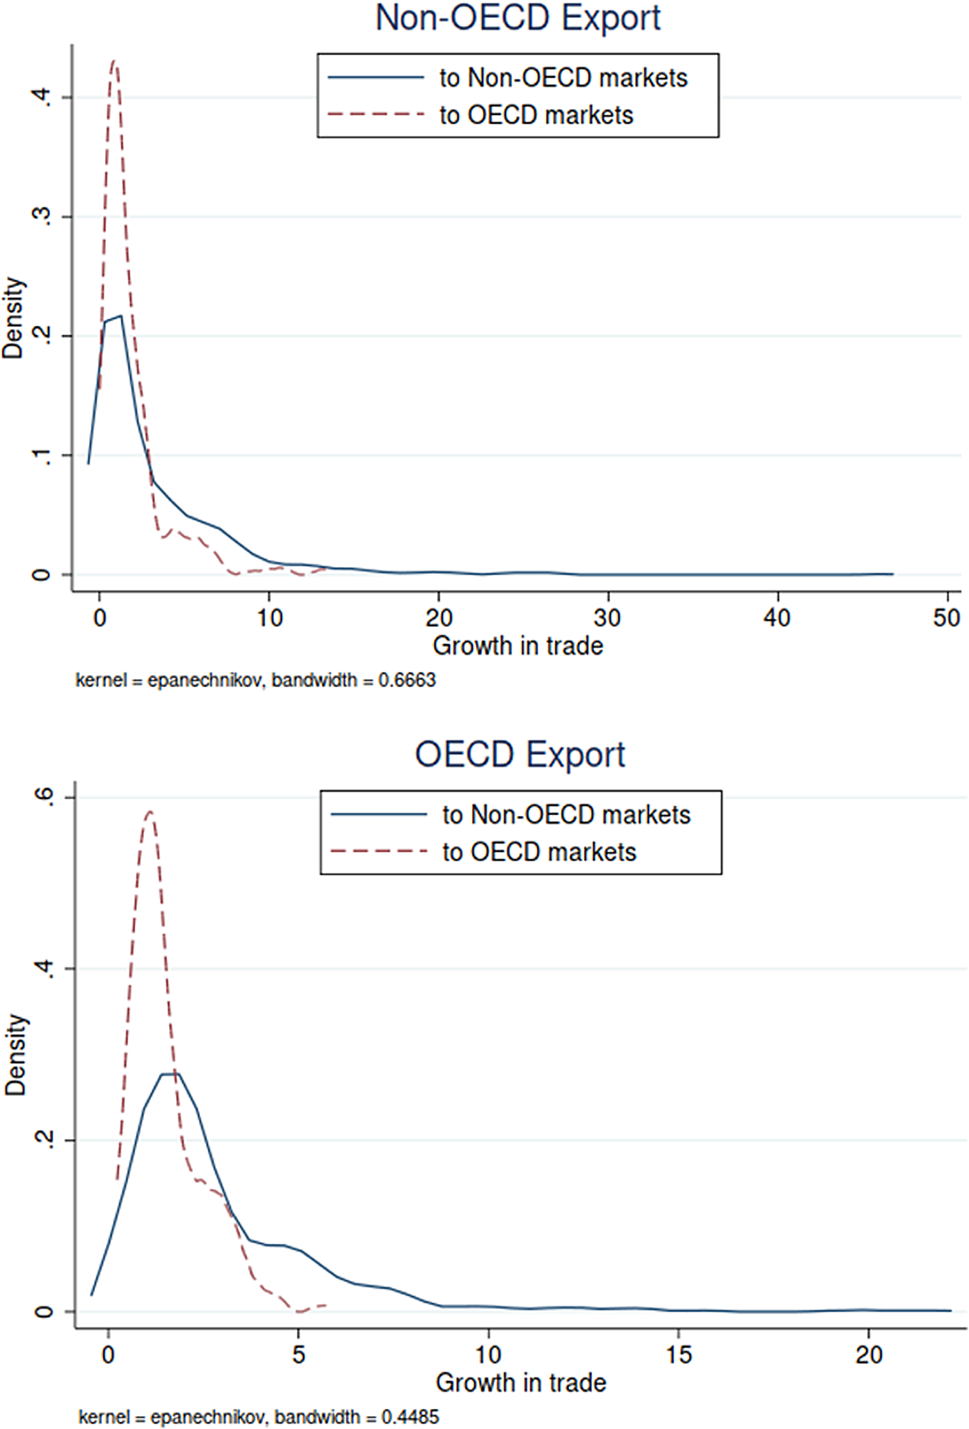
Figure 4. Simulated effects on bilateral exports of moving to more flexible PSRs
Notes: Each one of EXC, COM, TR, WO, VCR, and CTC PSRs coefficients in coefficients table 1, column 5 were replaced by the ALT coefficients. Growth rates reported for the range (−0.5%; 50%.).
Source: Authors’ estimates.
6. Conclusions
Rules of origin are necessary instruments in preferential trade agreements to ensure that a product fulfills origin requirements before it enters a member country with the aim to avoid trade deflection. Yet, the existing literature emphasizes the non-negligible compliance costs associated with product-specific rules (PSRs) of origin. Empirical evidence points towards adverse effects of these rules on bilateral trade and calls for simplification.
This paper systematically explores the effect of PSRs on the intensity of bilateral trade across 128 reciprocal preferential trade agreements and investigates heterogeneity across seven mutually exclusive categories of PSRs. The paper exploits a large database from the World Bank's newly released Deep Trade Agreement (DTA) database covering information on product-specific rules of origin at the HS6-level for the period 1990–2015. To our knowledge, this is the first documented evidence of trade effects of different categories of PSRs across the quasi-full range of worldwide reciprocal PTAs.
Compliance costs of PSRs vary across different categories of PSRs. Controlling for the level of preferential margins, the results show that rules allowing to choose between alternatives have the strongest positive impact on trade value. Adopting stricter rules, such as imposing combinations of different requirements, largely annihilate the positive trade effect of granting preferential tariffs.
These results are particularly relevant in the context of trade policy negotiations. In defining PSRs in PTAs, policy makers may want to consider moving from restrictive PSR categories, and thus from those associated with higher compliance costs, towards more flexible ones. Our simulation exercise quantifies the trade effect of simplifying PSRs. A simulation of a radical simplification reform that leads to the adoption of rules where producers can choose among alternative PSRs increases global trade under PTA by between 2.7 and 4% on average during the sample period. Overall, the exploratory results in this paper support calls for simplification of PSRs voiced in the literature (Cadot and de Melo (Reference Cadot and de Melo2008); Hoekman and Inama (Reference Hoekman and Inama2018); Mavroidis and Vermulst (Reference Mavroidis and Vermulst2018)).
This paper is exploratory. More satisfactory calculations of preferential margins will be possible when data on applied bilateral tariffs become available. Importantly, preference utilization rates on reciprocal RTAs and non-reciprocal RTAs, such as AGOA and EBA, would allow a better appreciation of benefits of preferential tariffs once PSRs are factored in.
Acknowledgements
This paper is a shortened version of Gourdon et al. (Reference Gourdon, Gourdon and de Melo2023). Thanks to Marietta Angeli, Michel Anliker, Céline Carrère, Anne-Célia Disdier, Bernard Hoekman, Marcelo Olarreaga, Angelo Secchi. and two referees for helpful comments and to participants at the workshop on the future of PTAs at the World Trade Institute for feedback. Julien Gourdon and Jaime de Melo acknowledge financial support from the Agence Nationale de la Recherche of the French government through the program “Investissements d'avenir” (ANR-10-LABX-14-01).


