


Consumption of water instead of sugar-sweetened beverages is associated with a number of health benefits, including improved weight status, reduced dental caries and increased cognitive functioning( Reference Wang, Ludwig and Sonneveille 1 – Reference de Ruyter, Olthof and Seidell 11 ). Studies suggest that more than half of children and adolescents in the USA fail to drink adequate amounts of water( Reference Drewnowski, Rehm and Constant 12 – Reference Kenney, Long and Cradock 16 ). Since children spend a substantial time in school, water access in schools is an important but under-investigated point of inquiry.
In 2010, California elevated the importance of water access in schools when it enacted SB 1413, a law that mandated all public schools to provide mealtime access to free drinking-water where meals are served and eaten (i.e. food-service areas)( 17 ). In the same year, the federal Healthy Hunger-Free Kids Act of 2010 passed and included a similar provision requiring all schools participating in the National School Lunch Program to make free, potable water accessible where meals are served( 18 ).
Despite this growing attention from policy makers, little is known about the current state of drinking-water access in schools. There are only three published, national cross-sectional studies that examine access to free water in US schools( Reference Hood, Turner and Colabianchi 19 – Reference Onufrak, Park and Wilking 21 ). A 2011–2012 Bridging the Gap mail survey of public school principals found that 86–89 % of students attended schools with free drinking-water access in the cafeteria( Reference Hood, Turner and Colabianchi 19 ). A 2011–2012 US Department of Agriculture online survey of school food authority directors found that 97–99 % of schools provided access to free drinking-water with meals( Reference Laurie, Standing and Chu 20 ). In a 2010 national mail survey of children aged 9–18 years, which examined drinking-water access throughout the school campus, 57 % of youth reported there were many working water fountains or dispensers at their school, 40 % reported there were only a few, and 3 % reported there were none( Reference Onufrak, Park and Wilking 21 ).
There are also regional studies of water access in US schools, including data from the California Health Interview Survey, an annual representative survey of children aged 12–17 years, which includes student reports of water access in school( Reference Bogart, Babey and Patel 22 ), a survey of food-service directors in Massachusetts public middle and high schools, which used questions similar to the US Department of Agriculture survey noted above( Reference Kenney, Gortmaker and Cohen 23 ), and our own survey of school administrators from a representative sample of California public schools, which used the validated tool highlighted here( Reference Patel, Hecht and Hampton 24 ). Aside from our own, none of these studies have used validated survey questions about water access or water-related policies or practices.
Both California studies mentioned above found that approximately one-quarter of public schools did not offer free drinking-water in the cafeteria( Reference Bogart, Babey and Patel 22 , Reference Patel, Hecht and Hampton 24 ). In the Massachusetts study of school food-service directors, 98 % reported that their school provided free drinking-water in the cafeteria. Direct observations in these same schools, however, revealed that only 48 % had drinking-water available in the cafeteria( Reference Kenney, Gortmaker and Cohen 23 ). Thus, it is possible that current national surveillance of school water access( Reference Hood, Turner and Colabianchi 19 , Reference Laurie, Standing and Chu 20 ), which relies on school administrator surveys that have not been validated, may overestimate access to drinking-water in schools.
While observational site visits are considered the gold standard for evaluating water access on school campuses( Reference Berdanier, Dwyer and Heber 25 ), this approach is time- and resource-intensive. To fill the need for a validated, low-cost and efficient strategy to examine school water access, we validated a school administrator telephone survey of water availability and water-related policies and practices through school observational visits and reviews of school policy documents.
Methods
Study participants
The present study took place from January to May 2011. The National Center for Education Statistics’ Common Core of Data (CCD)( 26 ) was used to develop a sampling frame of 1313 schools in the California Bay Area region (Alameda, Contra Costa, Marin, Napa, San Francisco, San Mateo, Santa Clara, Solano and Sonoma counties), excluding non-traditional schools (vocational, special education, alternative, Kindergarten to Grade 8, Kindergarten to Grade 12). To understand water access in schools of various locales and school types, schools were stratified by CCD urban-centric locale and the three levels of school common in the USA (elementary, middle and high school). Locales (large, midsize or small cities; large, midsize or small suburbs; fringe, distant or remote towns; and fringe, distant or remote rural areas) were collapsed into four categories: city, suburb, town and rural area. Within these categories, schools were further stratified by elementary, middle and high school to create twelve distinct sampling strata (e.g. city–high school, suburb–elementary school). To obtain the goal of twenty-four schools from a wide range of locales and school types, a random number generator was used to sample two schools in each stratum (1·8 % of the total sampling frame).
An invitation letter was mailed to the school principal at each eligible school. Research staff then contacted the school principal by telephone to explain the study, answer questions and schedule a telephone survey. If a school principal was unable to participate, thought that another administrator would be more knowledgeable or preferred to delegate the task, other on-site school administrators (e.g. assistant principals, site facilities directors) familiar with school water access and water-related policies were eligible to participate. School administrators were contacted until they declined participation, at which point the next school in the survey stratum was sampled.
The study consisted of two stages: a semi-structured 15–20 min telephone interview with a school administrator followed by an observational visit to the school. Participants received a $US 50 gift card.
School sociodemographic data (mean student enrolment, percentage of students who qualified for free or reduced-price meals, student race/ethnicity, percentage of English learners) were obtained from the California Department of Education’s Education Data Partnership( 27 ).
Instrument development
Administrator telephone survey
A telephone survey for school administrators (see online supplementary material) was developed to measure three main outcomes: (i) availability of free water (location, type and quantity of water sources); (ii) policies and practices related to water access and infrastructure (e.g. flushing water outlets after a period of non-use, testing water outlets for contaminants); and (iii) availability and price of plain bottled water, flavoured bottled water and sports drinks. Questions about bottled water access in schools were included to enable comparison of access to free drinking-water with that of bottled water for purchase in schools. Questions about other competitive beverages (beverages offered for sale on the school campus outside the federally reimbursable meal programmes)( 28 ) were limited to sports drinks for two reasons: (i) to minimize respondent burden; and (ii) other than flavoured milk, sports drinks were the only sugar-sweetened beverages allowed for sale in California public schools at the time of the study( 29 ). Participants were also asked about their current role at the school (e.g. principal, assistant principal) and length of time in their current position.
A telephone survey, rather than a mail or online survey, was used because researchers hypothesized that a telephone survey would garner a more favourable response rate and provide school administrators with an opportunity to ask clarifying questions that would increase survey accuracy. Survey questions were developed based on a review of existing literature on access to drinking-water and common competitive beverages in school settings, as well as previous research conducted by the principal investigator and other experts( Reference Patel, Bogart and Uyeda 30 ). Study collaborators, the California Food Policy Advocates and Public Health Law & Policy (now ChangeLab Solutions), provided guidance regarding content and wording of questions. Fifteen experts from across the country also reviewed the instrument to improve content validity. The survey was pilot-tested for length and ease of administration in ten schools that were ineligible to participate in the study, including schools outside the Bay Area and non-traditional public schools. The survey was revised based on the pilot testing.
Observational validation instrument
We developed an observational instrument divided into sections corresponding to the three main telephone survey outcomes. At least two research staff completed the observational instrument for each school. Kappa statistics for observational variables ranged from 0·88 to 1·00, indicating excellent interobserver reliability( Reference Patel, Chandran and Hampton 31 ).
To characterize water access, for each water source, research staff recorded the source type (e.g. refrigerated filtered fountain, dispenser), location (e.g. gym, food-service area, classroom) and usability (considered unusable if water could not be taken from the source for any reason including very low water pressure, the water source being empty or broken).
Research staff also characterized bottled water and sports drink access, including locations where the drinks were sold, along with the type of vendor (e.g. cafeteria, vending machine) and the item’s price.
To validate administrators’ responses to questions regarding drinking-water policies and practices, research staff completed surveys with departmental directors at participants’ school districts. Depending on each district’s delineation of responsibilities, the contacted departments included facilities, maintenance and operations, business, and in small districts, the office of the superintendent or assistant superintendent. In addition, investigators coded each school’s district wellness policy (a document describing each school district’s nutrition and physical activity-related policies) for water-related language.
Data analysis
Research staff double-entered all data into the REDCap secure data entry system( Reference Harris, Taylor and Thielke 32 ). Data were analysed with the statistical software package Stata version 13. Validity of the survey instrument was derived by comparison with gold-standard observational data and wellness policy review/district staff informational interviews. Kappa statistics, which reflect the magnitude of agreement beyond chance between surveys and observations, were calculated for all categorical variables. Values of κ between 0·41 and 0·60 represented moderate agreement, κ between 0·61 and 0·80 represented substantial agreement, and κ between 0·81 and 1·00 represented almost perfect agreement( Reference Landis and Koch 33 ). Pearson correlation coefficients (r) and t tests were calculated for continuous variables. Values of r above 0·6 represented significant agreement( Reference Swinscow 34 ). For t tests, P<0·05 was considered significant.
Results
Fifty-five per cent of schools contacted (n 24) participated in the study. All respondents were on-site administrators who were familiar with school drinking-water access, including principals (67 %), assistant principals (13 %), facilities department directors (8 %) and other administrators with titles of co-administrator, office manager and site director (13 %).
Sociodemographic characteristics of study schools, reported elsewhere, were representative of Bay Area schools in aggregate( Reference Patel, Chandran and Hampton 31 ). Of non-participants (n 20), 65 % (n 13) declined due to lack of time, 25 % (n 5) stated no reason for declining and 10 % (n 2) declined due to lack of interest. Participating schools did not differ significantly from schools that declined in terms of school type, urban-centric locale, mean student enrolment, percentage of students who qualified for free or reduced-price meals, student race/ethnicity or percentage of English learners( Reference Patel, Chandran and Hampton 31 ).
For questions related to the availability, type and location of free water sources, bottled water and sports drinks, 19 % of κ values (n 18) indicated substantial agreement and 61 % (n 57) indicated almost perfect agreement (Table 1). For nine questions, there was perfect agreement and no variation in subjects’ responses, resulting in κ values being incalculable. A composite of questions related to any free water access in food-service areas (n 8) yielded a κ value that indicated moderate agreement (κ=0·60, 83·33 % raw agreement).
Table 1 Agreement between school administrator telephone survey and observational audits of water and competitive beverage access in public schools (n 24), California Bay Area, USA, January–May 2011
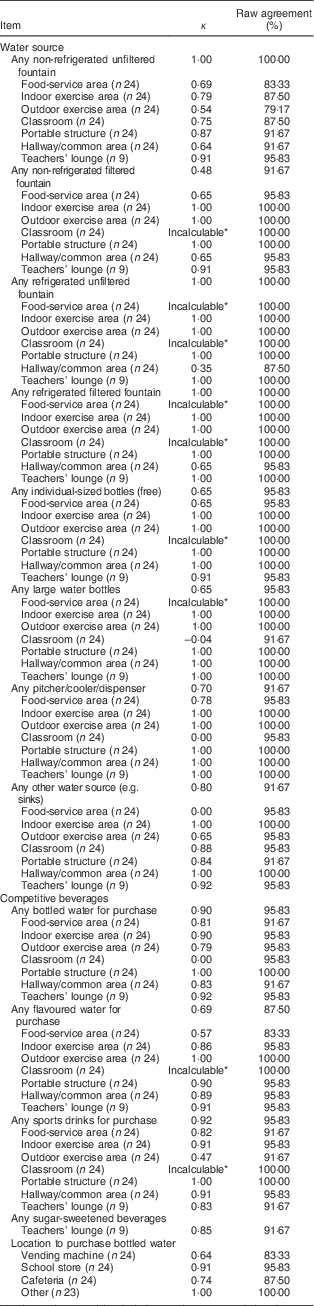
* κ incalculable due to perfect agreement and no variation in responses.
Despite significant correlation between the total number of fountains observed and the total number reported by school administrators (r=0·78), the mean number of fountains observed per school was higher than the mean number reported by school administrators (22·7 v. 16·5; P=0·008). Similarly, the correlation between the observed and reported number of usable fountains was significant (r=0·77), but the mean number of usable fountains observed was higher than the mean number of usable fountains reported (22·0 v. 16·1; P=0·01). Although the mean observed price of bottled water was not significantly lower than the mean reported price of bottled water ($US 0·84 v. $US 0·87; P=0·68), the correlation between these variables was poor (r=0·28).
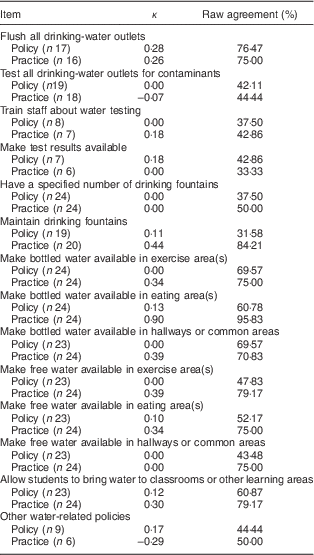
For questions related to water-related policies and practices, only one out of twenty-eight questions yielded a κ value that indicated substantial or almost perfect agreement (Table 2).
Table 2 Agreement between school administrator telephone survey and reviews of policies and practices related to water in public schools (n 24), California Bay Area, USA, January–May 2011
Discussion
Our administrator survey of school water access and water-related policies and practices yielded reasonably valid responses for questions related to free and bottled waters and sports drinks. Questions focused on water-related practices and policies, the number of total and usable drinking fountains, and the price of bottled water bore few valid responses.
To our knowledge, there is only one other published validated administrator survey that captures availability of water and competitive beverages in schools( Reference Nathan, Wolfenden and Morgan 35 ). That telephone survey of primary-school administrators in Australia, reported by Nathan et al., was also validated using observational site visits. Their survey, however, measures water and other competitive beverages sold in food-service areas and during school fundraisers only, omitting beverages sold elsewhere on the school campus and free drinking-water sources, the main focus of our study. While there are several surveys currently used by researchers to capture school water access, none are validated( Reference Hood, Turner and Colabianchi 19 – Reference Kenney, Gortmaker and Cohen 23 ), and this may lead to over-reporting of school water access( Reference Kenney, Gortmaker and Cohen 23 ).
As there is a growing interest in improving access to free drinking-water globally, our survey could have broad application. Jurisdictions in the USA and internationally have passed soda taxes and are considering using the tax revenue to improve free drinking-water access in schools and other community settings( 36 ). For example, the Mexican Government has pledged to use soda tax revenue to install new water fountains in schools located in low-income areas( 36 ). Our tool could be used by evaluators to assess the state of water access in schools prior to and following such improvements.
The low κ scores observed for a small number of survey items related to water access in schools are likely due to low variability in responses. For example, we observed that pitchers/dispensers were not available in any classrooms, and at all but one school, administrators also denied offering pitchers/dispensers in classrooms. This lack of variation in responses led to a κ value of 0·00 despite a 96 % raw agreement.
In a few other instances, low κ values may have been due to incorrect administrator response as a result of unfamiliarity with types of water infrastructure. For example, because filters are not usually visible on inspection, a high proportion of school administrators reported that their school had filtered drinking fountains, even though this was not the case upon observation. Similarly, multiple participants reported providing free bottled water for staff in the teachers’ lounge, but were actually likely referring to the personal bottled water that staff brought to school with their lunch and stored in the lounge.
Poor agreement for continuous variables may be due to school administrators’ lack of familiarity with all sources of water, paid and free, on the school campus. To ascertain the number of total water fountains, and the total number of functioning water fountains on the school campus, it may be necessary to survey school facilities staff who deal directly with school water sources on a daily basis, or for school districts or the Department of Education to conduct in-person audits. This information is critical to determine whether schools are operating in compliance with state plumbing codes, which require that schools offer a certain quantity of water sources per number of students( Reference Onufrak, Park and Wilking 21 ).
Low κ values for questions related to water-related policies and practices may be due to question syntax, diction and content, which could have prompted respondents to feel that it is recommended or required to have the policies mentioned in the survey, such as a policy to test all drinking-water outlets for contaminants (which is legally required only at the very small proportion of California schools that maintain their own on-site water system). Additionally, given the plethora of new polices school administrators are responsible for implementing each year, administrators may have been unaware of current federal, state and local beverage policies and practices. It may be valuable to review and revise the dissemination approaches currently used to communicate with school administrators regarding new and existing school beverage policies.
A few alterations to the survey instrument could improve validity. Providing a clear definition of terms such as ‘refrigerated’ and ‘filtered’ and providing an electronic link to pictures of different types of water sources that respondents could reference during survey administration could be helpful. Alternatively, rather than asking very specific questions about the types of drinking fountains available on school campuses (i.e. refrigerated, non-refrigerated, filtered, unfiltered), the survey could ask more generally about access to any traditional drinking fountains in specific school locations. This strategy may improve the survey’s ability to capture accurate information about schools’ compliance with laws that require free water access in food-service areas. Triangulating information about policies from written school or district wellness policies could also improve the validity of questions regarding water policies. Such methods may also be valuable for the many large-scale surveys that rely on administrator report of policies for national surveillance( Reference Laurie, Standing and Chu 20 , 37 ).
The present study has several limitations. Due in part to a small sample size, there was a lack of variation in the responses to several questions, which contributed to the low κ scores for several items despite high raw agreement. Additionally, based on our research hypotheses, the context of competitive beverage access in California public schools and to minimize respondent burden, questions about competitive beverages were limited to bottled water and sports drinks. Future research should also validate survey questions related to the availability of a wider range of beverages that may be found in some schools.
Despite such limitations, the school administrator telephone survey provides a reasonably valid measure of free water, bottled water and sports drink access on school campuses. With modifications to improve the validity of policy and practice questions, the survey could serve as a valuable tool to monitor the impact of school-based nutrition interventions and to examine school and district adherence to state and federal nutrition policies.
Acknowledgements
Financial support: This research was supported by the Robert Wood Johnson Foundation through its Healthy Eating Research Program (grant number 68241). A.I.P. was supported in part by the National Institutes of Health (grant number 1 K23 HD067305-01A1). Robert Wood Johnson Foundation and the National Institutes of Health had no role in the design, analysis or writing of this article. Conflict of interest: The authors have no financial relationships or conflict of interest to disclose. Authorship: A.A.H. analysed data and drafted the manuscript. J.M.G. collected and analysed data and edited the manuscript. K.E.H., K.H., E.B.-G. and C.D.B helped conceptualize the research study and edited the manuscript. C.E.M. analysed data and edited the manuscript. A.I.P oversaw research design, data collection and data analysis and edited the manuscript. Ethics of human subject participation: This study was conducted according to the guidelines laid down in the Declaration of Helsinki and all procedures involving human subjects/patients were approved by the University of California, San Francisco Committee on Human Research. Verbal informed consent was obtained from all subjects/patients. Verbal consent was witnessed and formally recorded.
Supplementary material
To view supplementary material for this article, please visit https://doi.org/10.1017/S1368980017002312


