


Plant-based diets can provide several health benefits such as lower serum cholesterol, blood pressure and weight. However, these diets may also increase the risks of micronutrient deficiencies(Reference Craig1–Reference Crowe, Appleby and Travis3).Vitamin B12 (B12) is naturally present only in animal-source foods, and people who follow a plant-based diet and do not consume sufficient quantities of foods fortified with B12 or take supplements will be at risk of B12 deficiency(Reference Allen, Miller and De Groot4). Fruits, vegetables, berries and grains are foods rich in folate(5). B12 and folate are linked via the methyl group transfer from N5-methyltetrahydrofolate to B12, and deficiencies can lead to megaloblastic anaemia and hyperhomocysteinemia, a risk factor for atherosclerosis(Reference Klee6). Since B12 is essential for DNA and RNA synthesis, erythropoiesis and the production of neurotransmitters(Reference Stabler7), low B12 status can cause neurological damage due to an inhibition of the formation of the myelin sheath among other potential causes(Reference Allen, Miller and De Groot4). Folate is essential for physiological processes, such as synthesis of nucleic acids and low folate status may cause cognitive and neurological symptoms. B12 status can be assessed using several biomarkers, such as B12 concentrations, total homocysteine (tHcy) and methylmalonic acid (MMA). tHcy and MMA are both functional biomarkers that accumulate when B12 status is poor. However, tHcy also increases with low folate status(Reference Bailey, Carmel and Green8). Folate status can be assessed by evaluating serum folate and tHcy.
Causes of B12 deficiency can be divided into four main types: inadequate intake from food, malabsorption, chemical inactivation by nitrous oxide or genetic disorders(Reference Green, Allen and Bjørke-Monsen9). In high-income populations, B12 deficiency is more often diagnosed as a cause of low absorption due to pernicious anaemia, an autoimmune condition where intrinsic factor production is inadequate(Reference Green, Allen and Bjørke-Monsen9). Loss of intrinsic factor also occurs with ageing. Deficiency is also more common in people who consume limited amounts of animal-source foods, such as vegans, vegetarians and the elderly(Reference Allen, Miller and De Groot4). In low- and middle-income countries, B12 deficiency can be relatively common due to lack of income to purchase animal-source foods or because of religious or cultural dietary preferences(Reference Green, Allen and Bjørke-Monsen9). Previous research in populations consuming a mixed diet reported that serum B12 concentrations are on average lower in older individuals(Reference Baik and Russell10), but few studies have included older vegans and vegetarians.
According to national dietary surveys, healthy adults in Sweden and Norway have inadequate folate intakes. Three out of four women and one out of two men have been found to have intakes below the recommended intake in Norway(Reference Öhrvik, Lemming and Nälsén11–Reference Totland, Melnæs and Lundberg-Hallen15). Vegans and vegetarians have higher intakes of fruits and vegetables than the general population, likely resulting in a higher folate status in these groups. Worldwide, fortification of flour with folic acid is common, in USA folic acid fortification of all cereal grain product flour was implemented in 1998; however in Norway, flour with folic acid fortification is not available.
Interest in plant-based diets has increased over the past few years(Reference Radnitz, Beezhold and DiMatteo16), and vegans now represent at least 1 % and vegetarians about 3 % of the Norwegian population(Reference Berg17). In addition, a flexitarian diet, reducing the intake of meat, milk, eggs and fish in favour of plant-based alternatives, is becoming increasingly popular(Reference Derbyshire18). Given the very limited information available, this study evaluated B12 and folate status of vegan and vegetarian adults in Norway, using dietary B12 intake and supplement use of vitamin B12 and folic acid, and serum B12 concentrations to detect subclinical or clinical deficiency in conjunction with the functional markers tHcy, MMA and serum folate. The measured biomarkers were further used to calculate the recently proposed B12 status indicator, cB12 (Reference Fedosov, Brito and Miller19).
Methods
Participants
In this study, 205 participants, 115 vegans and 90 vegetarians, from the Oslo area, were included (57 men and 148 women, age range18–60 years). The inclusion criteria were as follows: (1) no consumption of poultry, meat and/or meat products the previous 6 months or more; (2) older than 18 years of age; (3) not pregnant or lactating; (4) no chronic or acute illness know to affect B12 status or acute illness.
Vegans were defined as people who omitted all types of animal-source foods from their diet, and vegetarians as those who excluded poultry, meat, and meat products, but included milk and dairy products and/or eggs and/or fish in varying degrees. Due to few pescatarians (n 35), and no difference in B12 status between vegetarians and pescatarians, the two groups were merged.
Participants were mainly recruited through social media, using convenience sampling method. The snowball effect was further used to recruit participants through existing participants. Information sheets about the study purpose and participation were shared on OsloMet’s website, a website for health personnel interested in plant-based diets (HEPLA) and in closed Facebook groups for vegans and vegetarians.
Dietary questionnaire – habitual intake
Participants answered an electronic questionnaire, which consisted of two parts. The first part covered background information (age, height and weight, marital status, occupational status, educational level, smoking habits, country of birth, language, dietary practice, and duration of adherence to vegan/vegetarian diet), while the second part included a FFQ, assessing habitual food and supplement intake using thirty-two questions about average intake of selected foods/food groups and supplements over the past 4 weeks. These questions had seven frequency alternatives ranging from ‘rarely/never’, ‘less frequently than weekly’, ‘1–3 times per week’, ‘4–6 times per week’, ‘1–2 times per day’, ‘3–4 times a day’ to ‘5 or more times a day’. The answers were converted into daily amounts and adjusted for portion size to obtain B12 intake. Type, amount, brand and frequency of supplements used were also assessed for both B12 and folic acid. The use of B12 injections was assessed based on whether they ever had taken B12 injections and time since last injection (months).
The questionnaire was designed based on a previously validated questionnaire in a study of lactating women and iodine status(Reference Henjum, Lilleengen and Aakre20). Changes were made to adapt to vegans and vegetarian diets and relevant lifestyle factors, including several plant-based alternatives such as legumes, plant-based milk and other non-dairy products (oats, rice, soya, almond and coconut), or vegan cheese and meat substitutes (soya products, tofu and tempeh). Energy drink intake was also evaluated, due to high B12 doses in some of the brands. Dietary folate intake was not calculated due to insufficient details on folate sources (e.g. vegetable was one food group and did not specify which type of vegetable).
Twenty-four-hour dietary recall
The 24-h recall was completed for B12 intakes on the same day as the non-fasting blood sample was collected. Types and quantities (grams and decilitres) of food and drinks, and brand or manufacturer were assessed. To calculate the 24-h intake, reported food items were multiplied by B12 concentrations in each specific food item available in the Norwegian Food Composition Table in 2019(5). For combined food items, the mean values for each food item were used (e.g. all lean fish types, all fatty fish species, all types of cake/chocolate/ice cream and all types of vegetables). Plant-based alternatives, plant-based milk alternatives, supplements and different kinds of energy drinks are not captured in the 2019 Food Composition Table, so package labels were used to assess B12 concentrations.
Sample collection and biochemical analyses
A non-fasting blood sample was collected from all participants. Blood for serum analyses (B12, folate and MMA) was collected in a 5·0 ml tube (BD vacutainer SST II advance, Becton Dickinson), and blood for the plasma analysis (tHcy) was collected using a 5·0 ml tube (BD vacutainer PPT K2E 9·0 mg, Becton Dickinson).
The serum tubes were mixed gently by five inversions and placed in a rack at room temperature for 30 to 120 min before centrifugation at 1500 rpm for 10 min (Centrifuge 5804, Eppendorf). All samples were protected from light. The plasma tubes were mixed gently and placed in a rack at room temperature to prevent blood cells attaching to the stopper. The plasma was obtained by the same centrifugation step as above and separation within 30 min of the blood draw. All serum and plasma samples were refrigerated (4°C) until analysis within 3 d at the Fürst Medical Laboratory. The assays were performed using the ADVIA Centaur XP (JEOL Ltd) and XPT System (Siemens Healthiness) by immunoassays coupled with chemiluminescence detection according to the manufacturer’s protocol.
Deficiency cut-offs and cB12 status indicator
B12 status was evaluated using the following cut points for serum B12 concentrations: severely deficient (≤ 148 pmol/l), marginally deficient (149 to 221 pmol/l), deficient (< 221 pmol/l) and adequate (> 221 pmol/l)(Reference Allen21). Folate deficiency was defined as serum concentrations < 10 nmol/l, adequacy at 10–45 nmol/l and elevated at 45 nmol/l. Elevated tHcy was defined as > 15 µmol/l(22) and elevated MMA as ≥ 0·27 µmol/l(Reference Green, Allen and Bjørke-Monsen9). The recommended daily intake (RDI) of B12 vary across countries. The Nordic Nutrition Recommendations of B12 is 2·0 µg/d,(23) and the RDA for the USA is 2·4 µg/d.
The cB12 indicator was calculated for participants for which B12, tHcy and MMA concentrations were available(Reference Fedosov, Brito and Miller19). This approach calculates cB12 as a combined indicator of B12 status, which can be estimated using two, three or four B12 biomarkers (B12, tHcy, MMA and holotranscobalamin). cB12 values are classified as follows: probable B12 deficieny (cB12 < –2·5), possible B12 deficiency (–2·5 to –1·5), low B12 (–1·5 to –0·5), B12 adequacy (–0·5 to 1·5) and elevated B12 status (cB12 > 1·5)(Reference Fedosov, Brito and Miller19).
Ethical approval
This study was conducted according to the guidelines laid down in the Declaration of Helsinki, and all procedures involving human subjects were approved by the Regional Committee for Medical and Health Research Ethics, 2019/653/REC South-East, and the Norwegian Center for Research Data/NSD/101332. Written informed consent was obtained from all participants.
Statistical analysis
IBM SPSS version 25 (IBM Corp.) was used for the statistical analysis. Normality of the data was tested using visual interpretation of the Q-Q plots and histograms. Spearman’s correlation (rs) was used to evaluate the association between continuous non-parametric variables. Correlations below 0·3 were considered to be weak, between 0·3 to 0·5 as moderate and above 0·5 as strong(Reference Cohen24). The Mann–Whitney U test was used to test differences between groups using non-parametric variables, and the χ 2 test was used for categorical variables. Cross-tabulations were performed with B12, tHcy and MMA as categorical variables to identify potential deficiency. Serum B12 was skewed, so all analyses were done using log-transformed data. Multiple linear regression analyses were used to explore predictors of serum B12 as the outcome variable. The exposure variables were age, sex, BMI, smoking status, parity, vegan/vegetarian diet, duration of vegan/vegetarian diet, B12 intake, B12 supplements, B12 injections and education. All covariates that showed associations (P < 0·10) in the crude regression analysis (age, B12 supplements 24 h and total habitual intake of B12) were included in the preliminary multiple regression models. Excluded variables were reintroduced, and those that were still associated in this model (age and B12 supplements 24 h) (P < 0·10) were retained in the final model(Reference Hosmer and Lemeshow25). The regression models were checked for homoscedasticity using standard residuals within ± 3 and Cook’s distance < 1 as parameters.
Results
Characteristics of the participants
Fifty-six per cent of the participants were vegans and 44 % were vegetarians (Table 1). Overall, 86 % reported adherence to a vegan or vegetarian diet for more than 2 years, while 14 % stated an adherence for more than 10 years. The use of B12 supplements was about 1·5-fold higher in vegans than in vegetarians (P < 0·03 for all), while no significant difference was observed in the use of B12 injections during the last 10 months (P = 0·11).
Table 1. Background characteristics of participating vegans and vegetarians in Norway (n 205)*

* Results are presented in mean ± sd or n (%).
† Significant differences as determined by Mann–Whitney U test.
B12 intake and status
Median total habitual B12 intake (food plus supplements) was higher in vegans compared with vegetarians (P < 0·001), while habitual B12 intake from foods only was higher in vegetarians (P = 0·001, Table 2), so no differences were found in 24-h dietary intake of B12. More vegetarians than vegans (40·0 v. 18·3 %, P < 0·001) had a total habitual B12 intake below the RDI of 2 µg/d. No differences in dietary practice affecting in B12 intake were found for the 24-h dietary recall. There were no significant differences in B12, tHcy or MMA concentrations (medians: B12, 357 pmol/l; tHcy, 9·0 µmol/l; MMA, 0·18 µmol/l) between vegans and vegetarians (Table 3).
Table 2. Calculated 24-h intake of B12, and habitual intake and injection of B12 in vegans (n 115) and vegetarians (n 90)* in Norway

B12, vitamin B12; RDI, recommended daily intake.
* Results presented as median (IQR). Total B12 intake includes food, energy drinks and supplement use. RDI for B12 = 2·0 µg/d(38).
† P-values determined by Mann–Whitney U test and χ 2 test for categorical variables.
Table 3. Concentrations and deficiency rates of measured blood biomarkers in Norwegian vegans (n 115) and vegetarians (n 90)*

Ref., reference; B12, vitamin B12; tHcy, homocysteine; MMA, methylmalonic acid; cB12, combined B12 indicator.
* Values are presented as median (IQR) or % (n).
† Mann–Whitney U test and χ 2 test for categorical variables.
‡ Reference values(Reference Fedosov, Brito and Miller19,Reference Allen21) .
§ B12, (vegans, n 113; vegetarians, n 90).
|| Hcy (vegans, n 113; vegetarians, n 88).
¶ MMA (vegans, n 109; vegetarians, n 86).
** Folate (vegans, n 98, vegetarians, n 82).
†† cB12 (vegans, n 105; vegetarians, n 84). Only participants with B12, tHcy and MMA data are included. cB12 is dimensionless. None of the cB12 values indicated a low status (cB12 < −0·5).
The prevalence of B12 deficiency (< 221 pmol/l) was 14·3 % (no differences between vegans and vegetarians, P = 0·424) based on serum B12 concentrations (60 % of these did not have elevated tHcy or MMA). One vegan and one vegetarian had severe B12 deficiency (B12 ≤ 148 pmol/l). Vegetarian B12 supplement users had a higher mean serum B12 concentration compared with vegetarian non-users (P = 0·002), which was not the case for vegans (online Supplemental Table 1), while supplement use only increased intake in the last 24 h (P < 0·001 for all), not habitual B12 intake in either group. The overall cB12 median value (1·3) was in the adequate B12 status range (–0·5 to 1·5), and the cB12 values did not differ between vegans and vegetarians (P = 0·66). While none of the calculated cB12 values fell into the low B12 status category for cB12 (Table 3), 3·7 % of all participants revealed a cB12 value indicating elevated B12 (vegans: 2·1 % and vegetarians: 1·6 %).
Folate supplement use and status
Following the trend of higher supplement use among the vegans (Table 2), vegans had higher serum folate status than vegetarians (25·8 v. 21·6 nmol/l, P = 0·027, Table 3), and only one vegan and two vegetarians revealed folate levels below the deficiency cut-off of 10 nmol/l (Table 3). Folic acid supplement use increased serum folate in vegans and vegetarians compared with the non-supplement users in each group (P ≤ 0·031 for all, Supplemental Table 1).
Associations among biomarkers
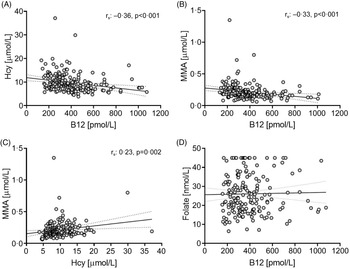
Since no significant differences were observed for B12, tHcy and MMA concentrations based on dietary practice, the pooled sample set (vegans and vegetarians) was used to examine their relationships. B12 concentrations were moderately negatively associated with tHcy and MMA (tHcy, rs: −0·36; MMA, rs: −0·33, P < 0·001 for all), while tHcy and MMA were weakly correlated (rs: 0·23, P = 0·002; Fig. 1). None of these biomarkers were correlated with folate serum concentrations, regardless of using the pooled or diet-based sample sets. Association between B12 biomarkers and folate serum concentration have, however, been found in omnivore populations(Reference Bjørke Monsen and Ueland26,Reference Biselli, Guerzoni and de Godoy27) .

Figure 1. Scatterplots of B12 and related biomarkers in vegans and vegetarians in Norway (n = 205).
Supplemental Table 2 shows the percentage of participants with B12, tHcy and MMA concentrations (n 189) below the respective cut-offs. In total, 75·9 % (n 123) of participants with adequate B12 status were within the normal range for tHcy and MMA concentrations. The trend was the same for B12 deficient and adequate groups: more participants had elevated MMA with normal tHcy (deficient, 29·6 %; adequate, 16·7 %) than normal MMA with elevated tHcy (deficient, 3·7 %; adequate, 6·8 %). Only two participants had low serum B12 in conjunction with elevated tHcy and MMA, which was also found in one participant with adequate B12 concentrations.
Predictors of serum B12 concentration
In multiple linear regression analysis, increasing age (0·19 (0·001, 0·059), P = 0·002) and intake of B12 supplement the last 24 h (yes/no) (0·21 (0·013, 0·063), P = 0·001) were predictors of serum B12 concentration in vegans and vegetarians (Table 4).
Table 4. Predictors of B12 concentrations in vegans and vegetarians (n 205) in Norway

* The exposure variables were age, sex, BMI, smoking status, parity, dietary practice, duration of dietary practice, B12 intake, B12 supplements, B12 injections and education.
† Adjusted for age, B12 supplements 24 h and total habitual intake of B12.
‡ Supplement use based on 24-h recall (yes/no).
Discussion
To the best of our knowledge, this is the first study to assess B12 and folate status in vegetarians and vegans in Norway, employing multiple approaches for B12 assessment. Despite the fewer dietary B12 sources in strict plant-based diets, the combined indicator cB12 suggested that none of the participants was B12-depleted and 4 % had elevated B12. However, 14 % were B12-deficient based on serum B12 concentration (< 221 pmol/l) including two individuals in the severely deficient range (≤ 148 pmol/l). These two individuals reported use of B12 supplements, which suggest other causes of B12 deficiency than inadequate dietary B12 intake. Similar deficiency rates were found in the National Health and Nutrition Survey (NHANES) for the US adult population (19–59 years, 9·9–10·0 % v. 8·7–10·0 % in our study, using their serum B12 cut-off of < 200 pmol/l)(Reference Bailey, Carmel and Green8); however, the reported elevated MMA and tHcy prevalence between 3·9–5·2 % and 2·6–6·6 %, respectively, was about 3- to 4-fold lower compared with our study. Interestingly, our findings for B12, tHcy and MMA concentrations were comparable to those of the US elderly population in the same report (≥ 60 years). With age, protein-bound B12 in the diet is less efficiently absorbed due to a higher occurrence of atrophic gastritis and intestinal bacterial overgrowth(Reference Baik and Russell10). In our study, the mean age was 30 years old (with good ability to absorb B12), and only three participants were above 60 years old, which may explain the findings of low B12 deficiency. While we did not find differences in dietary practice and B12 status, other studies have reported lower serum B12 concentrations in vegans compared with vegetarians(Reference Haddad, Jaceldo-Siegl and Oda28–Reference Herrmann, Schorr and Obeid31). However, we found significantly higher total habitual B12 intake in vegans (supplement and food), most likely driven by their high doses of B12 supplements, which could explain the discrepancy in our findings.
Folate concentrations in nearly all participants were adequate. Good dietary folate sources are fruit and vegetables, and according to Norwegian national dietary surveys, Norwegians have a fruit and vegetable intake below the RDI of 500 g/d(Reference Totland, Melnæs and Lundberg-Hallen15,23) . Correspondingly, the general population in Norway have a lower folate intake than recommended (300 μg/d for adults and 400 μg/d for women of fertile age)(Reference Totland, Melnæs and Lundberg-Hallen15,23) . Since plant-based diets have higher intakes of fruits and vegetables, individuals following these dietary practices might have higher folate status than the general population, a hypothesis supported by our findings of median folate concentrations of over 20 nmol/l compared with the lower values (∼7 to 16 nmol/l) reported in other studies of Norwegian adults (6·7–15·2 nmol/l)(Reference Dhonukshe-Rutten, De Vries and De Bree32).
In our study, almost 14 % of the participants were classified as B12-deficient based on serum B12 concentration. The sensitivity of detecting B12 deficiency in its early stages with this biomarker is questionable(Reference Fedosov, Brito and Miller19). In fact, cross-tabulation evaluating tHcy and MMA in the B12-deficient participants showed that almost 60 % of the B12-deficient participants did not have elevated tHcy or MMA. A similar finding was reported in healthy, highly educated vegetarian Indians(Reference Naik, Mahalle and Bhide33). Furthermore, cB12 calculations indicated that none of the participants were low in B12. Our study suggests that the deficiency rates of B12 are dependent on the method of assessment of B12 status, and whether the individuals with low B12 concentrations are in fact at risk of deficiency, given that their cB12 value indicates adequacy, is doubtful. However, 4 % fell into the elevated cB12 range, and 9 % (19) of the participants had a high B12 concentration (> 650 pmol/l). A single biomarker like serum B12 concentration is not a definitive indicator of B12 status or deficiency, if low, it suggests other markers should be used as well. MMA is the most sensitive followed by holoTC, then B12 and then homocysteine. cB12 includes several of these and is therefore specific and sensitive to detect true deficiency. High doses of B12 might be useful to increase serum B12 in some situations but given the poor efficiency of absorption of high doses (< 1 %), then either taking a supplement that supplies the usual daily requirement (50 % absorption) or giving a least one dose of i.m. B12 might be a better strategy. Surprisingly, supplement use was not the driving factor for such high B12 concentrations.
Our findings of inadequate dietary intake of B12 in vegans and vegetarians are in agreement with previous reports(Reference Elorinne, Alfthan and Erlund30,Reference Kristensen, Madsen and Hansen34,Reference Larsson and Johansson35) . Lower habitual dietary B12 intake in vegans v. vegetarians was also reported in studies from Switzerland and the UK(Reference Schüpbach, Wegmüller and Berguerand29,Reference Gilsing, Crowe and Lloyd-Wright36) . Contrarily, adequate B12 intake from food in vegans and vegetarians was found in the USA, with nutritional yeast and fortified products as crucial B12 sources(Reference Haddad, Jaceldo-Siegl and Oda28). However, the study also refers to several vegans with insufficient intake. In our study, the main B12 sources for vegetarians were fish (consumed by 13 % of the pescatarians) and nutritional yeast (11 % of the total B12 intake), emphasising the low consumption of B12 from other foods. In Norway, plant-based alternatives for milk, yogurt and cheese are fortified with B12; however, no food items are fortified with folic acid.
The use of B12 supplements was higher in vegans than vegetarians (71 % v. 41 %), which was also reflected in the higher habitual total B12 intake in the vegan group. Regardless of the diet, the B12 intake was adequate (above RDI) when supplements were taken. While more vegans reported supplement use, the median total B12 intake of supplement users did not differ between groups (11·4 v. 20·4 µg/d, vegans v. vegetarians), reflecting 5- to 10-fold higher intakes than the RDI of 2 µg/d. There is no recommended upper limit for daily B12 intake, but there is a proposed maximum intake of 2000 μg as a safety margin(37). Six participants in our study took supplements of B12 ≥ 2000 μg, but whether these concentrations adversely affected the participants remains unknown(38). As found in our study, vegans in the USA had highest median intake of B12 when supplements were included (9·4 v. 6·6 μg/d)(Reference Haddad, Jaceldo-Siegl and Oda28). Nevertheless, 15 % of vegans and 11 % of vegetarians still had a total B12 intake below the RDI, a lower percentage with inadequate intake compared with our study (18 % in vegans and 40 % in vegetarians). In Denmark, the median B12 intake of vegans increased from 0 to 17·5 μg/d when B12 supplements were included in the diet(Reference Kristensen, Madsen and Hansen34), and a trend also found for the vegans and vegetarians in our study when the 24 h intakes were considered. During the last years, more education about the importance of B12 supplements had been made available, especially for vegans, which could explain that most participants reported supplement use.
Only five (5·6 %) vegetarians and fourteen vegans (12·2 %) reported the use of B12 injections, which had no effect on the measured serum B12 concentrations. Since only four participants reported a B12 injection within the last 1 to 5 months, and all remaining injection users received their last injection 12 months prior, the treatment is not likely to significantly alter the results in this study. Moreover, it has been estimated that only about 15 % of a 1000 µg intramuscular B12 dose is retained in the body(Reference Green, Allen and Bjørke-Monsen9), further indicating that the B12 injections as reported in this study are no major contributor to B12 concentrations. In fact, use of daily high-dose B12 supplements (1000–2000 µg) have been reported to be equal or even superior to injections, supporting our findings of the positive effect of supplements on B12 concentrations.
We found B12 supplement use to be the strongest predictor of serum B12 concentrations, and the most important B12 source consumed among both vegans and vegetarians in our study. Further, higher B12 concentrations were associated with increasing age, which in turn supported a better B12 status. The low B12 concentrations in a surprisingly high percentage of younger vegan and vegetarian adults may indicate lower compliance with B12 supplementation and a higher risk of B12 deficiency in this age group. To secure optimal growth and development of the foetus, adequate B12 status during pregnancy and lactation is crucial. Of notice, in the Nordic Nutrition Recommendations 2012, the RDI during lactation is raised from 2·0 µg /d to 2·6 µg /d, underlining there is an urgent need to conduct more trials to investigate whether intervention with prenatal and postnatal vitamin B12 supplementation would improve child health outcomes in populations at risk.
Strengths and limitations
The B12 dietary intake could be underestimated as the Norwegian Food Composition Table is not fully updated regarding B12 content in plant-based food alternatives, such as cheese/milk and yogurt substitutes, or other available B12-enriched products. Nonetheless, we registered B12 intake manually. A limitation in our study was that dietary folate intake was not calculated. The low number of participants in the group of non-supplement users, among vegans, was also a limitation. A higher sample size could have produced more valuable findings in this regard. The higher rate of educational level of our study participants compared with the general Norwegian population (77 % v. 34 %)(Reference Herrmann, Schorr and Obeid31) may have caused our results to be unrepresentative of the Norwegian population, as higher education has been associated with better health and healthier eating habits(Reference Dhonukshe-Rutten, De Vries and De Bree32). Moreover, since convenience sampling was used to recruit participants, more vegans and vegetarians may have been included who are extremely concerned about their diet and health.
However, this study analysed multiple biomarkers for B12 to evaluate subclinical or clinical B12 deficiency, namely tHcy, MMA, and erythrocyte folate, and we also calculated and evaluated the combined B12 status indicator, cB12. The availability of dietary data from 24-h recall and FFQ allows us to map B12 dietary sources and supplements. In addition, we had low percentage of missing data due to the use of electronic questionnaires with mandatory answer options.
Conclusions
This is the first study in vegans and vegetarians in Norway to assess B12 and folate status, using multiple approaches for its assessment. Despite fewer dietary B12 sources in strict plant-based diets, most participants revealed adequate B12 status due to B12 supplementation. Both vegans and vegetarians had adequate folate status, indicating adequate folate intake.
Acknowledgements
The authors thank all the participants in the study.
The study was supported by OsloMet.
S.H. designed the research; S.G.-J., A.M.I. and E.R. conducted the research; S.S-F. and D.H analysed the data; S.G.-J. and S.H performed the statistical analysis; S.H., L.H.A. and D.H wrote the paper; and S.H had the primary responsibility for the final content. All authors have read and agreed to the published version of the manuscript.
All authors declare no conflict of interest.
Supplementary material
For supplementary material/s referred to in this article, please visit https://doi.org/10.1017/S0007114522002987


 Open access