


INTRODUCTION
Synthesizing chronometric data on a regional scale for comparative and global studies is methodologically challenging. The adoption of an aggregation framework in chronological modeling has improved the knowledge of the Andean past (Contreras Reference Contreras2022), notably in regard to the relationship between humans and paleoecology (Williams et al. Reference Williams, Santoro, Smith and Latorre2008; Marquet et al. Reference Marquet, Santoro, Latorre, Standen, Abades, Rivadeneira, Arriaza and Hochberg2012; Maldonado and Santoro Reference Maldonado and Santoro2016) and to chronologies referring to specific periods (Korpisaari et al. Reference Korpisaari, Oinonen and Chacama2014; Barberena et al. Reference Barberena, Méndez and de Porras2017; Pestle et al. Reference Pestle, Torres-Rouff, Pimentel and Hubbe2021) or large-scale processes (Gayó et al. Reference Gayó, Latorre and Santoro2015; Goldberg et al. Reference Goldberg, Mychajliw and Hadly2016). These methods of chronological modeling have made it possible to analyze the changing population dynamics of local chronologies, previously described statically and homogeneously.
In archaeology, radiocarbon (14C) dates have been used as an indirect proxy for assessing demographic patterns over time (Rick Reference Rick1987; Williams 2012; Shennan et al. Reference Shennan, Downey, Timpson, Edinborough, Colledge, Kerig, Manning and Thomas2013; Crema Reference Crema2022). This methodology is not without relevant criticism (Contreras and Meadows Reference Contreras and Meadows2014; Attenbrow and Hiscock Reference Attenbrown and Hiscock2015; Freeman et al. Reference Freeman, Byers, Robinson and Kelly2018; Carleton Reference Carleton2021; Carleton and Groucutt Reference Carleton and Groucutt2021; Timpson et al. Reference Timpson, Barberena, Thomas, Méndez and Manning2021), resulting in skepticism about its reliability. Criticism is based on methodological issues regarding the representativeness of data sampling, the potential “noise” or spurious tendencies generated by calibration curves, and the reliability of paleodemographic interpretations. Introduced in 2017 by Bronk Ramsey, kernel density estimation (KDE) of 14C data is a mathematical, non-parametric method of data integration that, in part, overcomes some of the weaknesses of the more traditional summed probabilities (SPD) approach, specifically those linked to the calibration process (Bronk Ramsey Reference Ramsey2017). This method limits the artifacts generated by the calibration irregularities and helps to distinguish artificial fluctuations by limiting the sharpest peaks and troughs through smoother oscillations, a process that is also not without criticism for its use of fairly aggressive moving averages (Capuzzo et al. Reference Capuzzo, Snoeck, Boudin, Dalle, Annaert, Hlad, Kontopoulos, Sabaux, Salesse and Sengelov2020; Carleton and Groucutt Reference Carleton and Groucutt2021; Crema and Bevan Reference Crema and Bevan2021). Nevertheless, it is important to note that some sampling biases, such as overdated periods or geographic regions, are still present in KDE models.
Inferring past population trends and dynamics is more complex than analyzing a mere summary of a large 14C dataset (Pardo-Gordó and Carvalho Reference Pardo-Gordó and Carvalho2020; Crema and Bevan Reference Crema and Bevan2021). Such analyses may be biased by taphonomic factors (Surovell et al. Reference Surovell, Byrd Finley, Smith, Brantingham and Kelly2009), archaeological research priorities, 14C method uncertainties, and calibration curves, among others (Gayó et al. Reference Gayó, Latorre and Santoro2015; Williams 2012; Crema et al. Reference Crema, Bevan and Shennan2017; Crema Reference Crema2022). Chronological modeling is an excellent tool for comparative studies, since it can show general trends of human occupation according to different spatial units, such as sites, regions, or altitudinal belts.
The introduction of plant and animal food production is one of the most important achievements in Andean history, and it profoundly impacted the mutual relationships among plants, animals, and humans (Zeder Reference Zeder2015). In the Atacama Desert, plants were domesticated starting in the Late Holocene, in stepwise fashion, following multilinear trajectories (Ugalde et al. Reference Ugalde, McRostie, Gayó, García, Latorre and Santoro2021), and in the circumpuna, Andean camelids were domesticated synchronously (Cartajena et al. Reference Cartajena, Núñez and Grosjean2007). The transition from foragers to farmers/herders is characterized by complex and continuous interaction among humans, animals, and plants, with different degrees of intervention in plants’ and animals’ lifecycles, which can be evaluated through chronological models by analyzing population dynamics over time.
This paper describes population dynamics in the Atacama Desert and their relationship with the domestication of plants and animals through chronological modeling based on the 14C record. First, we studied a large database of 1003 dates, from 11,000 to 150 BP, to analyze whether the introduction of food production economy in any way impacted on human survival or reproduction—and hence demography. Then we studied the same impact at a higher resolution on a subset of this long time-series, the interval from 4000 to 150 BP, when relationships between population dynamics and the economic transformation caused by the introduction of domesticated plants and animals in the different regions and through altitudinal gradient seem to be clearer.
SPATIO-TEMPORAL SCOPE
Regional Settings
The northern Atacama Desert (Latorre et al. Reference Latorre, Betancourt, Rech, Quade, Holmgren, Placzek, Maldonado, Rylander, Smith and Hesse2005) encompasses 59,200 km2 of the South Central Andes in northern Chile, including two ecologically and culturally differentiated regions. The northern of the two is the Arica region, formed by the valleys of five rivers that flow into the Pacific Ocean, and the southern of the two is the Tarapacá region, formed of a system of endorheic streams that do not reach the sea, between the Tana and Loa rivers (Figure 1). Within the Atacama Desert’s contrasting landscapes, made up of hyper-arid desert plains, productive valleys, and fertile ravines, human settlements are usually close to water sources.

Figure 1 Map showing the regional boundaries and altitudinal belts of the northern Atacama Desert and locations of the sites that yielded the dates included in our 14C dataset.
Forming part of the western slope of the Andes, the study area is composed of four altitudinal belts, each presenting a different ecology and human settlement pattern. The coast (<130 m asl) constitutes a source of constantly available marine resources, which was crucial in favoring relatively stable pre-colonial human occupation. The lowlands (130–1700 m asl), including the Cordillera de la Costa, the Occidental Valleys, and the Pampa del Tamarugal, coincide with the hyper-arid desert core, but, at the same time, have variable agricultural potential depending on the availability of water, including very productive spaces in oases on valleys or ravines. Thanks to its rainy season, the precordillera (1700–3700 m asl) has agricultural and herding potential in highland locations. Finally, the altiplano (>3700 m asl) is a high-Andean grassland and shrubland, characterized by hunting and herding resources.
Chronology of the Northern Atacama Desert
The First Settlement and Archaic periods (covering the Late Pleistocene to Late Holocene, ∼13,000–3000 BP) were characterized by the presence of hunter-gatherer groups. During the Late Archaic period (ca. 6000 BP), the first domestic plants (cotton, squash, and Andean tubers) were adopted within a system of low-level food production. Subsequently, quinoa, maize, beans, and chili pepper were introduced, in different intensities (Ugalde et al. Reference Ugalde, McRostie, Gayó, García, Latorre and Santoro2021).
During the Formative period (3000–1000 BP), a gradual sedentarization of lifestyle, new social practices, and new economic structures emerged, along with horticultural production that combined a wide range of crops and wild plants (Núñez and Santoro Reference Núñez and Santoro2011; Uribe et al. Reference Uribe, Angelo, Capriles, Castro, De Porras, García, Gayó, González, Herrera and Izaurieta2020), and with more consolidated agriculture (Rivera Reference Rivera2002), shaping a “Green Revolution” in the desert (Ugalde et al. Reference Ugalde, McRostie, Gayó, García, Latorre and Santoro2021).
During the Middle period (1050–850 BP), in the Arica region, Late Tiwanaku groups settled in the Moquegua valleys, establishing interactions and influencing local Formative groups (Korpisaari et al. Reference Korpisaari, Oinonen and Chacama2014; Muñoz Reference Muñoz2019).
Late prehistory was a period of significant demographic growth (Santoro et al. Reference Santoro, Capriles, Gayó, de Porras, Maldonado, Standen, Latorre, Castro, Angelo and McRostie2017). During the Late Intermediate period (1000–500 BP), there was an expansion of the region used for settlements, especially in the lowlands and the precordillera (Muñoz et al. Reference Muñoz, Agüero and Valenzuela2016), and a remarkable increase in agrohydraulic infrastructure. Then, during the Late period (500–400 BP), local groups were incorporated into the Inca Empire, which exerted differentiated control strategies between the lowlands and the highlands and between the Arica and Tarapacá regions (Santoro and Uribe Reference Santoro and Uribe2018).
MATERIALS AND METHODS
Dataset Structure
The Northern Atacama Radiocarbon Dataset was built based on archaeological 14C dates published from 1963 until January 2021 (Supplementary Materials 1 and 2). It comprises 1003 dates, 80% more than the last dataset compiled for this study area (n=565) (Gayó et al. Reference Gayó, Latorre and Santoro2015). 14C dates (published in journals, proceedings, theses, and some technical reports) were considered only when necessary data—14C age, lab error, material, and provenance—were conveniently reported. Contextual information has also been taken into account, including the precise location of the sample within the site (archaeological spatial unit, subunit) and the predominant social function of the site (i.e., domestic, funerary, agricultural). The result is an open-access dataset available in the free domain (Mendez-Quiros Reference Mendez-Quiros2023).
The collected 14C dates relate to 243 archaeological sites, 137 in the Arica region and 106 in the Tarapacá region. More than 60% of these sites have multiple dates (n>1). The distribution of the dates is spatially uneven, with the highest frequency of dated archaeological contexts in the lowlands (54%) and the coast (27%). The analyzed samples come mainly from domestic (ndates=582) and funerary contexts (ndates=339), most of which are in the Azapa basin (ndates=207). The most frequent material is vegetal (68%)—including wood/charcoal (44%) and wild plant (9%)—followed by human remains (15%), textile (9%), and animal bone (8%). Thanks to the high number of samples processed using AMS dating techniques, the majority of the estimates (n=594, 60%) have a low lab error (less than ±50). Lab errors between ±50 and ±100 uncorrected years are relatively frequent in the database (n=249, 25%), whereas high lab errors (more than ±100) are relatively scarce (n=158, 15%).
Chronometric Protocol and Bias Control
As not all chronometric data have the same reliability, a filtering protocol was applied to select the most reliable estimates (61% of the complete database). To avoid the potential of marine reservoir effect, only terrestrial samples were included (excepting gastropods), and marine fauna samples (ndates=27; 3% of the complete database) were excluded. Although the percentage of marine foods in human diet is unknown, we have also excluded samples of coastal human remains (ndates=74; 7% of the original total database) to prevent marine reservoir bias. We excluded another 158 samples (16%) because the material submitted for dating was unreported or the archaeological context was unreliable, as reported in the original publication. We also excluded samples with a large laboratory error (more than ±100) (ndates=121; 12% of the total database), because such large errors are in most cases the consequence of poorly preserved analyzed samples, with a very small proportion of organic material.
Throughout, we have given priority to short-lived samples, which are generally abundant in the desert due to the excellent preservation. However, in our database, there are still a relatively large number of long-lived samples, and therefore the “old-wood” effect is still a concern, mainly among the conventional 14C dates. We have considered this potential source of bias when interpreting observed peaks in the Summed and KDE probability distributions, by statistically weighting accumulated probability to the frequency of sampled material and the frequency of conventional dating in this part of the dataset.
We have taken into account the bias introduced by the variations in the accuracy of calibration at different parts of the SHCal20 curve (Hogg et al. Reference Hogg, Heaton, Hua, Palmer, Turney, Southon, Bayliss, Blackwell, Boswijk and Ramsey2020). We have modelized a Sum of Probabilities of 3190 simulated 14C estimates with the same lab error (20 years), from 14,000 to 0 BP, to build the accumulated probability distribution on the assumption of a single date every 5 years using OxCal (Figure 2). Given that the number of dates is uniform within each time interval, a straight line would be expected, and departures from this uniform expectation should be consequences of irregularities in the calibration curve (Capuzzo et al. Reference Capuzzo, Zanon, Corso, Kirleis and Barceló2018). This simulation allows us to conclude that there are time intervals when rapid variations in atmospheric14C content may have biased date estimations and the accumulated probability. Particularly problematic sections seem to be 12,750 BP, 11,250 BP, 10,100 BP, 9600 BP, 8300 BP, 7500 BP, 6300 BP, 4900 BP, 2700 BP, 1200 BP, 800 BP, 550 BP, and 0 BP.

Figure 2 Aggregated probability distribution of simulated data (one date per 5-year interval) from 14,000 to 0 BP to test the effect of the calibration curve shape using the SHCal20 curve. Plotted using PAST (Hammer et al. Reference Hammer, Harper and Ryan2001).
Another source of bias is sampling strategies overrepresenting data from sites or archaeological units that have been dated with more intensity (see Table 1 and Supplementary Material 3) or from areas with a denser archaeological record (Supplementary Material 4). We are aware that this potential bias is minimized by increasing the spatial scale and size of the global dataset (Barberena et al. Reference Barberena, Méndez and de Porras2017). But this strategy is not enough to avoid the risk of spurious peaks in the global time-series. We have followed a strict approach to minimize this overrepresentation. Date samples from the same site, archaeological unit, and temporal interval, were statistically checked for apparent contemporaneity (Ward and Wilson Reference Ward and Wilson1978; Ramsey Reference Ramsey2009), and in positive cases, we have statistically combined dates with the same provenience and time (Combine) (Supplementary Material 5).
Table 1 Spatial distribution of dates in the 14C dataset analyzed: 14C dates and 14C events. Regions: northern Atacama Desert (NAD), Arica, and Tarapacá.

Only after checking all those conditions can we say that a higher frequency of 14C events is related to more intense human occupation (Freeman et al. Reference Freeman, Byers, Robinson and Kelly2018). In the remainder of this paper, we discuss when this hypothesis may be at risk.
To evaluate the relationship between population dynamics and the introduction of farming economies, two timescales and different spatial units were analyzed in OxCal, using KDE_Model function and SHCal20 curve (Hogg et al. Reference Hogg, Heaton, Hua, Palmer, Turney, Southon, Bayliss, Blackwell, Boswijk and Ramsey2020) for calibrating (Table 1). First, were analyzed the entire time-series (11,000–150 BP) on a regional basis (northern Atacama Desert, Arica, and Tarapacá regions) to compare different regional historical trajectories. Second, we used a subset of the time-series (4000–150 BP) to compare demographic trends between differentiated altitudinal belts (coast, lowland, precordillera, and altiplano). This subset of the global time range has higher resolution (0.15 dates/year) than the complete one.
RESULTS
11,000–150 BP Regional Modeling
On a regional scale, the complete KDE-averaged chronological model (Figure 3) indicates a very low density of human occupation from the first human presence, in the Late Pleistocene (12,800 cal BP) until 3000 cal BP. The bumps and peaks in this initial part of the resulting distribution cannot be interpreted as population interruptions, because they cannot be differentiated from the irregularities in SHCal20 curve, which are mostly attributed to variations at the atmospheric level in the proportion of 14C (Figure 2). Some earlier studies have suggested a possible population deflation around the mid-Holocene (Barberena et al. Reference Barberena, Méndez and de Porras2017), which locally manifested some centuries before, at 8500 cal BP. Although our results show some interruptions in the calibrated time-series, it is not possible to distinguish population trends from irregularities in the calibration curve, given the low estimated density of population at that time.
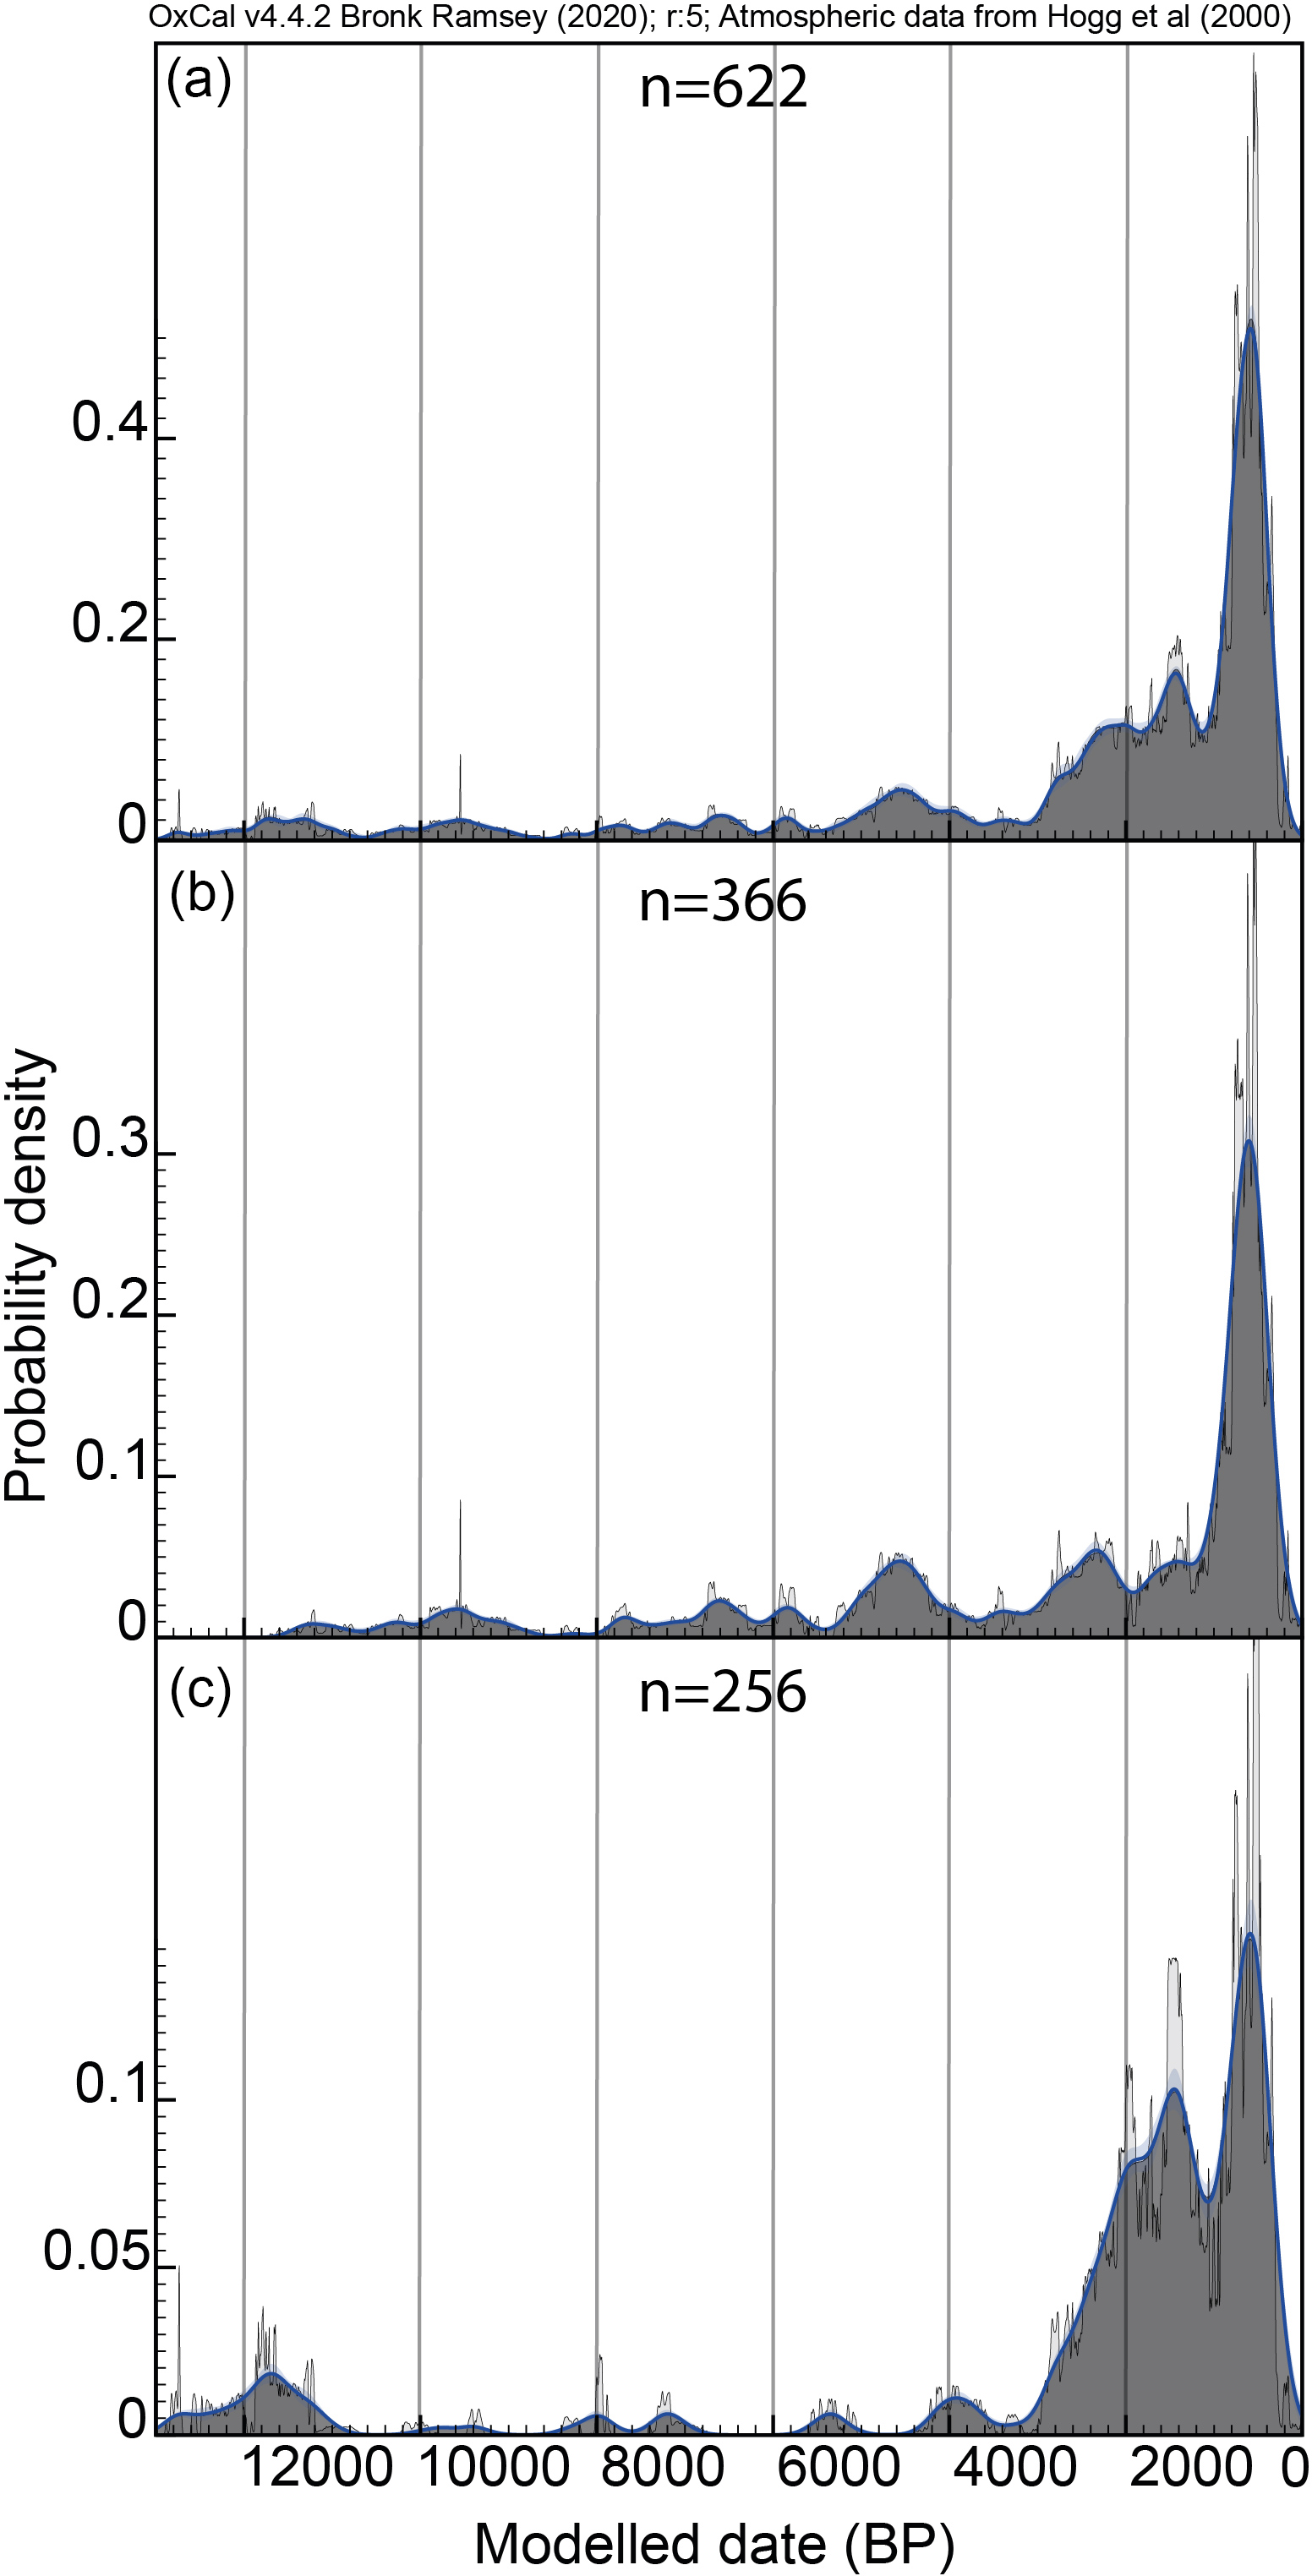
Figure 3 Kernel density estimation (KDE) models for 11,000 BP 14C time-series in the northern Atacama Desert. (a) general dynamics, geographically undifferentiated; general dynamics, geographically differentiated: (b) Arica region, (c) Tarapacá region. Light gray: summed probability distribution; dark gray distribution: KDE.
The accumulated 14C signal does not show a significant change until 3000 cal BP, when a constant increase in the relative frequency of dated archaeological contexts begins. The growth from 3000 cal BP onwards clearly exceeds the irregularity of the calibration curve (Figure 2) and can be considered unaffected by variations in atmospheric 14C. This change suggests a notable turning point in population dynamics, a long period of constant growth, interrupted by an apparent fall-off between 1200 and 800 cal BP, which coincides with a period of rapid change in atmospheric 14C. The highest density, here termed the Late Pre-Hispanic peak, was reached at 1000 and 400 cal BP.
Our analysis of the time-series within regional subsets shows that, although there is a common trend, there are also some differences. The Tarapacá region seems to have been populated earliest, at 12,800–11,000 cal BP. The timing of the long period of sparse occupation by mobile human groups seems to be very similar in both regions (11,000–3000 cal BP). We cannot exclude the possibility of occasional moments of local deflation or even depopulation throughout the Archaic period, although these moments cannot be statistically tested because of their correlation at some points in the global distribution with the irregularities and biases caused by the calibration curve. In both regions, Arica and Tarapacá, the main concentration of dated archaeological contexts is observed after 3000 cal BP, suggesting the end of sparse occupation by mobile hunter-gatherers and the beginning of a more sedentary lifestyle, with a farming economy that still strongly relied on the local wild resources. The demographic success of this new economy would explain the increasing number of dated contexts between 3000 and 300 cal BP. The dated contexts reach their highest density between 800 and 500 cal BP, during the Late Pre-Hispanic peak.
4000–150 BP Altitudinal Belt Modeling
It should be taken into account that 3000 cal BP seems to be a turning point in the Southern Hemisphere Calibration Curve and that irregularities in the KDE distribution may have been affected by the resulting shape of the calibration curve. However, from 2000 cal BP onwards, the increasing 14C signal clearly exceeds possible effects of the calibration curve and the exponential increase in standard taphonomic loss (Surovell et al. Reference Surovell, Byrd Finley, Smith, Brantingham and Kelly2009; Capuzzo et al. Reference Capuzzo, Zanon, Corso, Kirleis and Barceló2018). Moreover, the apparent fall-off around 1000 cal BP also coincides with irregularities in the calibration curve. We cannot exclude the possibility that the apparent climax after 900 cal BP is a consequence of the joint contribution of lesser degrees of taphonomic loss in more recent stratigraphic layers and rapid variations in atmospheric 14C related to the Medieval Climate Anomaly (Hughes and Diaz Reference Hughes and Diaz1994; Lüning et al. Reference Lüning, Gałka, Bamonte, Rodríguez and Vahrenholt2019).
The coast seems to have had higher occupation density than any other altitudinal belt during the Late Archaic, between 4400 and 3000 cal BP (Figure 4). Despite having the smallest territorial extent, it holds a greater population of fisher-foragers along the coastline. Population growth beyond the uniform assumption is statistically relevant after 2800 cal BP. In any case, it is possible to argue for minor variation between the two regions, with an earlier start of the Late Pre-Hispanic peak in the Tarapacá region, where it is expressed more mildly than in the others altitudinal belts.

Figure 4 Kernel density estimation (KDE) models for the 4000 BP 14C time-series subsets for different regions and altitudinal belts. Light gray distribution: SPD; dark gray distribution: KDE.
In the lowlands, hunter-gatherer occupation also seems to have been very low before 3000 cal BP. The transition to a trend of population growth occurs rather suddenly and very late in the Arica region, and more gradually and earlier in the Tarapacá region, where population would have begun to grow synchronously with that of the coast from 3000 cal BP.
The precordillera shows a similar pattern, apparently in sync with the lowlands, with a very small and sparse hunter-gatherer population before 3300 cal BP and a sudden growth from 1000 cal BP onwards. In the Arica region, the 14C signal evidences a low, more constant, and more recent occupation. In contrast, the human occupation in the Tarapacá region starts in the Formative period, from 2300 cal BP onwards.
The number of dated archaeological contexts in the altiplano is not sufficient to come to relevant conclusions.
DISCUSSION
Human occupation in the northern Atacama Desert extends from 12,800 cal BP to the present, following a complex, non-linear, and non-monotonic sequence that includes some apparent discontinuities. Our analysis of chronological models of different time intervals and spatial units (regions and altitudinal belts) suggests variations in population dynamics at those scales.
The First Settlement and Archaic periods (Late Pleistocene and the Early and mid-Holocene) were characterized by a small population, mobile and unevenly distributed in space. The low estimated density of human occupation during those times prevents us from testing whether discontinuities in the time-series may be related to paleoenvironmental changes (Williams et al. Reference Williams, Santoro, Smith and Latorre2008; Barberena et al. Reference Barberena, Méndez and de Porras2017; Riris and Arroyo-Kalin Reference Riris and Arroyo-Kalin2019). In any case, the irregularities in the calibration curve, resulting from rapid variations in atmospheric 14C, suggest the impact of climatic change.
The Archaic period population reaches its highest density between 5300 and 3600 cal BP, which coincides with the first evidence for the domestication of plants among foragers reported for the coast and the valleys, although the addition of these plants did not majorly alter the consumption patterns of these populations (García et al. Reference García, Santoro, McRostie, Mendez-Quiros, Salas-Egaña, Carter, Rothhammer and Latorre2020). The gradual population growth from 3000 cal BP onwards, during the forager–farmer transition (Late Archaic–Early Formative), is consistent with the hypothesis of locally based cultural change (Muñoz et al. Reference Muñoz, Agüero and Valenzuela2016; Santoro et al. Reference Santoro, Capriles, Gayó, de Porras, Maldonado, Standen, Latorre, Castro, Angelo and McRostie2017). In that context, it can be suggested that the coast was home to a more stable population, which probably triggered food production, and which led the population to expand into the lowlands to find better conditions for cultivation (Muñoz and Chacama Reference Muñoz and Chacama2012).
The archaeological record indicates a remarkable increase in the number of domesticated plants and their ubiquity related to horticulture production in the Arica region (Núñez and Santoro Reference Núñez and Santoro2011) and to agrohydraulic features in the Tarapacá region since the Early Formative period (3000–2000 cal BP), because of a Green Revolution (Ugalde et al. Reference Ugalde, McRostie, Gayó, García, Latorre and Santoro2021). However, the intense use and consumption of wild species continued to be a fundamental component of the staple economy (García et al. Reference García, Vidal, Mandakovic, Maldonado, Peña and Belmonte2014).
Population increases from 3000 cal BP onwards in the northern Atacama Desert have been previously pointed out (Williams et al. Reference Williams, Santoro, Smith and Latorre2008; Gayó et al. Reference Gayó, Latorre and Santoro2015). Our investigation suggests that this process of population increase was neither regular nor evenly distributed in time and space. On the one hand, in the Arica region, the initial increase seems to be attenuated, slightly more intense in the lowlands, associated mainly with cemeteries and ceremonial sites in the Azapa valley, shell middens on the coast, and shelters in the precordillera. During the Late Formative period (2000–1100 cal BP), human occupation was noticeably concentrated in the Azapa lowlands. In contrast, in the Tarapacá region, the population density dramatically increased after a very sporadic occupation during most of the Archaic period. Starting in 3000 cal BP, during the Early Formative period, the development of bigger settlements, such as villages and cemeteries, in the lowlands resulted in the first peak of events, between 2100 and 1900 cal BP. This continuous growth persisted through the Late Formative period and led to a demographic peak between 1600 and 1200 cal BP. Our data do not support the supposed demographic collapse during the Formative period suggested by Gayó et al. (Reference Gayó, Latorre and Santoro2015:12).
During the Middle period (1100–900 cal BP), the Arica region presents the start of a striking population increase, especially in the lowlands, coinciding with the start of the Late Pre-Hispanic peak, which contrasts with the apparent fall-off that is observed on the coast and in the precordillera, which may suggest an eventual population displacement toward the valleys.
In both regions, population estimates reach their maximum size between 800 and 500 cal BP, during the Late Pre-Hispanic peak, which appears to be a macro-regional process of population growth during the Late Intermediate period. However, the beginning of this process of population growth (ca. 1000 cal BP), as well as its rate of growth, may have varied among altitudinal belts and regions. Again, our data do not support a hypothesized deflation of the pre-colonial population (cf. Gayó et al. Reference Gayó, Latorre and Santoro2015; Figure 2). This peak of population is most probably the consequence of agricultural development after the introduction of fertilizers (Santana-Sagredo et al. Reference Santana-Sagredo, Schulting, Mendez-Quiros, Vidal-Elgueta, Uribe, Loyola, Maturana-Fernández, Díaz, Latorre and McRostie2021), in addition to the displacement of altiplano populations toward the precordillera and the lowlands during this period. This phenomenon acted as a catalyst for change among farming and herding groups because of its positive effect on food production, as described in colonial documents (Cieza [1553] Reference Cieza1932; Vazquez [1630] Reference Clark1948). Additionally, herding activities took place in the altiplano, precordillera, and lowlands, usually in conjunction with farming activities, which played an important role as a source of fodder.
The Late period dynamics are very difficult to understand using our data, because the extreme of the time-series is affected by a lack of samples from the early and later colonial periods. However, based on our data, we can suggest that the demographic trend that reached its peak during this period subsequently stabilized at that peak level. The minor increase in the population estimate for the precordillera of the Arica region during that time may be related to the arrival of the Inca and their agropastoral state control.
CONCLUSION
The compilation of the Northern Atacama Desert Radiocarbon Dataset is a substantive contribution to the evaluation of pre-Hispanic population dynamics in the South Central Andes. In this work we evaluate the general trends of population dynamics in relation to food production, seeking to open future interpretative lines.
Our study suggests two relevant inflections in the accumulated probability distribution of dated archaeological contexts in the northern Atacama Desert. The first begins at 3000 cal BP, coinciding with the adoption of food production (Santoro et al. Reference Santoro, Capriles, Gayó, de Porras, Maldonado, Standen, Latorre, Castro, Angelo and McRostie2017). The relatively lower intensity of human occupation in the Arica region and the region’s later population growth could relate to horticultural social groups, who begin to continuously occupy the region thanks to the vegetal resources of the valley springs (Muñoz et al. Reference Muñoz, Agüero and Valenzuela2016). Our data suggest a more intense occupation of the Tarapacá region, related to earlier agricultural development, linked with irrigation and crop field features mainly in the lowlands (Segura et al. Reference Segura, Vidal, Maldonado and Uribe2021). There is a delay of approximately 2000 years in the change in estimated demographic trends in the Arica region, probably due to the difference in food production strategies, which involved an earlier and more intensive agricultural development in the Tarapacá region and a later and less intensive horticultural production in the Arica region. Beyond trivial geographical adaptations, we consider that the difference should be explained in terms of the different economic strategies and different organization of production leading to diverse local experiences, rather than in terms of a totalizing and uniform change, especially during the Formative period.
Our data also show that a generalized, abrupt population peak occurred after 1000 cal BP, here termed the Late Pre-Hispanic peak, when the different historical-demographic trends in the two regions converged. This convergence, characterized by high-intensity occupation, seems to be related to a new political and economic context, when farming agriculture became consolidated and economic strategies evolved toward agricultural and livestock intensification, especially in the lowlands and precordillera. Archaeological and historical evidence for population migration from the altiplano during the second half of the Late Intermediate period is also relevant to understanding our population estimates. Despite the absence of the development of agriculture, the coast and the altiplano also reached maximum population dynamics during the Late Pre-Hispanic peak, due to the establishment of very fluid relationships between the different altitudinal belts. Populational growth in areas unsuitable for agriculture can be explained as the consequence of extensive and intense interaction networks that articulated social space. Unfortunately, our data from the altiplano do not allow us to go further in testing such hypotheses.
SUPPLEMENTARY MATERIAL
To view supplementary material for this article, please visit https://doi.org/10.1017/RDC.2023.27
ACKNOWLEDGMENTS
Founded by Agencia Nacional de Investigación y Desarrollo, Chile: BecasChile, FONDECYT grants #1181829 and #1221166; and Ministerio de Ciencia e Innovación de España: PID2019-109254GB-C21. Thanks to Dr. Rafael Micó, PhD. Frances Hayashida and PhD. Calogero Santoro for his constant support and encouragement.


 Open access