


Worldwide, prostate cancer (PC) is one of the most common cancers (30·8/100 000 inhabitants) and is the fifth leading cause of cancer deaths among males (7·8/100 000 inhabitants)( 1 ); however, these statistics vary widely among countries. In Mexico, PC is both the most common cancer and the leading cause of cancer death in males( 1 ). This unusual pattern of both high totality suggests that a higher proportion of PC at diagnosis is classified as high-risk PC (Gleason≥7)( Reference Gómez-Guerra, Martínez-Fierro and Alcántara-Aragón 2 , Reference Vázquez-Salas, Torres-Sánchez and López-Carrillo 3 ). This higher proportion of high-risk PC could be the result of a delayed diagnosis; however, as we have shown in India, it often results in a combination of low incidence and high mortality( Reference Hebert, Ghumare and Gupta 4 ). It also could be a consequence of unusual prevalence of some potential PC risk factors.
Well-established risk factors for PC include age, ethnicity (African–American) and history of PC in first-degree relatives( Reference Grönberg 5 ). However, a recent hypothesis has emerged regarding the role of chronic inflammation on prostatic tumour initiation and/or tumour progression( Reference Nakai and Nonomura 6 ). Some lifestyle features such as dietary habits are considered potential determinants of chronic inflammation and might be associated with PC incidence and PC progression. Red meat, dairy products and carbohydrates are pro-inflammatory( Reference Esmaillzadeh, Kimiagar and Mehrabi 7 , Reference Corley, Kyle and Starr 8 ), and they have been suggested to be associated with increased risk of PC( Reference RR Donnelley 9 , Reference Lin, Aronson and Freedland 10 ). High intakes of PUFA, mainly n-6 fatty acids, also have been associated with an increased risk of high-grade PC (Gleason score 8–10)( Reference Kristal, Arnold and Neuhouser 11 ). In contrast, a diet rich in fruits and vegetables is associated with lower concentrations of C-reactive protein (CRP) and fibrinogen and with decreased PC risk( Reference Norat, Aune and Chan 12 ).
On the basis of the available worldwide information about diet and inflammation, a literature-derived, population-based Dietary Inflammatory Index (DIITM) was developed( Reference Shivappa, Steck and Hurley 13 ). This DII correlates positively with CRP, IL-6 and homocysteine( Reference Shivappa, Steck and Hurley 14 , Reference Wirth, Burch and Shivappa 15 ). Higher DII scores also have been associated with several types of cancer( Reference Shivappa, Zucchetto and Serraino 16 – Reference Shivappa, Hébert and Zucchetto 29 ), including PC( Reference Shivappa, Bosetti and Zucchetto 30 – Reference Graffouillère, Deschasaux and Mariotti 32 ). Two hospital case–control studies, one conducted in Italy (OR4th v. 1st quartile 1·33; 95 % CI 1·01, 1·76; P for trend=0·04)( Reference Shivappa, Bosetti and Zucchetto 30 ) and one in Jamaica (OR4th v. 1st quartile 2·39; 95 % CI 1·14, 5·04; P for trend=0·08)( Reference Shivappa, Jackson and Bennett 31 ), and a recent French cohort study (hazard ratio4th v. 1st quartile 2·08; 95 % CI 1·06, 4·09)( Reference Graffouillère, Deschasaux and Mariotti 32 ) showed an increased PC risk with higher DII scores. However, none of these studies reported information with respect to PC aggressiveness and they did not adjust for other pro- and anti-inflammatory factors such as physical activity (PA) habits.
Hence, the objective of the present study was to evaluate the association between energy-adjusted DII (E-DIITM) and PC, as well as PC aggressiveness, in a case–control study carried out in Mexico City.
Methods
From November 2011 to August 2014, we conducted a case–control study with males aged 42–94 years, who were residents of Mexico City, and without a previous history of any cancer type; the details of the study have been previously reported( Reference Vázquez-Salas, Torres-Sánchez and López-Carrillo 3 ). In brief, out of 468 males with newly diagnosed and histologically confirmed PC at any clinical stage identified at four tertiary- and two secondary-level hospitals in Mexico City, 402 (85·9 %) were enrolled into the present study. From each participant, we obtained information concerning their Gleason score at diagnosis. PC cases were classified as follows: well-differentiated or low-risk (Gleason≤6); moderately differentiated (Gleason=7) and poorly differentiated or undifferentiated (Gleason grade≥8)( 33 ).
Eligible population controls included 920 men with no diagnosis of PC, who were not under evaluation because of urological symptoms likely to be related with PC (haematuria or dysuria) or who did not have a previous report of prostate antigen specific of >4 ng/ml; 805 (87·5 %) were enrolled into the study and were matched 2:1 for age (±5 years) with index cases. On the basis of the proportional probability of the household number reported by the Mexican National Institute of Statistics and Geography (Instituto Nacional de Estadística y Geografía), we selected thirty-three basic geostatistical areas of Mexico City and, in each of these, we sampled ten blocks. After cases were identified, controls were visited at their homes. Household visits started from the north-east corner of the blocks, and consecutive households were selected to participate in the study. In each household, we verified how many males met inclusion criteria; if more than one man was available, we randomly selected one to participate in the study. If a potential control was not present at home, we made up to three attempts to locate him before searching for another possible control.
A brief questionnaire requesting socio-demographic information (age, educational level, civil status and birthplace) was administered to all subjects who did not agree to participate. Owing to extremely low (n=9, <3347 kJ (<800kcal)) or high (n=9, >18828 kJ (>4500kcal)) energy consumption, we excluded eighteen subjects. In addition, one subject who did not respond to the FFQ was excluded. The final study population consisted of 394 cases and 794 controls (Fig. 1).
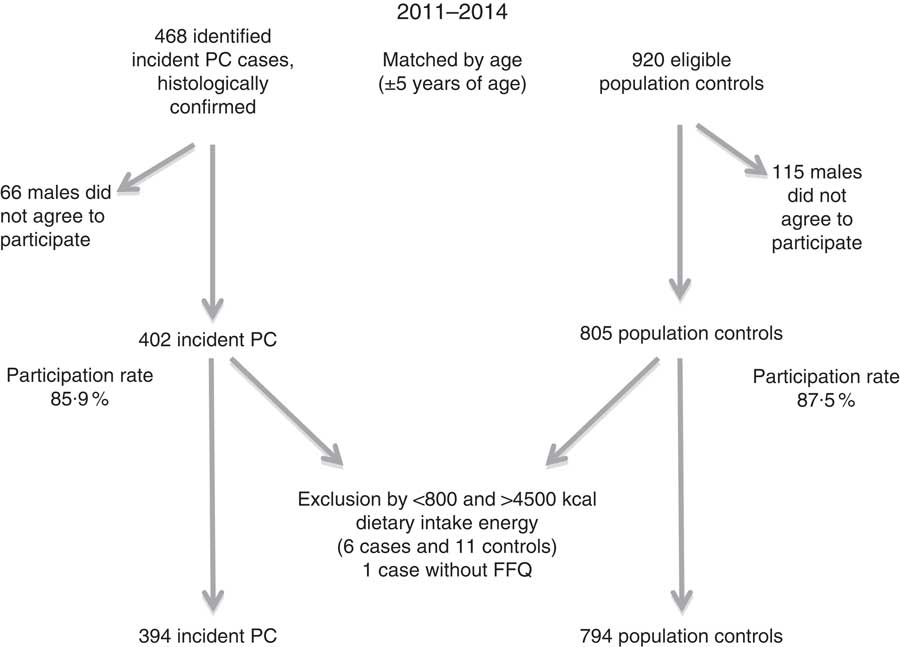
Fig. 1 Recruitment of cases and controls in Mexico City study. PC, prostate cancer.
The study was conducted in accordance with the principles established by the Declaration of Helsinki, and was approved by the Ethics Committee of each of the participating hospitals and the Ethics Committee of the Instituto Nacional de Salud Pública (INSP) (CI: 980). All the study participants signed an informed consent letter after reading it and after receiving an explanation on any doubt.
Interviews
Men who agreed to participate in the present study were interviewed to obtain information regarding socio-demographic characteristics (age, highest educational level completed, usual occupation, marital status, birthplace and length of time residing in Mexico City). We also requested information on familial history of several cancers (prostate, breast, ovarian and colon cancer in first-degree relatives), as well as personal history of chronic diseases (dyslipidaemia, diabetes, hypertension, etc.), sexually transmitted diseases, leisure-time PA, smoking history and diet. As BMI at diagnosis can be affected by the disease under study, we decided not to use the BMI calculated on the basis of height and weight at the time of interview or diagnosis. We asked cases and controls about their weight (kg) 2 years before diagnosis and interviews, respectively, and we estimated BMI on the basis of this information. According to WHO cut-off points, the BMI was categorised as follows: <25, 25–30 and ≥30 kg/m2.
Trained staff conducted both types of interviews, and staff members were blinded to the study’s hypothesis; each interview lasted 45 min, on average. Cases were interviewed at the hospitals, and controls were interviewed at their homes.
Dietary information
A semi-quantitative, previously validated FFQ of 127 food items was used to assess the usual daily dietary intake for 3 years before diagnosis for cases and for 3 years before interviews for controls( Reference Hernández-Ramírez, Galván-Portillo and Ward 34 ). For each food item, the questionnaire contained ten response options regarding frequency of consumption of a pre-determined portion, ranging from ‘never’ to ‘6 or more times a day’. Each daily consumption frequency reported by the participants was converted into grams or millilitres of intake per day. Conversions were performed using the measurements standardised and validated for the National Nutrition Survey 1999( Reference Rivera-Dommarco, Shamah-Levy and Villalpando-Hernández 35 ). Daily macronutrient and micronutrient intakes were estimated using a food composition database, obtained from the Food Processor Nutrition Analysis and Fitness Software (version 10.11.0, 2011; ESHA Research, Inc.)( 36 ), which includes data on traditional Mexican food. FFQ-derived dietary data were used to calculate DII scores for all participants. The DII is based on literature published through 2010 linking diet with inflammation. Individual intakes of food parameters on which the DII is based were then compared with a world standard database. A complete description of the DII and the validation work, including DII derived from both dietary recall and a structured questionnaire similar to an FFQ and tested using interval values of high-sensitivity CRP, are available elsewhere( Reference Shivappa, Steck and Hurley 37 , Reference Alkerwi, Shivappa and Crichton 38 ). In brief, to calculate DII for the participants of this study, the food parameters obtained by our FFQ were first linked with the regionally representative world database that we constructed, which provided a robust estimate of standard global daily intake (mean values and standard deviations) for each parameter. These, then, become the multipliers to express an individual’s exposure relative to the standard global mean (SGM) as a z-score. This is achieved by subtracting the SGM from the daily intake reported and dividing this value by the sd. To minimise the effect of ‘right skewing’ (a common occurrence with dietary data), this value was then converted into a centred percentile score. The centred percentile score for each food parameter for each individual was then multiplied by the respective overall inflammatory effect score of each parameter, which is derived from the literature review, in order to obtain the individual’s food parameter-specific DII score( Reference Shivappa, Steck and Hurley 37 , Reference Alkerwi, Shivappa and Crichton 38 ). A total of twenty-seven food parameters were utilised to calculate the DII score (carbohydrate, protein, total fat, cholesterol, fibre, SFA, MUFA, PUFA, n-3, n-6, vitamin A, vitamin B1, vitamin B2, vitamin B3, vitamin B6, vitamin B12, vitamin C, vitamin D, vitamin E, folic acid, Fe, Mg, Se, Zn, β-carotene, alcohol and caffeine). All the food parameter-specific DII scores were then added together to create an overall DII score for each study participant: DII=b1×n1+b2×n2 … b27×n27, where b refers to the literature-derived inflammatory effects score for each of the evaluable food parameters, and n refers to the food parameter-specific centred percentiles, derived from this case–control’s dietary data( Reference Shivappa, Steck and Hurley 37 , Reference Alkerwi, Shivappa and Crichton 38 ). DII was energy adjusted using the energy density approach, and all DII nutrients were calculated per 4184 kJ (1000 kcal) of energy.
Physical activity
We estimated PA throughout life using information on activity type, number of hours per day, days per week and months per year spent on each activity at 15–18 years, at 19–29 years and at >30 years of age. For each life stage, we estimated total metabolic equivalents of task (min/d per year) and, with that information, we finally calculated, for each individual, the leisure-time PA pattern throughout life using k-means+ method for longitudinal data in R software( Reference Genolini, Alacoque and Sentenac 39 ). We identified three patterns: pattern A, characterised by high PA intensity early in life but with an important reduction throughout life; pattern B, characterised by consistently low PA intensity; and pattern C, characterised by higher PA intensity throughout life. The reference group comprised males who did not perform PA at any life stage.
Statistical analysis
The E-DII score was used as a continuous variable, as well as categorised into tertiles according to E-DII distribution in controls. E-DII scores and social, demographic and anthropometric characteristics were compared between cases and controls. Depending on the variable type studied, we used the Student t, the χ 2 or the ANOVA tests. The main food or food groups that contributed to DII variability were identified by partial R 2 through multiple linear regression models.
Crude and adjusted associations between PC and E-DII (continuous or categorical variable) were estimated utilising unconditional logistic regression models, and age was included as an adjusting variable in bi- and multi-variable models. The association between E-DII (continuous or categorical) and PC aggressiveness was evaluated through independent logistic regression models, in which we compared high (≥8), moderate (=7) and low (≤6) PC risk cases v. controls.
As potential confounders, we evaluated variables that, according to the literature, are known or suggested PC risk factors that could modify or confound the association between PC and E-DII. The final model included the following variables: educational level, history of PC in first-degree relatives, BMI 2 years before the interview, PA throughout life, smoking status 5 years before the interview, history of chronic diseases and age.
All the analyses were performed using STATA® version 13.0 statistical software.
Results
By design, mean age at interview was similar among cases (67·7 (sd 8·4) years) and controls (66·9 (sd 8·9) years). Compared with controls, cases had a higher educational level (20·6 v. 11·7 % had a university degree or higher), were more likely to have smoked (43·4 v. 35·2 %), and were more likely to have history of hypertension, diabetes or dyslipidaemia (58·1 v. 41·2 %). Among cases, there also was a higher proportion of familial history of PC in first-degree relatives (10·4 v. 2·5 %) and either no PA (14·7 v. 9·3 %) or reduction in PA throughout life (24·9 v. 17·0 %). Anthropometric parameters were similar between cases and controls, with the exception of waist circumference (94·9 (sd 9·9) v. 97·9 (sd 10·1) cm) and waist:hip ratio (0·95 (sd 0·05) v. 0·97 (sd 0·06)) at the time of the interview, which was significantly lower among cases than controls; in contrast, cases reported a higher average energy intake (2172·1 (sd 717·8) v.1959·3 (sd 681·9) kcal) (Table 1).
Table 1 Selected characteristics of the study population (Numbers and percentages; mean values and standard deviations)
PC, prostate cancer.
* Birthplace: South: Campeche, Chiapas, Guerrero, Oaxaca, Quintana Roo and Yucatán; West-central: Aguascalientes, Colima, Guanajuato, Jalisco and Michoacán; East-central: CDMX, Hidalgo, Estado de México, Morelos, Puebla, Querétaro and Tlaxcala; North: Chihuahua, Coahuila, Durango, San Luis Potosí, Zacatecas, Baja California, Baja California Sur, Sinaloa, Sonora, Nayarit, Nuevo León and Tamaulipas; and East: Veracruz and Tabasco.
† United: married and common law marriage.
‡ Smoking condition 5 years before the interview.
§ Hypertension, diabetes or dyslipidaemia.
|| Familial history of prostate cancer in first-degree relatives.
¶ Pattern A: males who performed high physical activity during adolescence and showed the most important reduction throughout life; Pattern B: always performed low physical activity; and Pattern C: always performed relativity higher physical activity.
** At the time of the interview.
†† 2 years before the interview.
Mean E-DII was 0·43 (minimum to maximum: −4·59 to 3·50) v. 0·52 (minimum to maximum: −4·47 to 4·51) for cases and controls, respectively (data not shown in tables). As expected, and similar to previous studies, the majority of food or food-group intake resulted according to the inflammatory potential estimated by E-DII (online Supplementary Table S1). Foods that contributed most to E-DII variability (approximately 25 %) were maize tortillas and sugared beverages (data not shown in tables). Distribution of study population characteristics by tertiles of E-DII are depicted in Table 2. Subjects in the highest tertile were younger (65·2 (sd 8·9) v. 68·3 (sd 8·3) years), less educated (52·9 v. 38·0 %), were current smokers (36·3 v. 23·7 %), were shorter (164·3 (sd 6·9) v. 165·8 (sd 6·1) cm), and also reported a lesser history of chronic diseases (41·7 v. 51·5 %) and higher mean energy intakes (9545·7 (sd 2990·7) v. 7943·3 (sd 2966) kJ (2281·5 (sd 714·8) v. 1898·5 (sd 708·9) kcal)) than subjects in the first tertile.
Table 2 Selected characteristics of the study population according to energy-adjusted tertiles (Numbers and percentages; mean values and standard deviations)
PC, prostate cancer.
*P<0·001, **P<0·005, ***P<0·05.
* Birthplace: South: Campeche, Chiapas, Guerrero, Oaxaca, Quintana Roo and Yucatán; West-central: Aguascalientes, Colima, Guanajuato, Jalisco and Michoacán; East-central: CDMX, Hidalgo, Estado de México, Morelos, Puebla, Querétaro and Tlaxcala; North: Chihuahua, Coahuila, Durango, San Luis Potosí, Zacatecas, Baja California, Baja California Sur, Sinaloa, Sonora, Nayarit, Nuevo León and Tamaulipas; and East: Veracruz and Tabasco.
† United: married and common law.
‡ Smoking condition 5 years before the interview.
§ Hypertension, diabetes or dyslipidaemia.
|| Familial history of prostate cancer in first-degree relatives.
¶ Pattern A: males who performed high physical activity during adolescence and showed the most important reduction throughout life; Pattern B: always performed low physical activity; and Pattern C: always performed relatively higher physical activity.
** At the time of the interview.
†† 2 years before the interview.
After adjusting for potential confounders, we did not observe any significant association (Table 3) between E-DII and PC risk. The corresponding adjusted OR for PC according to continuous and categorical E-DII were OR 1·02; 95 % CI 0·94, 1·11; P=0·65 and OR3rd v. 1st tertile 1·18; 95 % CI 0·85, 1·63; P for trend=0·33, respectively. These results remained non-significant, although there was a suggestion of increased risk among subjects with a Gleason score≥8 – that is, poorly differentiated cancers (OR3rd v. 1st tertile 1·46; 95 % CI 0·88, 2·42; P for trend=0·14) (Table 3).
Table 3 Association between energy-adjusted dietary inflammatory index (E-DII) and prostate cancer (PC) risk and aggressiveness (Odds ratios and 95 % confidence intervals)
Ca, cases; Co, controls.
* Adjusted by educational level, history of PC in first-degree relatives, BMI 2 years before the interview, physical activity throughout life, smoking status 5 years before the interview, history of chronic diseases and age.
† Low-risk or well-differentiated PC.
‡ Moderately differentiated PC.
§ Undifferentiated PC.
Discussion
In this case–control study, there is no evidence of an association between E-DII and PC risk; however, a non-significant increase in high-risk (Gleason≥8) PC was observed in the highest E-DII tertile. Until now, no study has evaluated the association between E-DII and PC aggressiveness; all previous studies have only evaluated the DII and PC risk association, and their results suggest a significant PC risk increase in relation to a pro-inflammatory diet. In contrast with previous studies (Table 4), the E-DII mean observed among our controls (0·52 (sd 1·53)) was higher, and suggests that Mexican males consume a more pro-inflammatory diet than individuals in Italy, Jamaica and France. Because of the high prevalence of this pro-inflammatory diet, along with a probable small effect of E-DII on PC risk, we estimated that our study had only sufficient statistical power to detect an association between E-DII and PC ≥1·5.
Table 4 Comparison among studies that have evaluated the association between energy-adjusted or dietary inflammatory index (DII) and prostate cancer (PC) (Mean values and standard deviations; odds ratios and 95 % confidence intervals)
Ca/Co, cases/controls; T, tertile; Q, quartile.
* From between nine and twenty pro- and anti-inflammatory items used for calculating the DII, we calculated the proportion of pro- and anti-inflammatory included items.
† T3 v. T1; all PC.
‡ T3 v. T1; PC (Gleason score, 8–10).
§ Prospective cohort study.
|| Q4 v. Q1.
In our population, foods that contributed most to E-DII variability were maize tortillas and sugar-sweetened beverages. Mean intakes of maize tortillas (7·68 (sd 6·30) v. 7·0 (sd 5·11) tortillas/d) and sugar-sweetened beverages (1·0 (sd 0·78) v. 1·0 (sd 0·73) drinks/d) were similar between cases and controls, as well as similar to those reported in the general population of Mexico City( Reference Ávila-Curiel, Shamah-Levy and Chávez-Villasana 40 ). Tortillas are a main source of maize in the Mexican diet and, in some areas of the country, can account for 70 % of total energy intake( Reference Trejo-González, Feria-Morales and Wild-Altamirano 41 ). Meanwhile, according to the soft-drink industry, Mexico has one the highest annual per-capita intakes worldwide( Reference Barquera, Hernández-Barrera and Tolentino 42 ). However, we cannot reject the possibility of this pro-inflammatory diet might be the consequence of the minor proportion of anti-inflammatory items that were used to calculate DII (Table 4).
The DII is unique in that it is based on the existing literature regarding diet and a set of well-established inflammatory markers( Reference Shivappa, Steck and Hurley 13 ). Other indices are limited by the fact that they tend to be very culture specific or they are strongly associated with characteristics of particular study populations or, quite commonly, some combination of the two. Regardless of their inherent superiority in this respect, DII and E-DII scores are only as good as the dietary data on which they are based. Ultimately, the DII is dependent on the quality of the dietary assessment upon which the computation is based (it cannot make up for deficiencies in the methods of obtaining the dietary data). In addition, dietary homogeneity, which is evident in this population( Reference Wynder and Hebert 43 ), could play an important role in obscuring a true dietary inflammation-PC effect.
A main concern in case–control studies is the possibility of differential measurement error. In our study, we consider that this possibility is low because participants and interviewers were blinded to any specific study hypothesis. In addition, it is unlikely that estimation of DII could be differentially affected by an under-reported consumption of high pro-inflammatory potential food by cases. As part of the questionnaire, we included a question on what people considered to be the cause of PC, and very few cases responded that diet could be one of these. In addition, we compared E-DII means according to interviewers and did not find any significant differences. The possibility that interviewing cases and controls in different environments could affect our results is also improbable. Interviews were held under similar conditions of privacy as far as possible, and, unlike other possible PC risk factors, diet is not a characteristic susceptible to stigmatisation. In any event, we believe that if any measurement error occurred, it is most likely to be non-differential. If so, this would reduce statistical power and bias the outcome towards the null.
Participation rates between cases and controls were relatively high (85·9 and 87·5 %, respectively), and we did not observe differences between subjects who agreed and those who did not agree to participate in relation to some socio-demographic characteristics (age, marital status and educational level)( Reference Vázquez-Salas, Torres-Sánchez and López-Carrillo 3 ). The National Health and Nutrition Survey 2006 did not contain information on diet in the oldest males; however, the median intake of fat (53·1 v. 55·1 g) and carbohydrates (274·7 v. 273·7 g) reported for men (aged 20–59 years), residents of Mexico City, were similar to those estimated in our control group( Reference Barquera, Hernández-Barrera and Campos-Nonato 44 ). In the same respect, about 75 % of cases at diagnosis were classified as high risk for PC (Gleason≥7). This figure is similar to that reported in a previous study carried out in a general population in north-eastern Mexico( Reference Gómez-Guerra, Martínez-Fierro and Alcántara-Aragón 2 ). However, because of the procedure used to select our population controls and the fact that some indolent PC might be asymptomatic throughout life, we were unable to discard the fact that some controls could have an indolent PC. This situation could reduce the possibility of finding a significant association with PC risk, but we think its impact on PC aggressiveness is minimal.
The final models were adjusted for known risk factors of PC, such as PA throughout life and a history of chronic diseases, etc. However, we cannot rule out the possibility of residual confounding. Owing to the study design, it was impossible to obtain information on BMI at different life stages. Among cases, the BMI at diagnosis can be affected by disease; therefore, we decided to adjust by BMI based on self-reported height and weight 2 years before diagnosis or interview. This decision is not free of error and could have affected our results, but we believe that using it conferred a temporal advantage. Likewise, because of the possibility of a measurement error in BMI based on self-reported height and weight 2 years before diagnosis or interview, we cannot reject a possible interaction between BMI and E-DII.
To our knowledge, this is the first case–control study that used population-based controls and considered PC aggressiveness. Population controls can properly represent the exposure of the population from which the cases arise, especially exposures such as diet that can be shared by a large number of diseases. We also had access to good data on smoking, and we used a novel method of categorising PA. In relation to smoking history, we considered smoking status 15 years before the diagnosis or interview. For PA, we did not use the information at diagnosis or interview but reconstructed the trajectory along life.
In conclusion, although our results were null, we cannot rule out the pro-inflammatory role of diet on prostate carcinogenesis. Our results could be the consequence of lack of study power for detecting a significant, small association or issues regarding dietary homogeneity. To date, this association has been studied mainly by means of hospital case–control studies, and a recent study suggests that diet, through its inflammatory potential, could be related to the prognosis of patients with more aggressive PC( Reference Zucchetto, Gini and Shivappa 45 ). For those reasons, we consider it necessary to evaluate this association using cohort studies that take PC aggressiveness into account, thus addressing the limitations of the case–control study design.
Acknowledgements
The authors are grateful to each of the following participating hospitals: General Hospital of Mexico (SSA), National Cancer Institute (SSA), Salvador Zubirán National Institute of Medical and Nutrition Sciences (SSA), the Centro Médico Nacional-Siglo XXI Oncology Hospital (IMSS), the Dr Carlos McGregor Sánchez-Navarro Regional General Hospital No.1 (IMSS), and the Adolfo López Mateos Regional Hospital (ISSSTE). Likewise, the authors are grateful to the staff of those hospitals and to the National Institute of Public Health (INSP) who facilitated our work, especially to Arianna Ventura-Bahena, BSc, and Ms Nicol Ventura-Bahena, who participated in data coding and entry, respectively.
This study was supported by CONACyT, grant number 140482. Both N. S. and J. R. H. were supported by grant number R44DK103377 from the United States National Institute of Diabetes and Digestive and Kidney Diseases. The authors declare that CONACyT and the NIDDK played no role in the design, analysis or writing of this paper. In addition, the study did not receive financial support of any type from industry.
R. A. V.-S. performed the statistical analyses, interpreted results and wrote initial drafts of the manuscript; N. S. computed the DII and contributed to the design of the analyses and revision of the manuscript; M. G.-P. participated in the estimation of macronutrients and micronutrients, as well as in the revision of the manuscript. L. L.-C. participated in the study design and critical revision of manuscript. J. R. H. invented the DII and helped in the interpretation of results and revision of the manuscript. L. T.-S. designed the study, contributed to data collection, and also consulted on statistical analyses, writing and revising the manuscript.
J. R. H. owns a controlling interest in Connecting Health Innovations LLC (CHI), a company planning to license the rights to the DII from the University of South Carolina, so as to develop an electronic application (computer and smartphones) for patients and dietary intervention in clinical settings. N. S. is an employee of CHI.
Supplementary Material
For supplementary material/s referred to in this article, please visit https://doi.org/10.1017/S0007114516003986


