


1. Introduction
Knowledge about brain functions is needed not only to help alleviate mental illness, neurological diseases, memory loss and aging, but also to learn more about the normal organization of the brain and the massive information arrays that are handled by natural neural networks. Converting data from the brain to knowledge about the healthy and diseased brain requires comprehensive data integration, since the brain can be fully characterized and understood only by combining a wide range of data acquired at different spatial and temporal scales and with manifold techniques. As in many other fields of science, however, the capacity to generate massive amounts of new data has by far surpassed the ability to integrate and make sense of the data collected. The challenge of combining and unifying disparate multimodal and multilevel data collected from the brain into meaningful and valuable information, has triggered developments in the field of neuroinformatics, which combines neuroscience with information technology and deals with the creation of data systems that are required to achieve advanced integration of data needed to understand the nervous system [Reference Amari, Beltrame, Bjaalie, Dalkara, De Schutter and Egan1���Reference Bjaalie3].
The Human Brain Project (HBP), a multinational European brain research initiative, was formed to advance neuroscience and medicine and to create brain-inspired information technology [Reference Amunts, Ebell, Muller, Telefont, Knoll and Lippert4]. The project comprises multiple subprojects, including experimental neuroscience research and infrastructure platforms contributing tools and workflows for data analysis, modeling and simulation, robotics, and ethics frameworks. A key concept is the integration of heterogeneous data from human and rodent brain in a common data system, and the use of such data for analysis and computational modeling and simulation of brain function. The project’s Neuroinformatics Platform, in close interaction with other parts of the project, covers the preparatory steps for data integration: making data discoverable, accessible, interpretable, and reusable, as captured in the recently introduced FAIR Guiding Principles (Findability, Accessibility, Interoperability, and Reusability; [Reference Wilkinson, Dumontier, Aalbersberg, Appleton, Axton and Baak5]). A prerequisite for data integration is that the nature and relationships of data parameters are well defined, and possible to compare. As a start, basic features of data to be used in data integration efforts must be consistently and reliably described. Metadata is the term used to describe and characterize features of data (“data about data”), and the use of controlled vocabularies and ontologies is key to making metadata consistent [Reference Bowden, Duback, Koslow and Subramaniam6–Reference Burger, Davidson and Baldock9]. A special category of metadata related to the brain is spatial metadata, describing the anatomical location from which the data originates. Location is a critical descriptor for brain data, since the brain is organized into numerous structures with different subparts, cell groups, or layers, and with function closely coupled to location. Location thus provides a natural basis for organizing data across spatial scales, and reference atlases of the brain and neuroinformatics tools have emerged as relevant technologies in support of such efforts [Reference Amari, Beltrame, Bjaalie, Dalkara, De Schutter and Egan10–Reference baldock, Burger, Goryanin and Goryachev12].
In this paper, we illustrate key principles of the HBP workflows used for registration of a range of data categories to reference atlases of the brain. Neuroscientists upload experimental data and associated metadata to the HBP data systems. A curation service delivered by the Neuroinformatics platform organizes the data and helps standardize the metadata. The curation process includes registration of experimental data to common frameworks represented by the reference atlases. We exemplify the workflows using rodent brain data and demonstrate how data from different experimental modalities, registered to reference atlases, can be combined and unified with other data categories. Finally, we discuss the application of these approaches for characterization and analysis of rodent models of neurological diseases.
2. Assigning location to data from the brain: reference atlases for spatial data integration
Assigning anatomical location to data acquired from the brain can be done at the level of structures of the brain, or through the use of coordinate systems. Reference atlases offer a standardized representation of anatomical location and are commonly used tools to assign location to data. They are thus highly relevant tools for spatial data integration.
Traditional atlases of the brain are books or articles containing series of two-dimensional (2D) diagrams of cross-sections through a brain, showing delineations and names of the structures present in each section (see, e.g. [Reference Paxinos and Watson13, Reference Paxinos and Franklin14]). The structural delineations are typically derived from interpretations of features observed in histological sections. The limitations of such 2D reference atlases are primarily the missing information between each diagram (due to use of incomplete histological material) and the single plane of orientation of the diagrams. For future data integration efforts, a new generation of three-dimensional (3D) reference atlases is used ([Reference Lein, Hawrylycz, Ao, Ayres, Bensinger and Bernard15–Reference Majka and Wójcik19]; see also www.brain-map.org; www.nitrc.org; http://scalablebrainatlas.incf.org). These atlases are based on either 3D reconstruction of images taken from complete series of histological sections, or on tomographic imaging data acquired with, e.g., magnetic resonance imaging (MRI) and diffusion tensor imaging (DTI). The volumetric data in these reference atlases allows the image volumes to be re-sliced and viewed in arbitrary angles with minimal loss of image quality due to the isotropic acquisition of the images. For rodent experimental data, the Human Brain Project uses two volumetric atlases (Fig. 1): the Allen Mouse Brain Atlas [Reference Koslow and Subramaniam20] and the Waxholm Space rat brain atlas [Reference Papp, Leergaard, Calabrese, Johnson and Bjaalie16, Reference Kjonigsen, Lillehaug, Bjaalie, Witter and Leergaard21].

Fig. 1 Three-dimensional rodent brain reference atlases used by the HBP.
(A) The Allen Mouse Brain Atlas (v.3; 13; see also [Reference Dong22] and (B) the Waxholm Space atlas of the Sprague Dawley rat brain [Reference Papp, Leergaard, Calabrese, Johnson and Bjaalie16, Reference Kjonigsen, Lillehaug, Bjaalie, Witter and Leergaard21]. The atlases have been sliced coronally, giving a view of deep brain structures. The volumetric reference atlas delineations have isotropic voxels and can be arbitrarily sliced in any angle of orientation.
The first version of the Allen Mouse Brain Atlas was reconstructed from multiple series of Nissl stained histological sections [Reference Dong22]. Building on the high level of architectonical details available in the histological material, more than a thousand anatomical regions were delineated. The latest version of the atlas (v3) contains a high resolution population average image volume from serial two-photon tomography, integrating shape and signal intensity over 1675 specimens (mouse.brain-map.org). The Allen Mouse Brain Atlas employs a Cartesian coordinate system, referred to as the Common Coordinate Framework, complemented by a curved coordinate system in the cerebral cortex to enable integration of information from different cortical depths.
The Waxholm Space rat brain atlas provides volumetric anatomical delineations of the rat brain based on high resolution isotropic MRI and DTI of a single animal. The atlas is navigated using the Waxholm Space coordinate system with its origin set to the midpoint of the anterior commissure (Fig. 2). The primary entry point for experimental data into Waxholm Space is through image alignment to the MRI template. Regions of interest are then assigned coordinates, allowing comparison to other datasets that have been mapped to the same atlas. Coordinates can also be transformed to other coordinate systems for access to information available on the basis of location [Reference Papp, Leergaard, Csucs and Bjaalie23].

Fig. 2 External and internal reference points and coordinate systems in a rat brain reference atlas.
(A) Cranial landmarks bregma (br), lambda (la), and the interaural line (IAL) are marked on a rat skull (volumetric rendering from μCT; DigiMorph Library, University of Texas at Austin). The position of the brain within the skull is indicated by the yellow outline. (B) The axes of the Waxholm Space coordinate system (blue lines) are shown relative to the anterior commissure (structure in color). The position of bregma and lambda are indicated above the brain surface (derived from the Waxholm Space atlas of the Sprague Dawley rat brain; [Reference Papp, Leergaard, Calabrese, Allan Johnson and BjaalieFootnote 46]).
All datasets, regardless of spatial scale or experimental modality, are associated with an anatomical location in the brain. To bring diverse types of experimental data into the same anatomical space, 2D or 3D images are aligned to a reference atlas (for an overview of alignment approaches, see e.g. [Reference Zuk and Stella Atkins24, Reference Toga and Thompson25]). Once the anatomical location of the data is established, regions or features of interest are assigned coordinates, allowing for comparison to other mapped datasets and queries for additional information [Reference Zaslavsky, Baldock and Boline26]. The HBP Neuroinformatics Platform develops software tools and services that facilitate the process from data acquisition and annotation, through assignment of anatomical location to data, to assembly of and access to spatially indexed information about the brain. The examples below serve to illustrate data integration through the use of rodent brain reference atlases and HBP tools.
3. Examples of spatial data integration
Registration of experimental data to a reference atlas requires informatics tools and well defined procedures. Such tools and procedures are currently being established in the HBP Neuroinformatics Platform. We here provide examples illustrating different aspects of the challenges involved and the opportunities emerging, following registration of data to the common frameworks represented by the reference atlases (Figs. 3–5; for overview of ongoing rodent atlasing developments in HBP, see [Reference Bjerke, Øvsthus, Andersson, Bjaalie and Leergaard27–Reference Coello, Leergaard and Bjaalie32]). The challenges involved are primarily related to the ability to efficiently and accurately position large series of images in reference atlas space. The opportunities are manifold and include: (1) the creation of cut planes of the reference atlas that can be shown as overlays on 2D experimental images at any angle of orientation [Reference Puchades, Csucs, Checinska, Øvsthus, Bjerke and Andersson28]; (2) the assignation of reference atlas coordinates to features observed or extracted using image processing (Figs. 3 and 4); (3) the ability to analyze the distribution of features in atlas space or according to atlas structures (Figs. 3–5); and (4) the ability to search for other available information based on location of interest in atlas space or according to atlas structures (Fig. 5).
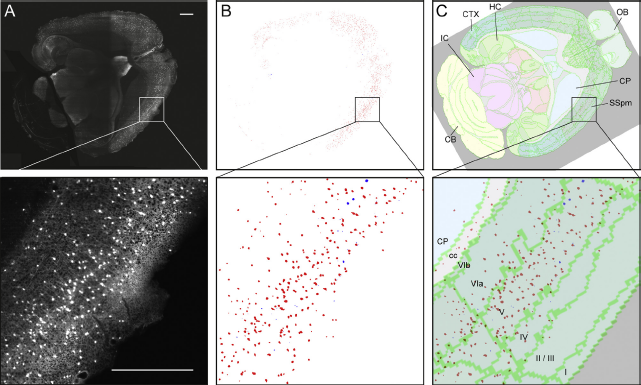
Fig. 3 From labeled features to data points in atlas space.
(A) Somatostatin positive neurons in the mouse brain labeled with fluorescent protein tdTomato visualized using confocal light sheet microscopy [Reference Silvestri, Bria, Costantini, Sacconi, Peng and Iannello33]. (B) Labeled features were extracted using the machine learning software tool ilastik [Reference Kreshuk, Koethe, Pax, Bock and Hamprecht35, Reference Haubold, Schiegg, Kreshuk, Berg, Koethe, Hamprecht, De Vos, Munck and Timmermans36]. (C) The anatomical location of labeling across an area of the cerebral cortex and its layers was determined by spatially registering the image data to the Allen Mouse Brain Atlas. Cortical layers are indicated in the magnified image. Scale bars: 1 mm. (Material from animal experiments designed in accordance with Italian laws and approved by the Italian Minister of Health, authorization no. 790/2016-PR). Abbreviations: CB, cerebellum; cc, corpus callosum; CP, caudoputamen; CTX, cortex; HC, hippocampus; IC, inferior colliculus; SSpm, primary somatosensory cortex, mouth area; OB, olfactory bulb.
The examples shown in Figs. 3 and 4 are centered on whole brain mapping of categories of neurons or other labeling features in mouse brain. Fig. 3 shows a dataset acquired with high-resolution light sheet microscopy following tissue clearing [Reference Silvestri, Bria, Costantini, Sacconi, Peng and Iannello33]. The resulting 3D dataset was initially globally registered to the Allen Mouse Brain Atlas, before a local registration procedure centered on a region of the cerebral cortex to increase the precision of the positioning. For both steps, affine transformations were used. Registration could be further improved by introducing non-linear transformations. Coupled with automatic cell localization algorithms [Reference Silvestri, Paciscopi, Soda, Biamonte, Iannello and Frasconi34], the approach allows efficient whole-brain mapping of neuronal distributions, yielding quantitative information about neuronal densities, numbers, and spatial distributions, normalized to reference atlas space. Such detailed quantitative data allow comparisons among parts of the brain, and between brains from different subjects, at a high level of granularity, and may in combination with other data be used to make inferences about functional properties of brain regions, to feed computational models of brain systems, or to monitor changes occurring in models of aging and disease.
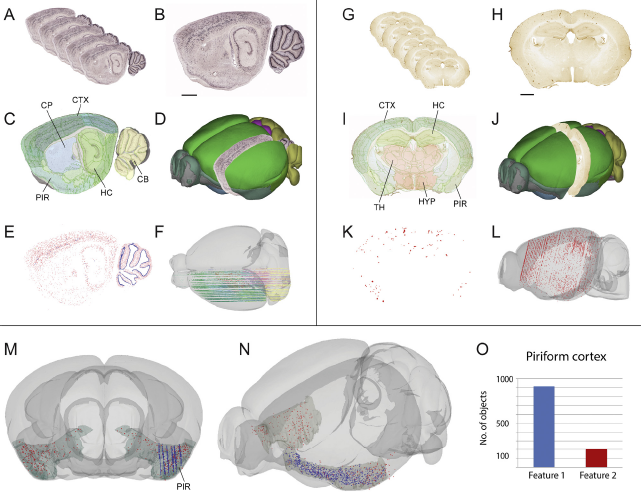
Fig. 4 From brain images to spatially integrated numbers.
Illustration showing spatial integration of data extracted from different serial images cut at different planes of orientation. (A–F) Series of microscopic images showing distribution of parvalbumin mRNA using in-situ hybridization [Reference Lein, Hawrylycz, Ao, Ayres, Bensinger and Bernard15, 47]. (G–L) Series of microscopic images showing distribution of amyloid plaque primarily in cerebral cortex and hippocampus, in the Tg2576 model for Alzheimer disease, visualized by immunohistochemistry [Reference Puchades, Csucs, Checinska, Øvsthus, Bjerke and Andersson28]. The images show serial histological sections cut in sagittal (A and B) and coronal (G–H) planes, that are spatially registered to the Allen Mouse Brain Atlas (C and D, and I and J). Labeled features of interest are extracted using the machine learning software tool ilastik [35,36] (E and K). The extracted features can then be represented by centroid point coordinates that can be displayed in 3-D atlas space (F and L). These spatially integrated data points can be co-displayed in specific atlas regions of interest (M and N), and numbers of objects can be extracted and compared at the level of atlas regions (O), in this example the left piriform cortex. This approach allows for the combined analysis of data that would otherwise be difficult to compare due to different cutting planes. Scale bars: 1 mm. (Material in G-L provided by M. Hartlage-Rübsamen and S. Rossner; animal experiments approved by Landesdirektion Sachsen, license no T28/16.) Abbreviations: CB, cerebellum; CP, caudoputamen; CTX, cortex; HC, hippocampus; HYP, hypothalamus; PIR, piriform cortex; TH, thalamus.
The two datasets shown in Fig. 4 are series of 2D microscopic images from histological sections processed to visualize different features in the mouse brain. The first represents a sagittally oriented series of sections from a normal brain (Fig. 4A–F), whereas the other represents a near coronal series of sections from a disease model (Fig. 4G–L). Both datasets are registered to the Allen Mouse Brain Atlas using affine transformations. The angle of sectioning of each of the series was precisely defined as part of the registration process, resulting in a good fit to the atlas. By registering the images to a common reference atlas, the anatomical location of features of interest were derived from the atlas overlay images and described either semantically (referring to names of structures), or defined by spatial atlas coordinates. Following image processing applied to the images in a batch process, labeled objects were extracted from image background and quantified [Reference Papp, Leergaard, Csucs and Bjaalie23, Reference Bjaalie31, Reference Kreshuk, Koethe, Pax, Bock and Hamprecht35, Reference Haubold, Schiegg, Kreshuk, Berg, Koethe, Hamprecht, De Vos, Munck and Timmermans36]. By automatic assignation of an atlas coordinate to each centroid point, the labeled features were co-visualized and quantified in context of atlas regions (Fig. 4). The quantitative distributions observed in this example are well suited for comparing densities and number of identified features in each atlas-defined region of the brain (plaques in the disease model as shown in Fig. 4G–L, and labeled neurons as shown in Fig. 4A–F). The data obtained are suitable for integration with other categories of data available in the same common atlas space, aiming at improved understanding of organizing principles in the brain or changes occurring in disease.
Fig. 5 is an example showing the determination of anatomical position of electrodes (i.e., tetrodes) in the rat brain by registration of histological sections to a reference atlas. In a series of experimental animals, craniotomy was performed and recording tetrodes were lowered into the brain (Fig. 5A) at locations stereotaxically measured from the bregma landmark of the skull (Fig. 2; [Reference Vinck, Bos, Van Mourik-Donga, Oplaat, Klein and Jackson37, Reference Bos, Vinck, van Mourik-Donga, Jackson, Witter and Pennartz38]). The tetrodes were targeted at the same area. Following implantation, rats performed a behavioral task taxing their perceptual and memory capacities of the neural system under scrutiny. The locations of the tetrode tips were verified by registration of section images from the brains of the animals to the Waxholm Space rat brain atlas. Tetrode tip locations could be identified in the section images and could thereby be located in atlas space (Fig. 5D). Thereby, the exact anatomical locations for each of the recording sites were determined as defined by anatomical area and atlas coordinates. The results show that the recording sites are positioned in or close to different subregions of the perirhinal cortex (Fig. 5E), which is relevant for interpretation of the electrophysiological results. This example also highlights the opportunity for accessing other types of information available for the areas in which the recording sites were located. Thus, an online database linked to the different atlas regions was searched to extract information about the known anatomical connections of the regions of interest. In our example we consulted the Temporal-lobe.com database, which holds a comprehensive collection of literature-derived data about the neural connections of the rat hippocampal system [Reference van Strien, Cappaert and Witter39, Reference Amunts, Ebell, Muller, Telefont, Knoll and Lippert40]. The query revealed that the two subregions (areas) of the perirhinal cortex, in which the recording sites were located, have different sets of afferent and efferent connections (Fig. 5F). This allows us to associate the electrophysiological characteristics and behavioral correlates of cells with their anatomic locations in two perirhinal areas and the networks in which they are embedded. The example thus illustrates how mapping of data to a common reference space facilitates data interpretation. Many data categories from the brain, including neural connectivity data, can only be interpreted correctly if the spatial location is known. A further approach, which is also pursued in the Human Brain Project because it cannot be realized in humans, is to combine intracellular patch clamp recordings in vivo with single-cell staining and 2-photon targeted recordings from identified cellular phenotypes –enabling the coupling of single-cell morphology, functional electrophysiology and brain atlasing (see, e.g., [Reference Perrenoud, Pennartz and Gentet41]). Finally, these functional-anatomic data are being used in computational modelling and simulation projects of HBP. In the example shown in Fig. 5 the data serve to specify models of multisensory integration and memory processing in sensory cortices and the medial temporal lobe system.

Fig. 5 Integration of the positioning of tetrode recording sites in a common reference atlas.
(A) 3D visualization of tetrode insertion site on the neocortical surface of a rat brain. (B and C) Visualization of the rat brain (Waxholm Space rat brain atlas) cut coronally at the position of the tetrode tip. The red dot indicates the location of the recording site. (D and E) Location of ten recording sites (colored dots), all registered to the Waxholm Space rat brain atlas, based on images of histological sections showing the location of the tetrode tips (a tetrode is a microbundle of 4 individual electrode wires; for information about the experiments and original recordings see [Reference Vinck, Bos, Van Mourik-Donga, Oplaat, Klein and Jackson37, Reference Bos, Vinck, van Mourik-Donga, Jackson, Witter and Pennartz38]). The visualization of the integrated data shows that the recording sites are distributed across perirhinal area 35 (dark purple) and area 36 (purple), as well as outside these areas. (F) Table showing afferent and efferent projections of perirhinal areas 35 and 36. Location parameters were used to look up information about the neural connections of the perirhinal cortex in a database holding information about connectivity in the rat hippocampal system (Temporal-lobe.com; [Reference van Strien, Cappaert and Witter39]). This reveals that the two perirhinal areas have different afferent and efferent connections. Abbreviations: A29c, retrosplenial cortex area 29c; A30, retrosplenial cortex area 30; A35, perirhinal cortex, agranular area 35; A36, perirhinal cortex, dysgranular area 36; CA1, cornu ammonis 1; CA3, cornu ammonis 3; Cingulate, cingulate cortex; DG, dentate gyrus; EC, entorhinal cortex; LEA, lateral entorhinal area; MEA, medial entorhinal area; PaS, parasubiculum; PER, perirhinal cortex.
4. Conclusion
The Human Brain Project introduces a systematic use of reference atlases as one of several ways to integrate neuroscience research data. A suite of neuroinformatics tools are currently being developed and shared with the research community, aimed at facilitating the multiple steps involved in data integration through the use of the reference atlases. In addition to the efforts here described for the rodent brain, the project uses and extends reference atlases for the human brain, including the BigBrain [Reference Amunts, Lepage, Borgeat, Mohlberg, Dickscheid and Rousseau42]. Furthermore, advanced tools are developed to support the spatially more complicated task of organizing research data for the human brain (see, e.g. [Reference Mangin, Lebenberg, Lefranc, Labra, Auzias and Labit43]).
Brain atlasing is equally relevant for organizing research data from the healthy and the diseased brain. By registering large amounts of heterogeneous neuroscience data to a common brain reference atlas, and making the images available for inspection and analysis in web-based viewer tools, the Human Brain Project will provide new opportunities for the use of data from normal specimens as benchmarks for interpretation of disease related changes in patients or animal models. One of these opportunities is to pinpoint electrophysiologically characterized neuronal populations to subregions with unprecedented anatomic resolution. Secondly, having characterized the location of neuropathology in a disease specimen, the atlas based infrastructure will allow researchers to look up information that is spatially relevant to the regions of interest, which may facilitate the interpretation of findings and assist in the planning of new experiments. The new infrastructure and procedures will likely also contribute to increased precision of the phenotypic characterization of rodent disease models (see, e.g., [Reference Jones, Watson and Fone44, 45]) and enable comparisons across models.
Brain atlasing is one of several components of the HBP Neuroinformatics Platform (www.humanbrainproject.eu; see, Explore the brain). The platform organizes data from the HBP, in addition to incorporating data from other sources. The tools and services currently being launched will be openly available to the research community. The platform will provide new opportunities for discovery based research through the use of spatial data integration as well as other neuroinformatics approaches tailored for different categories of data.
We envision that this brain atlasing-based approach to data integration will facilitate a new direction for neuroscience research, where data to a larger degree are shared and re-used to generate new knowledge and improve our understanding of the brain.
Acknowledgements
We thank Christopher Coello, Gergely Csucs, Dmitri Darine, and Hong Qu for expert technical assistance, Antonino Paolo Di Giovanna and Giacomo Mazzamuto for help in preparing experimental data used in Fig. 3, and Martin Vinck, Jeroen Bos, and Sven van der Burg for help in providing the experimental data used in Fig. 5. Material from the transgenic Alzheimer disease mouse model (Fig. 4) was contributed by Maike Hartlage-Rübsamen and Steffen Rossner (Paul-Flechsig-Institute for Brain Research, University of Leipzig, Germany). Funded by the European Union‘s Horizon 2020 Research and Innovation Programme under Grant Agreement No. 720270 (HBP SGA1) and The Research Council of Norway under Grant Agreement No. 269774 (INCF).


 Open access
Comments
No Comments have been published for this article.