

The status quo cannot continue. Retiring backward energy generation and containing production overcapacity are fundamental measures to tackle air pollution and critical means to transform and upgrade [the energy system of] Hebei.
You smashed our jobs, our finances, and our way of life for your own official post!
Given that political regulation waves exist, what difference do they make? A prosperous economy and a safe and stable living environment are the hallmarks of an ideal society. However, achieving economic progress often involves unfettered pollution, especially when a society is still in its developmental stage. Deterioration in health, reduced survival rates, and a decline in well-being are the consequences of air pollution, meaning that the political pollution wave can entail tremendous human costs. On the other hand, aggressive and heavy-handed pollution regulation can stymie growth and kill jobs and reduce the material well-being of individuals, even though the improved air quality is conducive to health and longevity. The political environmental protection wave, then, can also incur vast social costs despite significant social benefits.
This chapter evaluates the normative significance of and the difficult tradeoffs entailed in the political regulation wave. Specifically, I will measure PM2.5-induced mortality changes due to the existence of political regulation waves and use qualitative evidence to highlight the social benefits and costs of this phenomenon. In one form or another, I contend that the political regulation wave presents tough tradeoffs for decision-makers.
6.1 The Tradeoffs of the Political Pollution Wave
6.1.1 Competent Leaders, Booming Economy, and Jobs
Historically, people have seen pollution as a sign of prosperity. In the USA, which has typically been obsessed with growth, air pollution was often perceived as a symbol of economic progress rather than a silent and invisible killer. The story of Donora, a town about twenty miles south of Pittsburgh, Pennsylvania, exemplifies this. In the early twentieth century, Donora residents mainly relied on two industrial plants for a living. Billowing smoke was considered a sign of progress and prosperity, whereas blue skies often accompanied economic depression and unemployment. In October 1948, Donora was infamously besieged by a smog so dense and poisonous that it killed at least twenty people. In the decade following the incident, higher rates of cardiovascular disease and cancer were still observed in the region. The Donora pollution event resulted in the first large-scale environmental health investigation in US history; the disaster changed the face of environmental protection in the USA forever.
Halfway across the globe, Mao Zedong remarked, while gazing out of Tiananmen in 1949 (the year of the founding of the People’s Republic), “I hope the day will come when all you can see from Tiananmen is a forest of tall chimneys belching out clouds of smoke” (Reference ShapiroShapiro 2001). As with many of his acts in life, Mao worked aggressively and ruthlessly toward achieving that goal, and he quickly translated his simplistic vision of humanity and nature into a reality – irreversible destruction to nature in the name of modernization of the country’s means of production (Reference ShapiroShapiro 2001).
Mao’s produce-and-pollute thinking indeed outlived him. Until about a decade ago, leaders’ competence was judged primarily on the basis of their ability to galvanize political and economic progress, often embodied by the development of highly visible forms of infrastructure projects – and to do so quickly. That explains the vast ghost cities – urban clusters built for anticipated migration and development that never happened – that mushroomed in places as obscure as the Gobi Desert.
The produce-and-pollute growth model jibes well with another critical consideration for local leaders – employment and job stability for the residents in their jurisdiction. When pollution regulation is relaxed, factory owners can worry less about the frequency and strictness of inspection visits paid by EPB staff, who would otherwise require the halting of regular production. Since disruptions in operation would necessitate employees taking unpaid leave or getting laid off, worker protests become likely as they lose their most basic economic means. A local strategic leader would thus order bureaucratic regulatory forbearance to keep workers employed, especially when they anticipate a career rotation.
6.1.2 Who Lives, Who Dies, Who Tells Your Story?
China’s seemingly impressive economic and employment figures tell stories of local leaders capable of moving heaven and earth to deliver political achievements and economic prosperity in their short time as the first-in-command. Though this may earn some leaders a positive reputation and favorable career evaluation, it may be accompanied by significant costs. When regulatory stringency is relaxed, polluters can opt for cheaper, dirtier fuels, or simply not operate their expensive pollution treatment facilities. The environmental consequence is more pollution per unit of economic output.
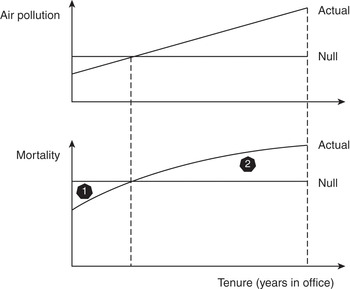
To make a very conservative estimate about the human costs of the political pollution wave, I will first describe the theoretical setup and then calculate additional short-term mortality due to the pollution wave under one counterfactual scenario. The theoretical setup is laid out in Figure 6.1, where the upper plot shows the expected air pollution levels under two scenarios, and the lower plot demonstrates the corresponding mortality levels. The scenarios consist of the actual scenario, where there is a tenure of a usually short duration and an expected improvement in (reported) economic progress and stability maintenance across the tenure, and the null scenario, where either a tenure does not exist or a tenure exists but every year’s performance is perceived by the local leader to be weighted equally by their superior. The area under the “Null” line denotes mortality in the null scenario, while that under the “Actual” line denotes mortality in the actual scenario. The additional mortality induced by a leader’s tenure is the difference between areas 2 and 1. Depending on the relative positioning of the air pollution level under the null scenario, the difference can be positive, zero, or negative.
To demonstrate the setup with real numbers, I seek to create a counterfactual situation without political tenures or with incentives to implement policies consistently. Since local leaders of all regions are subject to career incentives, I want to create a situation with minimal tenure-induced incentives. Since the pull of such career incentives is relatively weak early on and in the last year of tenure air pollution is on average the highest throughout the tenure, ceteris paribus, I thus calculate a model-based estimation of the last year’s PM2.5 level, which averages all previous years’ levels during the tenure. To estimate this, I run the following regression. The last year here refers to the actual last year in office.
 (6.1)
(6.1)
From the regression Eq. (6.1), I know that the average effect on
 during the last year in office is
 g/m3. Since in the counterfactual situation the air pollution level in the last year is seen as the average of those in non-last years, the difference in
 between the real and the counterfactual scenarios would be
 g/m3 in the last year in office.
I then calculate the net increase in mortality due to political tenure-induced PM2.5, which provides some perspective on the social costs and the normative significance of political pollution waves. Health effect rate (in this case, deaths/yr), y can be quantified using Eq. (6.2):
 (6.2)
(6.2)
where y0 is the all-cause death rate; x is the average concentration of the pollutant;
 is the threshold concentration below which no health effect occurs;
 is the fractional increase in the risk of death per unit of
 ; P is the population.Footnote 33 For PM2.5,
 . For the population, I add up population figures for individual provinces in 2005 for the 2000–10 period and sum up 2015 population figures for the 2013–17 period. The results are shown in Table 6.1.
Table 6.1 Premature deaths due to tenure-induced PM2.5 emissions based on satellite-derived measures in the last year in office
| Sample | Period | Expected mortality | Additional mortality | Percentage increase (%) |
|---|---|---|---|---|
| All prefectures | 2000–10 | 1,903,120 | 7,936 | 0.42 |
| Prefectures in Guizhou Province | 48,698 | 906 | 1.86 | |
| Prefectures not under PM2.5 policy | 2013–17 | 1,275,302 | 4,311 | 0.34 |
For an average prefectural party secretary in the dataset during 2000–10, the last year in office was associated with a 0.42 percent increase in mortality from the increase in PM2.5 alone. For prefectures in Guizhou Province, the increase reaches almost 2 percent. Guizhou stands out because it experienced the strongest political pollution wave. Economically, it ranks in the lower half of all provinces. Politically, it is often seen as a stepping-stone for local leaders to make it to the center. The incentive to signal competence by promoting regulatory forbearance is, as a result, very strong and, by extension, the percentage increase in mortality from additional PM2.5 in the leader’s last year is the highest. During 2013–17, prefectures not under the PM2.5 control policy experienced a 0.34 percent increase in mortality in the actual last year in office from the increase in PM2.5 alone.
Given that, in many localities in China, the primary source of PM2.5 is coal burning, the emissions of excessive SO2 and the synergistic effects between PM2.5 and SO2 can also cause additional deaths.Footnote 34 Furthermore, the peak in pollution often happened in the last year of office, as strategic leaders gradually dialed down pollution regulation and, by extension, increased air pollution. Comparing pollution levels in the last year with the average pollution levels in non-last years is likely to produce a downwardly biased estimation of the effect of political tenure and, by extension, incentives to create local regulatory policy waves. Given all this, the mortality figures here plausibly represent an underestimation of premature deaths owing to regulatory forbearance toward the end of a political leader’s tenure.
In addition to its deleterious effects in terms of a higher incidence of premature deaths, exposure to more air pollution in the short term leads to higher risks of hospitalization, which is physically, emotionally, and financially taxing. Exposure to air pollution can also create long-term health consequences, such as a shortened lifespan and heightened susceptibility to respiratory and cardiovascular diseases. That is very bad news, especially with the emergence and persistence of the deadly COVID-19 global pandemic. Those with lungs and hearts damaged by air pollution are made more vulnerable to dying from a COVID-19 infection (Reference Wu, Nethery, Sabath, Braun and DominiciWu et al. 2020; Reference Austin, Carattini, Mahecha and PeskoAustin et al. 2020; Reference Persico and JohnsonPersico and Johnson 2020).
Moreover, the burdens of political pollution waves are not equally distributed among different groups of people. By age, the very young and the very old are particularly vulnerable groups (Reference Tian, Liu, Liang, Xiang, Li, Juan and SongTian et al. 2018). By socioeconomic status, an inverted U-shaped relationship has been observed between the level of wealth and air pollution exposure (Reference Kopas, York, Jin, Harish, Kennedy, Shen and UrpelainenKopas et al. 2020). That can be explained by the relatively poor having higher physical exposure from working in and living close to highly polluting industries. Thus, the political pollution wave’s human costs can be particularly significant for poor seniors and poor children.
6.2 The Tradeoffs of the Political Environmental Protection Wave
6.2.1 Making a Blue Sky
Although some challenge the notion that Beijing’s regulatory programs to curb pollution have worked – and add that their results have not been uniform cross regionally – the benefits of these policies have started to become visible. From the last quarter of 2017, for instance, some cities, including Beijing, saw marked improvement in air quality compared to the previous year (Reference PhillipsPhillips 2018). Beijing’s PM2.5 levels dropped by over 50 percent in the fourth quarter of 2017 compared to a year earlier, with the 2017 annual national average PM2.5 level reportedly dropping by 4.5 percent compared to a year earlier (Greenpeace East Asia 2018). The number of “heavy pollution days” fell from 58 in 2013 to 23 in 2017, while the number of “good” air quality days rose to a record 226 in the same year (Reference PhillipsPhillips 2018).
The benefits did not go unnoticed. The thick, dusty layer of smog that had become an unfortunate hallmark of Beijing’s environment no longer hung over the city throughout most of the year, as it had in years past. Zou Yi, a photographer based in Beijing, noticed how the smog had cleared and turned the sky unusually blue, making it feel as though “life has returned to the city” (Reference WangWang 2018). Older photographs of the city’s grainy, shrouded skyline throw into sharp relief more recent images of the city against a backdrop of a clear blue sky and tendrils of white clouds. The shift must have been a much-needed respite for citizens who had grown accustomed to living in a city often engulfed by heavy smog, which, on particularly bad days, had triggered health scares and forced the closure of schools and cancellation of flights (Reference McCannMcCann 2016).
The visual benefits of the seemingly more consistent implementation of environmental regulations and improved air quality only scratch the surface of the benefits provided by cleaner air. As the air cleans up, public health also improves. That has been the case in the USA with its efforts to clean up its air: the EPA reports that the changes in air pollution levels engendered by the Clean Air Act between 1990 and 2010 led to numerous health benefits, such as reduced adult mortality and decreased cases of chronic bronchitis, asthma exacerbation, and other health conditions (US EPA 2011). In 1990 alone, the improved air quality is estimated to have saved 160,000 adult lives from PM2.5-induced mortality.
What does the evidence say about how air pollution control programs have affected health outcomes in China? With binding targets and timelines established by the Clean Air Action Plan, local leaders after 2010 were incentivized to regulate PM pollution. It became easier to breathe. One estimate suggests that compared to the 2013 level, air quality improvements in seventy-four major prefectures in 2017 saved about fifty thousand lives (Reference Huang, Pan, Guo and Li.Huang et al. 2018). Officially reported concentrations data suggest more consistent regulation of PM2.5 in prefectures mandated for reductions under the Clean Air Action Plan, though satellite-based data do not indicate there to have been statistically significant “dampened” pollution waves.
The primary benefit of a political environmental protection wave is likely a drop in mortality. Following a similar approach detailed in the previous section, I find that the avoided premature deaths from PM2.5 pollution alone is 3,750 (0.49 percent decrease) for prefectures treated for PM2.5 reduction binding targets (Table 6.2). It is worth noting that PM2.5 levels overall decreased significantly after 2012, in addition to being regulated more consistently over time during a given tenure. If we account for the overall lowered PM2.5 level in addition to a flattened, over-time trend, the avoided mortality figure should be even larger.
Table 6.2 Avoided premature deaths due to tenure-induced PM2.5 emissions based on satellite-derived measures in the last year in office
| Sample | Period | Expected mortality | Reduced mortality | Percentage decrease (%) |
|---|---|---|---|---|
| Prefectures under PM2.5 policy | 2013–17 | 769,704 | 3,750 | 0.49 |
6.2.2 The Price You Pay
The benefit of reduced mortality delivered by a political environmental protection wave came with great costs. Aggressive regulation of air pollution carries at least three unintended social ramifications: (1) slowed growth and economic loss; (2) exacerbated unemployment; and (3) a drastic decline in quality of life despite improved air quality.
During the first two years of the Clean Air Action Plan (2013–15), regulation is estimated to have reduced the manufacturing output in the Jing-Jin-Ji region by 6.7 percent. The losses could sum up to RMB 408.7 billion (2013 price level), equivalent to 6.5 percent of regional GDP in 2013. For the Jing-Jin-Ji region, problems with slowed growth were concentrated in Hebei and Tianjin but not Beijing. Hebei suffered losses of RMB 280.1 billion (2013 price level), equal to 9.8 percent of its GDP in 2013, and Tianjin suffered losses of RMB 133.1 billion (2013 price level), equal to 9.2 percent of its GDP in 2013 (Reference Li, Qiao and ShiLi, Qiao, and Shi 2019).
Both heavy-handed implementation of regulation and the coal-to-gas initiative particularly have had a significant impact on economic growth and personal well-being. To meet aggressive PM2.5 reduction goals by 2017, the central and local governments coordinated to order a rapid shutdown of violating firms, leading to job losses, a rise in the cost of living, and an economic slowdown. The year 2017 saw the “toughest ever” restrictions on the industry in China (Reference DongDong 2017). The initial targets were large-scale and state-owned coal-fired power plants. The costs of shutting down coal-fired power plants were enormous. The shutting down for five days of the Huarun Electric Power in Heze, Shandong Province, which consumed 1.9 million tons of coal per year, resulted in an estimated loss of RMB 100 million, which is equivalent to about USD 15 million (National Business Daily 2017). Hundreds to thousands of workers were temporarily put out of work in the process. From November 2017 to March 2018, key cities, including Shijiazhuang, Tangshan, Handan, and Anyang had to cut their steel manufacturing output by 50 percent and aluminum production by 30 percent (Reference FengFeng 2018).
According to Huarun’s representative, who was very unhappy about the mandated shutdown of his facilities amid regulation applied with blunt force, complained that his plants were implementing rigorous emissions control, which should exempt the factory from being listed as a “heavy polluter.” In fact, to continue providing electricity to its users, the company had to transfer electric power from smaller, nonlisted coal-fired power plants that had not yet implemented emissions control. As a result, overall emissions possibly increased due to such irrational blunt-force regulation. Officials at other SOEs have reiterated the complaint that the government has a tighter grip over SOEs than private firms, where the former followed official rules to shutter blast furnaces while the latter – often less efficient and lacking pollutant scrubbers – were left intact (Fan and Wang 2017). “What was advanced got knocked out, and what was outdated was preserved,” one official remarked (Fan and Wang 2017). Further evidence suggests that actions to generate rapid – if transitory – results spurred steel producers to accelerate production before and after downtimes, leading to even more extreme pollution than would have been produced otherwise (Fan and Wang 2017).
The government later targeted small-scale firms. In April 2018, the MEE began a six-month process of environmental inspections across twenty-eight cities in Jing-Jin-Ji. Authorities focused on “small-scale companies violating zoning rules,” with more than half of the forty thousand targeted firms found to be in violation of environmental standards (Reference Huang and LahiriHuang and Lahiri 2018). Punishments included the suspension of operation, loss of equipment, cutting off electricity and water supply, and, in extreme cases, the explosion of entire factory premises. These regulatory actions hit the ceramic industry particularly hard. In Zibo, Shandong Province, 150 of the 300 ceramic companies were closed, with capacity slashed by 70 percent. Prices have soared as a result (Reference Huang and LahiriHuang and Lahiri 2018).
The industrial losses aside, the swift quest for a cleaner environment has imposed considerable costs on people, as is particularly evident in the country’s struggle to transition residential and commercial heating from coal to natural gas. China burns about three hundred million metric tons of coal for heating annually, which is about 7 percent of the country’s total consumption (Reference Huang and LahiriHuang and Lahiri 2018). In 2017, four million homes, businesses, and schools were ordered to shut down coal-fired stoves and boilers and switch to natural gas (Reference BradsherBradsher 2017). Local officials led the dismantling and removal of large numbers of coal-fired devices themselves. The goal of this campaign was to reduce air pollution by 15 percent in the Jing-Jin-Ji region in hopes of preventing a repeat of an “airpocalypse.” In Taiyuan, Shanxi Province, local officials noted that the sale, transport, and burning of coal would be banned entirely for individuals and companies. This was aimed at reducing coal usage in this specific locality by two million metric tons, about 90 percent of the city’s total consumption (population around three million). 134,000 households across 336 villages were projected to switch to natural gas usage (Reference HuangHuang 2017).
In China’s coal country, Shanxi Province, the sudden shift to natural gas for winter heating did not bode well for the residents (Reference MyersMyers 2018). Many coal stoves were removed before new natural gas furnaces were put in place, leaving tens of thousands of residents in the cold. In areas with furnaces, a sudden surge in demand for natural gas overwhelmed supplies, pushed up prices, and created shortages. In Hebei province, which abuts Beijing, school children had their lessons outside in the yards because it was warmer under the sun than in their freezing classrooms (China Daily 2017).
A natural gas shortage beginning in 2017 has contributed to crises nationwide. China consumes more natural gas than it produces and imports the difference (Reference LiLi 2017). China depends on imports for about 39 percent of its natural gas supply, and the demand for gas has outstripped its supply. The trade war with the USA has aggravated this shortage: in July 2018, the United States sold only 130,000 tons of liquified natural gas to China, down 400,000 from May 2018. Negotiations for a Russia-China gas pipeline have also been halted (Reference FengFeng 2018). In response, in May 2018, the NDRC announced that they would permit a 20 percent increase in the cost of gas for domestic use. In Beijing, compressed natural gas prices surged 65 percent by November of that year (Reference BradsherBradsher 2017). Government subsidies in Beijing have made the cost of burning natural gas equal with coal, but these subsidies have not been as generous in rural regions. Hebei has been cited as a neglected region where residents have been forced to switch to natural gas without the luxury of substantial government aid, which together with industrial shutdowns to preserve natural gas led to significant financial strain on workers in rural regions (Reference FengFeng 2018).
These anecdotes are just the tip of the iceberg in terms of the impacts of heavy-handed regulation, which quickly became a convenient means of achieving improvement in air quality. Countless workers who were breadwinners for their households faced unemployment, were left unable to pay off housing and car mortgages, and found their families’ livelihoods threatened. The political environmental regulation wave phenomenon is almost trapped in a “one step forward, two steps back” scenario in terms of human well-being.
6.3 Conclusion
This chapter has assessed the normative implications of and the hard tradeoffs entailed by the political regulation wave. I demonstrate, both via quantitative estimation and qualitative case descriptions, why having the political regulation wave can deliver social benefits while also imposing significant social costs. When regulation is relaxed, the economy and employment benefit but more pollution results, causing more deaths and threatening human well-being. Strategic local leaders are rewarded for their competency in delivering political and economic achievements during their usually short tenure. When local leaders seek to move up the political hierarchy by strengthening the implementation of regulations in pursuit of blue skies, air quality improves but firms suffer profit losses and many people lose their jobs and are forced to spend brutal winters without heating. One form of the political regulation wave is not entirely better than the other. These are hard tradeoffs.
With these findings in mind, we turn to the final chapter to summarize the results on how political incentives shape bureaucratic policy implementation and to discuss their implications. I will argue that while the book uses China as the primary testing ground, the political regulation wave theory applies to other countries under scope conditions. I will also discuss new insights into local governance and political accountability in autocracies and democracies alike.


 Open access