


Introduction
Conodonts are extinct, eel-shaped marine animals that lived from the mid-Cambrian to Early Jurassic (Du et al. Reference Du, Chiari, Karádi, Nicora, Onoue, Pálfy, Roghi, Tomimatsu and Rigo2020). They are early vertebrates, either stem-gnathostomes (Donoghue et al. Reference Donoghue, Purnell and Aldridge1998) or stem-cyclostomes (Miyashita et al. Reference Miyashita, Coates, Farrar, Larson, Manning, Wogelius, Edwards, Anné, Bergmann, Richard Palmer and Currie2019), and they are distinguished by an extensive fossil record (Foote and Sepkoski Reference Foote and Sepkoski1999; Donoghue Reference Donoghue2001b). The majority of the conodont fossil record consists of the phosphatic elements forming the feeding apparatus of the animal (Schmidt Reference Schmidt1934; Scott Reference Scott1934; Purnell et al. Reference Purnell, Donoghue and Aldridge2000). Conodont elements were retained throughout the life of an individual (Donoghue and Purnell Reference Donoghue and Purnell1999a), recording periodic growth through the apposition of crown tissue lamellae (Zhang et al. Reference Zhang, Aldridge and Donoghue1997; Dzik Reference Dzik2008). Soft tissues are rarely found and have, so far, not revealed a great diversity of body forms. Conodont taxonomy and functional morphology are thus based on their feeding elements (for the Upper Triassic, see Mazza et al. Reference Mazza, Cau and Rigo2012a and references therein). Patterns interpreted to be produced by elements shearing on the surface and repaired during the animal's growth suggest macrophagy (Purnell Reference Purnell1995; Donoghue and Purnell Reference Donoghue and Purnell1999a; Shirley et al. Reference Shirley, Grohganz, Bestmann and Jarochowska2018). An active, predatory lifestyle is supported by the discovery of a conodont specimen with preserved extrinsic eye musculature (Gabbott et al. Reference Gabbott, Aldridge and Theron1995), which was interpreted as indicative of conodonts having pattern vision (Purnell Reference Purnell1994). Calcium isotope analyses indicated that Late Devonian conodonts were first-level zooplanktivore and piscivore consumers (Balter et al. Reference Balter, Martin, Tacail, Suan, Renaud and Girard2019), suggesting that in this period, conodonts did not live a purely predatory lifestyle. However, despite several publications related to this topic, the diet of conodonts and its evolution are far from resolved. Conodonts changed their apparatus structure and disparity across their stratigraphic range (Dzik Reference Dzik1991, Reference Dzik2015), possibly reflecting their evolving niches as marine ecosystems increased in complexity (Klug et al. Reference Klug, Kröger, Kiessling, Mullins, Servais, Fryda, Korn and Turner2010; Ginot and Goudemand Reference Ginot and Goudemand2019). Under the assumption that conodont element morphology is an adaptation to their diet (Jones et al. Reference Jones, Evans, Rayfield, Siu and Donoghue2012a; Ginot and Goudemand Reference Ginot and Goudemand2019; Guenser et al. Reference Guenser, Souquet, Dolédec, Mazza, Rigo and Goudemand2019; Petryshen et al. Reference Petryshen, Henderson, De Baets and Jarochowska2020), this disparity suggests changing trophic position throughout the existence of the lineage. Calcium isotope analysis indicated that trophic niches overlapped, suggesting competition between some taxa (Balter et al. Reference Balter, Martin, Tacail, Suan, Renaud and Girard2019). On the other hand, Sr/Ca ratios in Silurian conodont assemblages indicate differences between species (Terrill et al. Reference Terrill, Jarochowska, Henderson, Shirley and Bremer2022), possibly reflecting trophic niche differentiation through disruptive selection. Because there is no direct evidence of a conodont food base, trophic diversity of conodonts must be inferred from proxies, for example, by evaluating morphological and functional diversity of food-processing elements.
Here we revisit the test between two hypotheses on the function of conodont apparatus: the suspension-feeding model (Nicoll Reference Nicoll1985, Reference Nicoll and Aldridge1987) versus the grasping-tooth model (Aldridge et al. Reference Aldridge, Smith, Norby and Briggs1987; Purnell and von Bitter Reference Purnell and von Bitter1992). In the grasping-tooth model and its subsequent modifications, S and M elements, positioned in the anterior part of the mouth, are interpreted to perform a grasping function, whereas P elements, placed in the posterior part of the apparatus, in the pharynx of the animal, have a function similar to molars of mammals (Purnell and von Bitter Reference Purnell and von Bitter1992; Purnell Reference Purnell1994; Donoghue and Purnell Reference Donoghue and Purnell1999b; Goudemand et al. Reference Goudemand, Orchard, Urdy, Bucher and Tafforeau2011). In the suspension-feeding model by Nicoll (Reference Nicoll and Aldridge1987), elements would be covered in tissue, and S and M elements would filter particles and create current, whereas P elements would only lightly mash food. Several analytical methods have been proposed in favor of the grasping-tooth model: (1) observation of microwear patterns and damage of conodont elements, produced in vivo (Purnell Reference Purnell1995; Martínez-Pérez et al. Reference Martínez-Pérez, Rayfield, Purnell and Donoghue2014a; Shirley et al. Reference Shirley, Grohganz, Bestmann and Jarochowska2018); (2) occlusion models (Donoghue and Purnell Reference Donoghue and Purnell1999b; Jones et al. Reference Jones, Evans, Rayfield, Siu and Donoghue2012a; Martínez-Pérez et al. Reference Martínez-Pérez, Rayfield, Purnell and Donoghue2014a,Reference Martínez-Pérez, Plasencia, Jones, Kolar-Jurkovšek, Sha, Botella and Donoghueb); (3) finite element analysis (FEA) (Jones et al. Reference Jones, Evans, Siu, Rayfield and Donoghue2012b; Martínez-Pérez et al. Reference Martínez-Pérez, Rayfield, Purnell and Donoghue2014a, Reference Martínez-Pérez, Rayfield, Botella and Donoghue2016); (4) histological adaptation (Donoghue Reference Donoghue2001a; Jones et al. Reference Jones, Evans, Rayfield, Siu and Donoghue2012a); and (5) growth allometry (Purnell Reference Purnell1993, Reference Purnell1994), which is central in this study.
Allometry describes proportional relationships of body parts, usually of the size of an organ relative to the total size of the organism. Proportional growth, whereby the growth of an organ and the size of the animal increase at the same rate, is called isometry. Positive allometry then describes the organ growing at a faster rate than the rest of the animal. Negative allometry, conversely, describes the organ growing at a slower rate than the rest of the body (e.g., Gould Reference Gould1966; Alberch et al. Reference Alberch, Gould, Oster and Wake1979; Klingenberg Reference Klingenberg, Marcus, Corti, Loy, Naylor and Slice1996). Methods of investigation listed in the previous paragraph have focused on elements termed “P1.” Those elements are typically the largest and the most robust in the apparatus and, thus, are inferred to have the most pronounced dental function. They also have the highest morphological evolutionary rate and, thus, present the most diverse shapes within the conodont apparatus. Among the possible P1 morphologies, some bear a platform, which is inferred to be a food-processing surface (Purnell Reference Purnell1995). Positive allometry of the platform area relative to the total length of the P1 element in Carboniferous taxa Idiognathodus sp. and Gnathodus bilineatus has been used in seminal studies by Purnell (Reference Purnell1993, Reference Purnell1994) to test between the two hypotheses on feeding in conodonts. The test used by Purnell (Reference Purnell1993, Reference Purnell1994) was devised based on the understanding of growth allometry at the time, which led to the following assumptions: (1) a tooth's ability to process food is proportional to its area; (2) any tooth linear dimension increases the same as any other tooth linear dimension (isometric slope = 1); (3) tooth area increases as the square of its linear dimensions (isometric slope = 2) or as its volume to the power of 0.67; (4) the animal's metabolic rate and thus its energy requirements increase as its volume to the power of 0.75 (Gould Reference Gould1966, Reference Gould1975). Based on these assumptions, the dental function of P1 conodont elements, analogous to molar teeth in mammals, should manifest itself in positive allometry of the food-processing area versus the element's linear dimensions to meet the food requirements (Fig. 1).

Figure 1. Theoretical framework of the present study. Data from birds, mammals, reptiles, fishes, and amphibians were extracted from Glazier (Reference Glazier2009); dashed lines represent 95% confidence intervals; references for positive allometry from Purnell (Reference Purnell1994, Reference Purnell1995).
In the present study, we first apply the same allometric evaluation of P1 elements as used by Purnell (Reference Purnell1993, Reference Purnell1994) to two Late Triassic platform-bearing conodont species: Metapolygnathus communisti Hayashi, Reference Hayashi1968 and Epigondolella rigoi Kozur, 2007 (Noyan and Kozur Reference Noyan and Kozur2007). However, we also revisit assumption 3 (previous paragraph) based on the research progress since the original studies by Purnell (Reference Purnell1993, Reference Purnell1994) and examine the implications when they are violated (see “Discussion”). Assumption 3 is that tooth area can be approximated by a 2D surface, such as when analyzing photographs of teeth in a plane view. An alternative way of increasing the surface is introducing topography—a solution found in mammals (Santana et al. Reference Santana, Strait and Dumont2011; Pérez-Ramos et al. Reference Pérez-Ramos, Romero, Rodriguez and Figueirido2020). Conodonts have developed intricate topographies on the platform surface of their P1 elements, which would not be identified as increased areas when approximating the total area with an ellipse described by the element's linear dimensions (Purnell Reference Purnell1993, Reference Purnell1994). Therefore, here we use 3D meshes to calculate the 3D platform area and thus account for the topography. To evaluate the importance of dental topography in conodonts, we calculate Dirichlet normal energy (DNE), which measures the curvature and morphological irregularity of a surface. Essentially, DNE measures how much a given surface differs from a plane (Bunn et al. Reference Bunn, Boyer, Lipman, St. Clair, Jernvall and Daubechies2011). Surface topography is an important feature of teeth, because it helps break down food to satisfy the demand for energy (Bunn et al. Reference Bunn, Boyer, Lipman, St. Clair, Jernvall and Daubechies2011). Thus, a particular DNE value of the occlusal surface of a tooth (or tooth-like buccal elements in conodonts) should reflect a particular diet. However, DNE has, until now, been only used to analyze skeletal parts of mammals, especially primate teeth (Bunn et al. Reference Bunn, Boyer, Lipman, St. Clair, Jernvall and Daubechies2011; Godfrey et al. Reference Godfrey, Winchester, King, Boyer and Jernvall2012; Winchester et al. Reference Winchester, Boyer, St. Clair, Gosselin-Ildari, Cooke and Ledogar2014; Prufrock et al. Reference Prufrock, López-Torres, Silcox and Boyer2016; Berthaume and Schroer Reference Berthaume and Schroer2017; López-Torres et al. Reference López-Torres, Selig, Prufrock, Lin and Silcox2018; Pampush et al. Reference Pampush, Crowell, Karme, Macrae, Kay and Ungar2019; Fulwood Reference Fulwood2020; Li et al. Reference Li, Morse and Kay2020; Cuesta-Torralvo et al. Reference Cuesta-Torralvo, Pacheco, Martínez, Romero, Umbelino, Avià and Pérez-Pérez2021), but also those of marsupials (Lang et al. Reference Lang, Engler and Martin2022), carnivorans (hyenas, bears) (Pérez-Ramos et al. Reference Pérez-Ramos, Romero, Rodriguez and Figueirido2020; de Vries et al. Reference Vries, Heritage, Borths, Sallam and Seiffert2021; Lang et al. Reference Lang, Engler and Martin2022), scandentians (tree shrews) (Selig et al. Reference Selig, López-Torres, Sargis and Silcox2019), rodents (Prufrock et al. Reference Prufrock, López-Torres, Silcox and Boyer2016; Renaud and Ledevin Reference Renaud and Ledevin2017; Vermeer Reference Vermeer2019; de Vries et al. Reference Vries, Heritage, Borths, Sallam and Seiffert2021), chiropterans (Pellegrom Reference Pellegrom2019; López-Aguirre et al. Reference López-Aguirre, Hand, Simmons and Silcox2022; Villalobos-Chaves and Santana Reference Villalobos-Chaves and Santana2022), multituberculates (Robson Reference Robson2018), artiodactyls (suids) (Rannikko et al. Reference Rannikko, Adhikari, Karme, Žliobaitė and Fortelius2020), eulipotyphles (hedgehogs) (Vitek et al. Reference Vitek, Morse, Boyer, Strait and Bloch2021), and one mammal stem group (Harper et al. Reference Harper, Parras and Rougier2019). DNE is defined in such a way that it is independent of scale. Thus, any change in the linear dimensions of the animal might be interpreted as a functional change and not a scaling effect (Pampush et al. Reference Pampush, Morse, Fuselier, Skinner and Kay2022). DNE values for the platform surface of P1 elements have the potential to illuminate the diet of a conodont species. Preliminary dental topographic analyses, different from DNE, have been applied to conodont elements and suggested that conodonts might had different diets through their evolution (Purnell and Evans Reference Purnell and Evans2009; Stockey et al. Reference Stockey, Donoghue, Harvey, Murdock and Purnell2021, Reference Stockey, Donoghue, Harvey, Murdock and Purnell2022). These recent findings support the potential of dental topographic methods for resolving conodont diets, and DNE is a novel method to test functional hypotheses.
The aims of this study are to:
1. Test the null hypothesis of isometric growth against the alternative of positive allometric growth of P1 elements in a new set of taxa, to evaluate whether the relationship previously observed in Carboniferous taxa by Purnell (Reference Purnell1993, Reference Purnell1994) holds more widely in the class Conodonta.
2. Test the null hypothesis of an absence of relationship between DNE values of P1 platform surface and P1 element dimensions (i.e., element length, platform length, and platform area). If such a relationship exists, fitting the data with a power law allows us to discuss this relationship in light of the energy requirement of the animal.
3. Revise the assumption that the metabolic rate in conodonts increased faster with body mass than tooth area and evaluate how violation of this assumption would affect the outcome of the allometric analysis by Purnell (Reference Purnell1993, Reference Purnell1994) and carried out here.
4. Test the hypothesis that differential morphologies in P1 elements of the co-occurring taxa M. communisti and E. rigoi reflect different food bases within the ecosystem by comparing DNE values between P1 platform surfaces in adult specimens.
Materials and Methods
Material
We studied two growth series of the ozarkodinid conodont species Metapolygnathus communisti and Epigondolella rigoi from the Pizzo Mondello section in western Sicily, Italy. They were collected from a section of 430-m-thick marine limestone dated to the upper Carnian to upper Norian (Mazza et al. Reference Mazza, Rigo and Gullo2012b). Twenty-seven P1 elements of M. communisti and 23 P1 elements of E. rigoi were used, separated into six growth stages (GS) based on the maturity of the morphological characters of the platform (Mazza and Martínez-Pérez Reference Mazza and Martínez-Pérez2015). The six growth stages are GS1: early juvenile; GS2: juvenile; GS3: late juvenile; GS4: early adult; GS5: adult; and GS6: late adult (Mazza and Martínez-Pérez Reference Mazza and Martínez-Pérez2015) (Table 1). At Pizzo Mondello, M. communisti occurs from the upper Carnian to the lower Norian (from ca. 227.5 Ma to ca. 226.5 Ma) (Mazza et al. Reference Mazza, Rigo and Gullo2012b, Reference Mazza, Nicora and Rigo2018; Ogg et al. Reference Ogg, Chen, Orchard, Jiang, Gradstein, Ogg, Schmitz and Ogg2020). The specimens range from late juvenile to late adult (i.e., from GS3 to GS6), though mature elements are more abundant (Table 1). The stratigraphic range of E. rigoi at Pizzo Mondello is from the lower Norian to the middle Norian (from ca. 227 Ma to ca. 216 Ma) (Mazza et al. Reference Mazza, Furin, Spötl and Rigo2010, Reference Mazza, Rigo and Gullo2012b; Ogg et al. Reference Ogg, Chen, Orchard, Jiang, Gradstein, Ogg, Schmitz and Ogg2020), a longer interval than M. communisti. Elements range from GS2 to GS5: earlier ontogenetic stages are sparse (Table 1). These specimens have an average color alteration index of 1, suggesting minimal postdepositional heating (Epstein et al. Reference Epstein, Epstein and Harris1977; Nicora et al. Reference Nicora, Balini, Bellanca, Bertinelli, Bowring, Di Stefano, Dumitrica, Guaiumi, Gullo, Hungerbuehler, Levera, Mazza, McRoberts, Muttoni, Preto and Rigo2007; Mazza et al. Reference Mazza, Rigo and Gullo2012b). The studied elements are housed in the collection of the Dipartimento di Scienze della Terra “A. Desio” of the Università degli Studi di Milano. The whole conodont collection from the Pizzo Mondello section is housed in Milan and Padua (Department of Geosciences, University of Padua).
Table 1. Numbers of conodont P1 element specimens by growth stages used for the study. GS, growth stage.

Methods
Scanning
The specimens were scanned with a resolution of 1 μm using a microtomograph Nanotom S (General Electric) with the AniRA-ImmOs platform (SFR Biosciences, UMS 3444), Ecole Normale Supérieure de Lyon, France. Amira software was used for the 3D reconstruction (Guenser et al. Reference Guenser, Souquet, Dolédec, Mazza, Rigo and Goudemand2019; Fig. 2). The meshes are available on MorphoBank: http://morphobank.org/permalink/?P4048.

Figure 2. Growth stages of Metapolygnathus communisti and Epigondolella rigoi. For M. communisti: GS3—specimen NA37_18; GS4—specimen NA37_12; GS5—specimen NA37_01; GS6—specimen NA37_24. For E. rigoi: GS2—specimen NA59_20; GS3—specimen NA59_19; GS4—specimen NA59_01; GS5—specimen NA59_05.
Growth Allometry
The length of the element was used as a proxy for the size of the conodont animal, as was done in previous studies (Purnell Reference Purnell1993, Reference Purnell1994; Zhang et al. Reference Zhang, Sun, Wignall, Fu, Li, Wang and Lai2018; Ginot and Goudemand Reference Ginot and Goudemand2019). The element length, the platform length, and the platform area were measured using the 3D software MeshLab 2020.12 (Cignoni et al. Reference Cignoni, Callieri, Corsini, Dellepiane, Ganovelli and Ranzuglia2008). The length of the element was measured from the anteriormost point of the blade in a straight line to the middle of the posterior edge of the element's platform (Fig. 3). As the platform is not equally long on the two sides of the blade, its length was measured in two ways. First, as most elements are curved, the convex side of the platform was measured. In Metapolygnathus communisti, the convex size tends to be the longer side of the platform, though not always. In Epigondolella rigoi, the convex side was almost exclusively the longer side. Alternatively, the longest side of the platform was measured, regardless of curvature (Fig. 3, see also Supplementary Fig. S1). In M. communisti, in both instances, the platform was measured from the most anterior part of the platform to its posterior end in a line parallel to the imagined symmetrical axis of the platform (Fig. 3). In E. rigoi, the platform was measured from the geniculation point to the platform's posterior end. This measure was chosen because the anterior trough margin in this species, though reduced, reaches quite far up the blade, especially in more mature growth stages (for details about the taxonomic characters, see Mazza et al. Reference Mazza, Rigo and Gullo2012b).
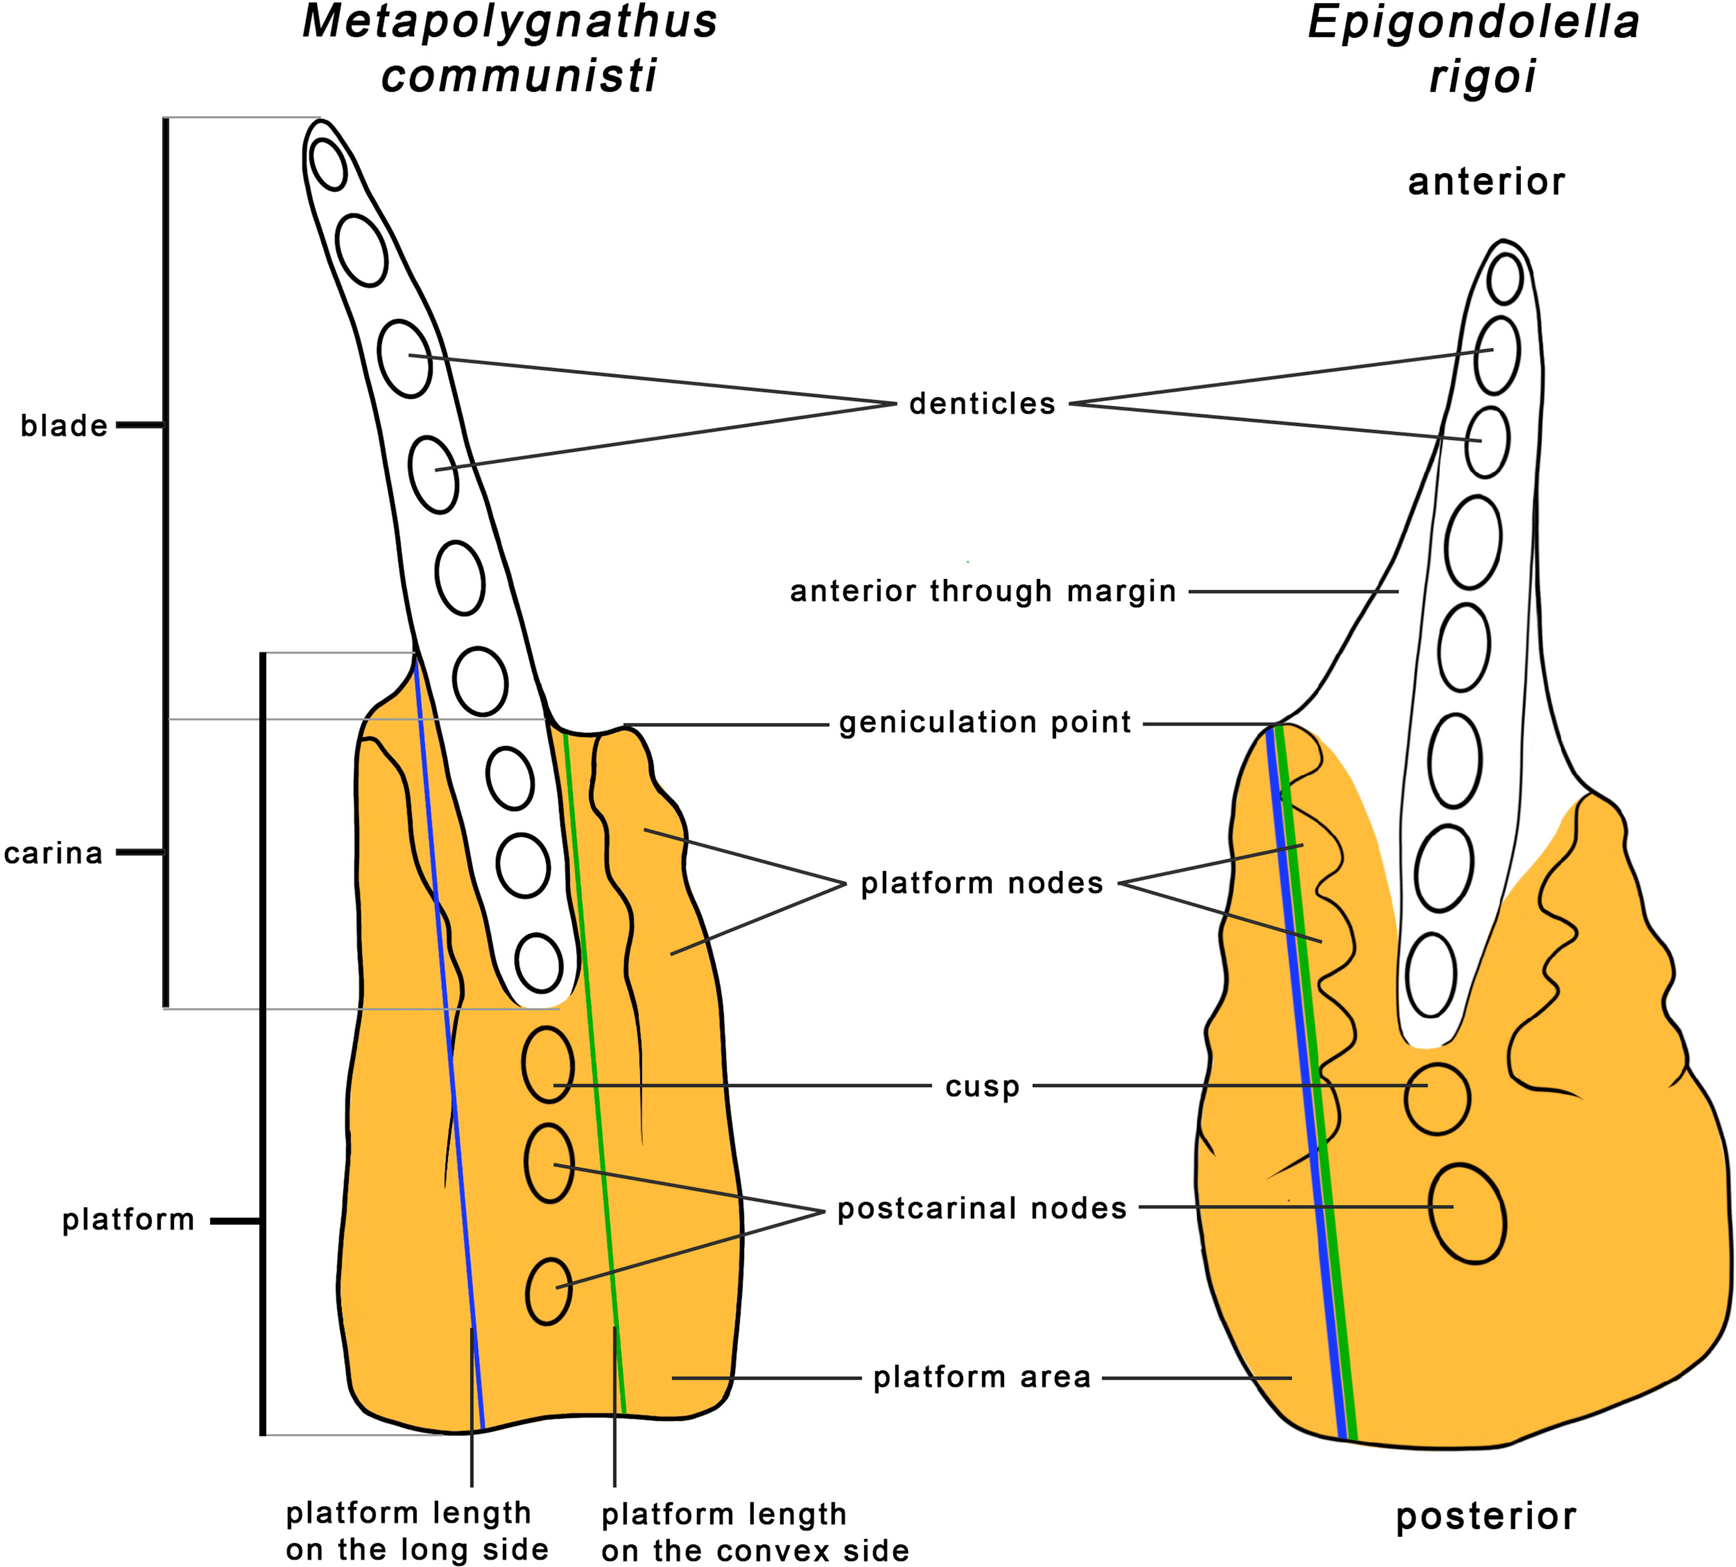
Figure 3. Measurements and morphological characters of P1 elements illustrated on Metapolygnathus communisti specimen NA37_24 and Epigondolella rigoi specimen NA59_05. In most cases, the convex side is also the long side. Morphological characters follow Mazza et al. (Reference Mazza, Cau and Rigo2012a,Reference Mazza, Rigo and Gullob).
The measured area of the platform includes the platform, the cusp, and any postcarinal nodes (Fig. 3). In M. communisti, specimens of earlier growth stages tend to exhibit only one postcarinal node, already present in GS1 (Mazza and Martínez-Pérez Reference Mazza and Martínez-Pérez2015). From GS3 on, a second posterior node may appear (Mazza and Martínez-Pérez Reference Mazza and Martínez-Pérez2015). Adult specimens show three or four posterior carinal nodes (Mazza et al. Reference Mazza, Rigo and Gullo2012b). However, our measurements consistently included only two or three postcarinal nodes in adult specimens. In E. rigoi, the cusp is always followed by a single larger postcarinal node (Mazza et al. Reference Mazza, Rigo and Gullo2012b). These parts of P1 elements were added to the measurements of the platform area, even though they are taxonomically not part of the platform, because they likely played a part in the processing of food similar to the platform itself. In E. rigoi, the anterior trough margin was not included in the measurements of the platform area (Fig. 3). The anterior trough margin is not present in M. communisti (Mazza et al. Reference Mazza, Rigo and Gullo2012b).
Reduced major axis regression (RMA) was calculated using the R package smatr 3.4-8 (Warton et al. Reference Warton, Duursma, Falster and Taskinen2012; R Core Team 2021) to examine the relationship between the length of the platform and the length of the element, as well as the platform area and the length of the element. All measurements were log-transformed to assess allometric relationships. RMA was chosen as a method because both variables are mutually dependent. Slopes obtained with E. rigoi and M. communisti data were compared with the slope.com function of the R package smatr. The same function was used to compare slopes related to the convex side and the longer side of the platform within a species. Slopes between both species and isometry were compared with slope.test function of R package smart. Isometry was modeled with a slope coefficient of 1 when testing the platform length versus element length; a slope coefficient of 2 when testing the platform area versus element length. In the case slopes do not differ significantly, we compare the intercepts and their confidence intervals showed with the sma function. A differentiation in trophic niche could be indeed reflected in different intercepts values when slopes are similar (Lumer et al. Reference Lumer, Anderson and Hersh1942; Gould Reference Gould1979).
Purnell (Reference Purnell1994) used a z-test (Hayami and Matsukuma Reference Hayami and Matsukuma1970) to test whether slope coefficients of Idiognathodus sp. and Gnathodus bilineatus differed significantly from isometric growth. A z-index higher than 1.96 means that the relationship differs from isometry significantly. We consider this index comparable to the p-values we obtained for M. communisti and E. rigoi when comparing their slope coefficients with slopes expected under isometry. To compare slope coefficients from this study with those provided by Purnell (Reference Purnell1994), 95% confidence intervals (95% CI) of slope coefficients of Idiognathodus sp. and G. bilineatus were calculated according to the following formula:
 $$\beta _1 = b_1 \pm t_{0.025, n-2} \times {\rm SE}( {b_1} ) $$
where b1 is the slope coefficient, n is the number of measurements, t is the t distribution, and SE is the standard error. Measurements for the platform length of G. bilineatus were unavailable (Purnell Reference Purnell1994).
Quantitative Topographic Analysis (DNE)
DNE measures a surface's curvature (Bunn et al. Reference Bunn, Boyer, Lipman, St. Clair, Jernvall and Daubechies2011). The DNE of an object is independent of its size and orientation. Its equation is commonly written as follows:
 $${\rm DNE} = \sum e( p ) \times area( p ) $$
Here, e(p) is the Dirichlet energy density at a point p. The sum of the areas of all points p (however small) on a surface is equal to the total area of the surface. Flat planes have DNE values of 0. Therefore, a higher DNE value expresses the elements’ complexity and the average “sharpness” of a surface (Bunn et al. Reference Bunn, Boyer, Lipman, St. Clair, Jernvall and Daubechies2011).
We applied the DNE on P1 element meshes with the molaR 5.0 R package (Pampush et al. Reference Pampush, Winchester, Morse, Vining, Boyer and Kay2016). To ensure consistency of DNE calculation, all meshes were simplified to 10,000 faces (Spradley et al. Reference Spradley, Pampush, Morse and Kay2017) using Quadric Edge Collapse Decimation in MeshLab. They were then rescaled so that each platform area equaled 0.1 mm2. Meshes were then smoothed in Avizo using the Avizo smoothing function with lambda = 0.6 and 25 iterations. Twenty to 30 smoothing iterations, a conservative amount when compared with other approaches (Bunn et al. Reference Bunn, Boyer, Lipman, St. Clair, Jernvall and Daubechies2011; Winchester et al. Reference Winchester, Boyer, St. Clair, Gosselin-Ildari, Cooke and Ledogar2014; Spradley et al. Reference Spradley, Pampush, Morse and Kay2017), are recommended because they eliminate scanning noise while capturing fine-scale features and avoiding the creation of artificial dimples that can be caused by oversmoothing (Spradley et al. Reference Spradley, Pampush, Morse and Kay2017). Different numbers of iterations (5, 10, 15, 20, 25, 30, 40, 50, 60, 70, 80, 90, and 100) were tested on a single specimen of M. communisti to determine the impact of the number of smoothing iterations (Supplementary Fig. S2). The DNE appears stable from ~20 to 25 iterations.
The meshes were then manually cut to keep the occluding surface of the platform, the cusp, and the postcarinal nodes (Fig. 4). Additionally, we cut out the aboral part of the platform, because it does not take an active part in food processing. The meshes were finally imported into R software as binary ply files. Individual pieces of meshes created by the smoothing operation were removed to prevent them from affecting the DNE calculation. DNE was calculated with an included boundary exclusion criterion (BoundaryDiscard=“vertex”), as advised by Spradley et al. (Reference Spradley, Pampush, Morse and Kay2017). The total surface DNE is the mean of all DNE values for individual faces of a surface (Pampush et al. Reference Pampush, Winchester, Morse, Vining, Boyer and Kay2016). Because a DNE value is not a traditional measurement, we did not log-transform the data. We rather fit the relationship between DNE values and element dimensions (i.e., element length, platform length, and platform area) with a power law using the aomisc R package (Onofri Reference Onofri2020). In addition, GS5 was chosen to compare DNE values between species, because this stage comprised enough specimens from both species to allow statistical analysis (Table 1). GS5, representing adults, also allows for interpretations of the diet. The medians of DNE distributions were compared with a Kruskal-Wallis test in R (Hollander and Wolfe Reference Hollander and Wolfe1973).

Figure 4. Log-transformed Dirichlet normal energy (DNE) values across growth stages GS3 to GS6 of Metapolygnathus communisti and across growth stages GS2 to GS5 of Epigondolella rigoi. Names of the specimens are specified in Fig. 2.
The R code and data used for investigating allometric patterns and DNE are available on OSF at this address: https://osf.io/283wq/?view_only=6f22274998134eb99cbe43749c6e3e7e (Kelz et al. Reference Kelz, Guenser, Rigo and Jarochowska2022).
Results
Growth Allometry
In all relationships examined, high coefficients of determination (R 2 ≥ 0.89) indicated that linear regression captured the relationships between the variables sufficiently (Table 2). In Metapolygnathus communisti, linear regression slopes of the platform length over the P1 element length and the platform area over the P1 element length showed positive allometry (Fig. 5A,B). In both cases, the slopes differed significantly from values corresponding to isometry, that is, 1 and 2, respectively (Table 2). No differences between the two ways the platform length was measured could be detected (p = 0.23; Supplementary Fig. S1A).

Figure 5. A–D, Allometric growth of P1 platform length and P1 platform area for Metapolygnathus communisti (n = 27) and Epigondolella rigoi (n = 23); each dot represents an element, and the colors are related to the growth stage. A, Platform length over element length for M. communisti; convex platform length only. B, Platform area over element length for M. communisti. C, Platform length over element length for E. rigoi; convex platform length only. D, Platform area over element length for E. rigoi. E, F, Comparison of the allometric growth between Gnathodus bilineatus (Purnell Reference Purnell1994), Idiognathodus sp. (Purnell Reference Purnell1993, Reference Purnell1994), E. rigoi, and M. communisti. E, Platform length over element length. Platform length in M. communisti and E. rigoi was measured on the convex side. No data were available for G. bilineatus (Purnell Reference Purnell1994). F, Platform area over element length. G, Comparison of slope coefficients between species; G1, Platform length over element length; G2, platform area over element length.
Table 2. Linear regressions for platform length and platform area over element length for each studied conodont species. Data for Idiognathodus sp. and Gnathodus bilineatus were extracted from Purnell (Reference Purnell1994), except for the 95% confidence intervals (CI). Slope coefficients and R 2 result from the reduced major axis method. The 95% CI values resulting from the sma function calculation for Metapolygnathus communisti and Epigondolella rigoi; from calculation for Idiognathodus sp. and G. bilineatus. The p-value results from the slope.test function that compared the coefficients between species and isometry for M. communisti and E. rigoi; from z-test (Hayami and Matsukuma Reference Hayami and Matsukuma1970) for Idiognathodus sp. and G. bilineatus.

In Epigondolella rigoi, both regression slopes (platform length over element length and platform area over element length) indicated positive allometry and were significantly higher than predicted under the null hypothesis of isometric growth (Table 2, Fig. 5C,D). No significant difference between the two ways the platform length was measured could be detected (p = 0.83; Supplementary Fig. S1B).
Slope coefficients of the platform length over element length did not differ significantly between M. communisti and E. rigoi (p = 0.166), but in both cases, they were significantly higher than that of Idiognathodus sp., as their confidence intervals did not overlap (Table 2, Fig. 5E,G). Platform areas in all four species showed positive allometry over element length (slope coefficients between 2.149 and 2.561), but the four 95% confidence intervals overlapped, and no significant difference was detected between M. communisti and E. rigoi (p = 0.479). No differences in intercepts could be detected for any of the examined relationships between E. rigoi and M. communisti (Table 2).
Dental Topography (DNE)
In M. communisti, DNE values ranged between 99.93 and 279.84; in E. rigoi, between 117.59 and 353.71 (Fig. 6). Specimens classified as GS5 of E. rigoi showed higher DNE values than GS5 specimens of M. communisti (Kruskal-Wallis test, p = 0.015; Fig. 6A).

Figure 6. A, Distribution of Dirichlet normal energy (DNE) values across growth stages in Epigondolella rigoi and Metapolygnathus communisti. B, DNE values over element length fit to the allometric equation y = aXb. C, DNE values over platform length fit to the allometric equation y = aXb. D, DNE values over platform area fit to the allometric equation y = aXb. E, Comparison of scaling exponents between species; E1, DNE values over element length; E2, DNE values over platform length; E3, DNE values over platform area.
The relationship between DNE values and P1 dimensions shows a modest fit to the power law (0.42 ≤ R 2 ≤ 0.59; Table 3, Fig. 6B,D). Between E. rigoi and M. communisti, the scaling exponents (b in Table 3) are, respectively: 0.66 and 0.72 in DNE versus element length; 0.52 and 0.48 in DNE versus platform length; and 0.29 and 0.30 in DNE versus platform area (Table 3). No difference in exponents is detected for any of the examined relationships (Fig. 6E).
Table 3. Parameters of the allometric equation y = aXb fit to Dirichlet normal energy (DNE) values over element dimensions for each studied conodont species. All values have been rounded to the second significant digit.

Discussion
The null hypothesis of an isometric growth of P1 elements in Metapolygnathus communisti and Epigondolella rigoi could be rejected based on positive growth allometry of the platform length and platform area over element length. These results support previous findings of positive growth allometry in these organs in the much older, Carboniferous, ozarkodinid taxa Gnathodus bilineatus and Idiognathodus sp. (Purnell Reference Purnell1993, Reference Purnell1994). Under the assumption that positive allometry reflects the organism's energy demand growing at a higher pace than the surface of a (molar) tooth (Gould Reference Gould1966, Reference Gould1975), these results are consistent with the interpretation of P1 elements as organs used for mechanical slicing and grinding of food, as previously proposed based on microwear (Purnell Reference Purnell1995; Martínez-Pérez et al. Reference Martínez-Pérez, Plasencia, Jones, Kolar-Jurkovšek, Sha, Botella and Donoghue2014b), enamel-like ultrastructure of conodont lamellar crown tissue (Donoghue Reference Donoghue2001a), and FEA (Jones et al. Reference Jones, Evans, Rayfield, Siu and Donoghue2012a). However, the assumptions of the original studies by Purnell (Reference Purnell1993, Reference Purnell1994) need to be revisited in the context of the studies made in the field of metabolic ecology over the last 20 years. The premise of the argument based on tooth positive allometry was that an animal's metabolic rate and thus its energy requirements increase as its volume to the power of 0.75. This scaling exponent has been predicted by several theories (Kleiber Reference Kleiber1932; Feldman and McMahon Reference Feldman and McMahon1983; West et al. Reference West, Brown and Enquist1997; Savage et al. Reference Savage, Gillooly, Woodruff, West, Allen, Enquist and Brown2004), but an exponent of 0.67 has been equally reported in mammals and derived from theoretical considerations (Heusner Reference Heusner1982; Dodds et al. Reference Dodds, Rothman and Weitz2001; White and Seymour Reference White and Seymour2003), the same exponent developed in assumption 3 in the “Introduction.” This disagreement has important implications for the reasoning in the studies by Purnell (Reference Purnell1993, Reference Purnell1994): if the metabolic rate in conodonts scaled as body mass to the power of 0.67 and not 0.75, then an isometric relationship between the food acquisition surface and the animal's dimensions might well be expected. In such a case, it would be impossible to distinguish whether positive allometry reflects differences in scaling between energy demand and food-processing tooth surface or whether the two variables are not related. The latter possibility would preclude the use of growth allometry in inferring trophic ecology in fossil organisms. We attempt, therefore, to extrapolate the relationship in conodonts by comparison with related organisms. The average scaling exponent in fish has been reported as 0.79 (Clarke and Johnston Reference Clarke and Johnston1999) or even 0.99 (Glazier Reference Glazier2009). In ectotherms, exponents higher than 0.75 have been reported across all groups compiled by Glazier (Reference Glazier2007). Based on analogy, a scaling exponent of metabolic rate over body mass or volume can be expected to be higher than 0.67 in conodonts. It should, however, be kept in mind that this is a strong and untestable assumption, as the scaling exponents vary extremely between animals and even within taxa, depending on their interactions with other organisms (Bokma Reference Bokma2004; Glazier Reference Glazier2009; Sieg et al. Reference Sieg, O'Connor, McNair, Grant, Agosta and Dunham2009). The scaling exponents of DNE over element length lie between 0.66 and 0.72, and thus are closer to the 0.67 exponent than to 0.75. This might serve as an indication that in conodonts, energy demand grew in a more mammal-like fashion (closer to M0.67) than in a fish or reptilian fashion (M>0.67), in line with the idea of conodont P1 elements functioning analogously to molars (Donoghue and Purnell Reference Donoghue and Purnell1999b). But scaling of DNE with tooth size has only been recently identified in apes (Berthaume and Schroer Reference Berthaume and Schroer2017), and the interpretation of the relationships between this metric, body size, and metabolism are little known; therefore, the scaling observed here requires further comparisons with extant organisms. Here we tentatively uphold the reasoning and conclusions of Purnell (Reference Purnell1993, Reference Purnell1994) and extend them to the new taxa examined here: if the metabolic rate in conodonts scaled as M>0.67, then the positive allometry of conodont element dimensions supports the grasping-tooth model in all four taxa, and the test may be used in other conodont element morphologies.
Functional Differences between Conodont Species
The allometric relationship between platform area and element length did not differ significantly between the two Triassic species examined here and the Carboniferous taxa Idiognathodus sp. and G. bilineatus (Fig. 5G2). However, there is a significant difference between Triassic species and Idiognathodus sp. when considering the growth of the platform length (Fig. 5G1). Perhaps this difference in slope coefficient resulted from the methodological differences in how platform measurements were taken here and in Purnell (Reference Purnell1993, Reference Purnell1994). Measurements based on pictures often suffer from distortions from projecting a 3D structure onto a plane, where differences in leveling the photographed specimens might affect the results (Mullin and Taylor Reference Mullin and Taylor2002; Collins and Gazley Reference Collins and Gazley2017). Proper 3D measurements of P1 platform length and area using our methodological protocol should be investigated in Idiognathodus sp. and G. bilineatus to verify any difference in allometric slope coefficients. However, platform length showed a stronger positive allometry in Late Triassic taxa than in Idiognathodus sp., which suggests that the increase in functional surface was primarily achieved by platform elongation, rather than growth in width.
Our hypothesis that M. communisti and E. rigoi differed in the growth allometry of their P1 elements could not be rejected (Table 2). Similar growth allometry might indicate similar energy demand, as well as similar efficiency in food acquisition and assimilation.
Conodont Diet Inferred by Platform Curviness
Previous investigations showed that dental topography methods could be applied to nonhomologous dental tools to track dietary differences between distantly related clades (Stockey et al. Reference Stockey, Donoghue, Harvey, Murdock and Purnell2021). Conodont elements in this study showed similar curviness to complex mammal teeth. This similarity does not mean that direct dietary associations can be made between conodonts and mammals, but dental topography allows comparisons between taxa and ontogenetic stages and helps in constraining conodont ecology (Purnell and Evans Reference Purnell and Evans2009). In M. communisti and E. rigoi, DNE values differed significantly at the adult growth stage (i.e., GS5). We tested the differences in DNE values only at GS5, because ontogenetically younger growth stages were represented by fewer specimens in both species (Table 1), which made observations of these stages less conclusive. Differences in GS5 DNE values between M. communisti and E. rigoi allow rejecting the hypothesis that adult specimens of both species shared the same diet. More DNE analyses on conodonts are needed to understand the scope of DNE values in this group and to confidently suggest that a discrepancy between DNE values of different species reflects different dietary niches. Indeed, DNE values of GS5 specimens of M. communisti are similar to those reported for folivores or omnivores, and insectivores or folivores in the case of E. rigoi; but these diets based on DNE values stem from studies on primates (Bunn et al. Reference Bunn, Boyer, Lipman, St. Clair, Jernvall and Daubechies2011; Winchester et al. Reference Winchester, Boyer, St. Clair, Gosselin-Ildari, Cooke and Ledogar2014). Moreover, conodont elements are more than 10 times smaller than primate teeth, complicating dietary comparison, as conodonts could not eat the same items. Though primate dietary classifications do not apply to conodonts, they may offer a general reference point for the methods of breaking down different food types. Insectivores rely on sharp cusps to apply maximal force to a small surface area to pierce hard insect chitin, and folivores also use steeply sloped cusps to shear tough cellulose-rich leaves (Lucas Reference Lucas1979; Strait Reference Strait1997). Therefore, it is possible that conodont element platforms evolved to break down food types with similar mechanical properties. For instance, conodonts may have punctured arthropod larvae (Dzik Reference Dzik2021), a diet consistent with the DNE values observed in M. communisti.
Current Limits on DNE and Recommendations for Further Investigations
The definition of the platform for DNE measurement is worth discussing, because it is somewhat subjective. In this work, we decided to include the cusp and all postcarinal nodes, because in many cases, the cusp marked a notable transition between sharper denticles of the blade and flatter nodes on the platform. In M. communisti, the number of postcarinal nodes increases through growth (Mazza et al. Reference Mazza, Rigo and Gullo2012b; Mazza and Martínez-Pérez Reference Mazza and Martínez-Pérez2015), impacting DNE values through the ontogeny of this species. In E. rigoi, the number of posterior nodes stays the same (Mazza et al. Reference Mazza, Rigo and Gullo2012b), so variations of DNE values are more related to the growth of prior postcarinal nodes or the addition of new nodes on the edge of the platform. This difference in node location on the platform might affect the way conodonts broke down food, but it should be further investigated by assessing occlusal kinematics of M. communisti and E. rigoi P1 elements, which is currently impossible, because no clusters (i.e., a conodont apparatus with elements found in connection) are currently known for these species.
There are several challenges when applying DNE to conodonts. As DNE is a comparatively new tool, reference values and understanding of variability (e.g., intraspecific, ontogenetic, and taphonomic) are limited. So far, DNE research has focused on mammals, whose tooth function largely relies on jaws acting as levers. The different mechanics of feeding in jawed organisms necessitates that the comparisons drawn here between conodont elements and primate molars must be viewed as extremely hypothetical. Marine environment, evolutionary distance, and the lack of jaws in conodonts make tooth function likely not completely analogous between the two. Even more importantly, conodonts are unique among vertebrates in repairing their teeth by periodic apposition of new growth layers on top of the ones previously used for food processing (Shirley et al. Reference Shirley, Grohganz, Bestmann and Jarochowska2018). This mechanism is used to repair damage and restore sharpness (Donoghue Reference Donoghue1998), as well as to generate topographic complexity (Müller and Nogami Reference Müller and Nogami1971). Thus, DNE values in conodont elements will increase as the elements grow and the animal gets older. This is not the case in mammals due to their lack of tooth-repair ability: it has been shown with mouse molars that DNE values decrease with the age of the animal because of tooth abrasion (Savriama et al. Reference Savriama, Romestaing, Clair, Averty, Ulmann, Ledevin and Renaud2022). That is why typical applications of DNE on mammals do not consider ontogenetic development; instead, researchers investigate DNE variation between young adults from different species or between different teeth within one specimen. For example, Pérez-Ramos et al. (Reference Pérez-Ramos, Romero, Rodriguez and Figueirido2020) compared DNE values between premolars and molars in cave bears and suggested that “increasing upper tooth surface areas also increase the values of both topographic variables, and probably, also their chewing efficiency” (p. 5).
A consistent protocol of mesh preparation before DNE calculation is also needed to get better reproducibility of the method. For example, the scan resolution and the number of smoothing iterations vary in current literature, which can impact DNE values (Spradley et al. Reference Spradley, Pampush, Morse and Kay2017; Assemat et al. Reference Assemat, Thiery, Lieffroy and Girard2022). This variation in processing is important, because comparisons are most conclusive when drawn between data based on similar preparation. Furthermore, the scan resolution depends on the size of the studied object. We cannot expect a 1 μm resolution (as for conodont P1 elements from the Pizzo Mondello [Guenser et al. Reference Guenser, Souquet, Dolédec, Mazza, Rigo and Goudemand2019]) for mammalian teeth of several millimeters in length. However, we can set a standardized scan resolution for conodont elements of 1 μm (even lower would be better), which would allow investigation of ontogenetic patterns by including P1 elements of less than 400 μm in length (i.e., juveniles). With respect to postscanning preparation, we second Spradley et al.'s (2017) recommendations: a conservative number of smoothing iterations (20–30) using non–Laplace based smoothing operators, such as that implemented in Avizo, and mesh simplification to a fixed number of faces.
Conclusions
We used 3D meshes to test the null hypothesis that Late Triassic conodont P1 elements grew isometrically, thus revisiting Purnell's (Reference Purnell1993, Reference Purnell1994) test of conodont element function. We tested this hypothesis against the alternative that the elements showed positive allometry. Positive allometry had been proposed to be a test of the grasping-tooth hypothesis (Aldridge et al. Reference Aldridge, Smith, Norby and Briggs1987; Purnell and von Bitter Reference Purnell and von Bitter1992). However, the test requires knowledge of the scaling exponent of the metabolic rate to body mass (volume). We followed Purnell's protocol (Reference Purnell1993, Reference Purnell1994), analyzing the growth allometry of the platform length and area versus total length of the element, originally performed on 2D projections of conodont elements. Platform length and platform area showed positive allometry relative to element length, allowing us to reject the null hypothesis. If metabolic rate in conodonts scaled with body mass similarly to that in fish and ectotherms, the test holds, and our results support the grasping-tooth hypothesis. Neither slope coefficients nor intercepts differed between Metapolygnathus communisti and Epigondolella rigoi. However, for platform length over element length, slope coefficients were higher than those reported for the Carboniferous conodonts Idiognathodus sp. (Purnell Reference Purnell1994), which may suggest that the energy demand (and thus metabolic rate) increased faster in this species as the organism grew. A more precise measurement of surface area in 3D models compared with 2D projections used in Idiognathodus sp. did not result in a significantly different relationship. In contrast, length- rather than area-based measurements allowed detection of significant differences between Late Triassic taxa and Idiognathodus sp.
We added dental topographic analysis of the platforms using DNE to test the hypothesis that co-occurring species M. communisti and E. rigoi shared the same food base. Epigondolella rigoi showed significantly higher DNE values than M. communisti when adult growth stages were compared. Although DNE is a size-independent measure, its values increased with the size of adult specimens in both Triassic taxa. This increase is interpreted here as the reflection of energy demand growing faster than the area of the element and thus potentially reflecting the scaling of the metabolic rate consistent with the assumptions of the studies by Purnell (Reference Purnell1993, Reference Purnell1994). Scaling exponents of DNE over element length in an allometric model were closer to those reported for mammals than for fish and other ectotherms. As these exponents did not differ substantially between M. communisti and E. rigoi, the differences in DNE are not likely to arise from differing metabolic rates and can be attributed to different food bases.
Our study revisited one of the main arguments used in interpreting the function of conodont elements: their positive growth allometry. We argue that a key assumption of this interpretation, the scaling of metabolic rate as mass (volume) to the power of 0.75, cannot be made for conodonts automatically, as there is substantial variation between known animals. We also show that co-occurring taxa differed in their diets, as reported previously in Silurian conodont communities (Terrill et al. Reference Terrill, Jarochowska, Henderson, Shirley and Bremer2022), which supports trophic diversification as an important driver of the remarkable disparity of their elements.
Acknowledgments
We thank B. Shirley for support in using Aviso and W. Petryshen for advice on cleaning and saving meshes. We also thank M. Mazza for advice and field sampling. We finally thank N. Goudemand for supporting the project (French ANR grant, ACHN project EvoDevOdonto). P.G. was supported by a Visiting Scholarship awarded by Friedrich-Alexander-Universität Erlangen-Nürnberg. E.J. was supported by Deutsche Forschungsgemeinschaft (project no JA 2718/3-1). M.R. was supported by DOR2054230/20 from the University of Padua. We are grateful to V. Karádi, N. Campione, and Paleobiology editor J. Crampton for constructive comments, which improved the article, and to C. White for sharing data on the scaling of metabolic rates in various taxa.
Declaration of Competing Interests
The authors declare no competing interests.
Data Availability Statement
Meshes were reposited on MorphoBank: http://morphobank.org/permalink/?P4048. R code and data were reposited on OSF: https://osf.io/283wq/?view_only=6f22274998134eb99cbe43749c6e3e7e. The manuscript was uploaded on BioRχiv server as a preprint at this address: https://doi.org/10.1101/2021.06.10.447946.


