


Attention is the set of processes that allow us to process certain information to the relative exclusion of other information (Racer & Dishion, Reference Racer and Dishion2012). An attention system that fails to achieve an adaptive balance between voluntary and involuntary attention is likely to cause cascading effects on higher order cognitive and emotional systems that may place an individual at risk for maladaptive behavior (Racer & Dishion, Reference Racer and Dishion2012). For example, impaired attention is associated with impairments in academic achievement (Barriga et al., Reference Barriga, Doran, Newell, Morrison, Barbetti and Robbins2002; Rabiner et al., Reference Rabiner and Coie2000; Tamm et al., Reference Tamm, Epstein, Denton, Vaughn, Peugh and Willcutt2014), school maladjustment (Herman & Ostrander, Reference Herman and Ostrander2007), and social functioning (Andrade et al., Reference Andrade, Brodeur, Waschbusch, Stewart and McGee2009; Tamm et al., Reference Tamm, Epstein and Becker2019).
Reaction time variability (RTV) is a marker for impaired attention. RTV has been suggested to reflect central nervous system integrity and is associated with cognitive functions such as top-down attention control (MacDonald et al., Reference MacDonald, Li and Backman2009). Numerous hypotheses have been suggested to account for RTV (Kofler et al., Reference Kofler, Rapport, Sarver, Raiker, Orban, Friedman and Kolomeyer2013), including that it reflects general inefficiency of information processing speed (Weigard et al., Reference Weigard, Clark and Sripada2021) or specific defects in top-down effortful control or arousal (Aston-Jones & Cohen, Reference Aston-Jones and Cohen2005; Unsworth & Robison, Reference Unsworth and Robison2020), which are both mechanisms that may contribute to attentional lapses during information processing (Killeen, Reference Killeen2019; Unsworth et al., Reference Unsworth, Redick, Lakey and Young2010). Similar mechanisms are implicated in a variety of psychiatric disorders, and RTV may be a correlate of a wide range of maladaptive behavior.
Indeed, RTV is frequently elevated in multiple patient populations including ADHD (Epstein et al., Reference Epstein, Langberg, Rosen, Graham, Narad, Antonini, Brinkman, Froehlich, Simon and Altaye2011; Tamm et al., Reference Tamm, Narad, Antonini, O’Brien, Hawk and Epstein2012), schizophrenia and depression (Schwartz et al., Reference Schwartz, Carr, Munich, Glauber, Lesser and Murray1989), mood disorders (Bora et al., Reference Bora, Vahip and Akdeniz2006), traumatic brain injury (Segalowitz et al., Reference Segalowitz, Dywan and Unsal1997; Stuss et al., Reference Stuss, Pogue, Buckle and Bondar1994; Tinius, Reference Tinius2003; Whyte et al., Reference Whyte, Polansky, Fleming, Coslett and Cavallucci1995), and autism (Verte et al., Reference Verte, Geurts, Roeyers, Oosterlaan, Sergeant, Verte, Geurts, Roeyers, Oosterlaan and Sergeant2005). Higher RTV is also associated with ratings of attentional impulsiveness (Swick et al., Reference Swick, Honzel, Larsen and Ashley2013), behavioral inattention (Antonini et al., Reference Antonini, Narad, Langberg and Epstein2013), impaired social processing (Tamm et al., Reference Tamm, Epstein and Becker2019), impaired reading decoding (Tamm et al., Reference Tamm, Epstein, Denton, Vaughn, Peugh and Willcutt2014), academic underachievement (Sjowall et al., Reference Sjowall, Bohlin, Rydell and Thorell2017), and poorer overall functioning (van Lieshout et al., Reference van Lieshout, Luman, Twisk, Faraone, Heslenfeld, Hartman, Hoekstra, Franke, Buitelaar, Rommelse and Oosterlaan2017).
One issue in clarifying how and why RTV is associated with such a range of behaviors and disorders is that it provides a unitary measure for a variety of partially distinct cognitive processes. There is currently little agreement about how to best measure and interpret differences in RTV. While many studies rely on standard deviation of reaction time (RTSD) to characterize RTV, such measures may not accurately capture the unimodal, positively skewed shape of the RT distribution (Heathcote et al., Reference Heathcote, Popiel and Mewhort1991). A growing number of researchers have begun to use mathematical models that can better accommodate the shape of the RT distributions. In addition, there is growing interest in neurobiologically informed computational models that can support mechanistic interpretation of group differences in RT and RTV metrics (Ferrante et al., Reference Ferrante, Redish, Oquendo, Averbeck, Kinnane and Gordon2019; White et al., Reference White, Ratcliff, Vasey and McKoon2010; Wiecki et al., Reference Wiecki, Poland and Frank2015). Primary models used to characterize performance include the ex-Gaussian model (Leth-Steenson et al., Reference Leth-Steenson, Elbaz and Douglas2000) and Ratcliff’s diffusion model (DM) (Ratcliff & Tuerlinckx, Reference Ratcliff and Tuerlinckx2002; Voss et al., Reference Voss, Rothermund and Voss2004).
Briefly, the ex-Gaussian model decomposes the RT distribution into Gaussian and exponential components to better fit the actual RT distribution (Leth-Steenson et al., Reference Leth-Steenson, Elbaz and Douglas2000). The ex-Gaussian distribution is characterized by three parameters: mu and sigma, reflecting the mean and SD of its Gaussian part, and tau, reflecting the exponential part (Leth-Steenson et al., Reference Leth-Steenson, Elbaz and Douglas2000). Cognitive interpretations of these parameters remain uncertain (Matzke & Wagenmakers, Reference Matzke and Wagenmakers2009); however, some interpret tau as reflecting attentional lapses (Epstein et al., Reference Epstein, Langberg, Rosen, Graham, Narad, Antonini, Brinkman, Froehlich, Simon and Altaye2011; Leth-Steenson et al., Reference Leth-Steenson, Elbaz and Douglas2000; Tamm et al., Reference Tamm, Narad, Antonini, O’Brien, Hawk and Epstein2012), and others suggest tau is indicative of intentional cognitive processes (Kieffaber et al., Reference Kieffaber, Kappenman, Bodkins, Shekhar, O’Donnell and Hetrick2006) or should not be interpreted in terms of specific processes (Matzke & Wagenmakers, Reference Matzke and Wagenmakers2009; Rieger & Miller, Reference Rieger and Miller2020).
The DM (Ratcliff & Tuerlinckx, Reference Ratcliff and Tuerlinckx2002; Voss et al., Reference Voss, Rothermund and Voss2004) provides additional information about cognitive processes that underlie performance as it simultaneously models RTs and accuracy. The DM assumes that information about a stimulus is accumulated via an information accumulation process until a decision is made and a response is initiated (Ratcliff & McKoon, Reference Ratcliff and McKoon2008; Ratcliff & Rouder, Reference Ratcliff and Rouder1998). DM parameters include (1) drift rate (how efficiently an individual can accumulate information to inform their response decision); (2) boundary separation (how “sure” a person needs to be before committing to a response, i.e., speed–accuracy trade-off); and (3) non-decision time (time it takes to complete all other information processes, such as encoding, and motor preparation and execution) (Ratcliff & McKoon, Reference Ratcliff and McKoon2008; Ratcliff & Rouder, Reference Ratcliff and Rouder1998).
Most prior studies, particularly in children, have relied on a single model to characterize task performance; however, simulation studies and studies in typically-developing adults have examined associations between ex-Gaussian and DM parameters. The general conclusions are that ex-Gaussian parameters often correlate broadly with multiple DM parameters (Matzke & Wagenmakers, Reference Matzke and Wagenmakers2009), but the strength of these correlations varies and, in some cases, specific associations are obtained (e.g., non-decision time specifically associated with mu; drift most strongly associated with tau (Fitousi, Reference Fitousi2020)). Similar patterns have been identified in at least one study of children with ADHD (Karalunas & Huang-Pollock, Reference Karalunas and Huang-Pollock2013); however, the sample size was modest. Clarifying these associations as they occur at various stages of development will be critical in helping researchers integrate previous findings to inform additional work.
Moreover, examining RT patterns with these models can clarify cognitive mechanisms contributing to differences on choice RT tasks. We highlight two examples here. First, we describe patterns of change in both Gaussian and other RT parameters over time. Time-on-task effects are well established for many cognitive tasks, and they are typically interpreted as reflecting challenges to sustained attention. However, other processes, such as increasing impulsivity or adjustments to response strategy based on task difficulty, could also play a role.
Second, we present the issue of sex differences in RT – a topic that has received much research attention but has primarily used Gaussian indices. In adults, studies consistently find that males have faster and less variable RTs than females (Deary & Der, Reference Deary and Der2005; Der & Deary, Reference Der and Deary2006; Reed et al., Reference Reed, Vernon and Johnson2004; Silverman, Reference Silverman2006). In children, some very early studies found similar patterns (Gilbert, Reference Gilbert1894; Goodenough, Reference Goodenough1935); however, more recent work has found differences in speed but not variability of RTs (Bunce et al., Reference Bunce, Tzur, Ramchurn, Gain and Bond2008; Kalb et al., Reference Kalb, Jansen, Reulbach and Kalb2004), albeit in samples that sometimes span large age ranges.
Sex differences in the cognitive processes contributing to mean level RT and RTV performance are only just being explored via computational modeling. There is some evidence for differential strategy use between the sexes during choice RT tasks (Adam et al., Reference Adam, Paas, Buekers, Wuyts, Spijkers and Wallmeyer1999), and studies in both adults (Era et al., Reference Era, Sainio, Koskinen, Ohlgren, Harkanen and Aromaa2011; Landauer et al., Reference Landauer, Armstrong and Digwood1980) and children (Lynn & Ja-Song, Reference Lynn and Ja-Song1993) suggest that females may have faster decision times but slower motor responses than males. In a recent study of adolescents, sex differences were observed in the way response caution changes with pubertal development (Castagna & Crowley, Reference Castagna and Crowley2021), suggesting that the processes accounting for RT differences (or lack thereof) may differ in younger children as compared to adolescents and adults. Indeed, school-age females demonstrated more effective evidence accumulation but higher response caution than males on an emotional decision-making task (Xu et al., Reference Xu, Hao, Chen, He, Jiang, Tian, Wang, Wang, Wang, Han, Tan, Men, Gao, He, Tao, Dong and Qin2021).
Overall, there is continued interest in cognitive performance measures and particularly computational performance parameters as potential transdiagnostic risk markers for psychopathology (Ferrante et al., Reference Ferrante, Redish, Oquendo, Averbeck, Kinnane and Gordon2019; Karalunas et al., Reference Karalunas, Hawkey, Gustafsson, Miller, Langhorst, Cordova, Fair and Nigg2018; Wiecki et al., Reference Wiecki, Poland and Frank2015). However, our understanding of (1) how parameters from different models relate to one another and (2) sex differences in the processes contributing to overall RT and RTV metrics comes largely from adult populations. Characterizing the associations between model parameters in childhood will be critical for integrating findings from prior studies of child psychopathology and informing model selection in future studies of childhood risk. In addition, clarifying sex differences in the mechanisms contributing to RT performance may ultimately help explain sex-specific cognitive and neural risk markers for psychopathology (e.g., Arnett et al., Reference Arnett, Pennington, Willcutt, DeFries and Olson2015).
This study utilized trial-level stop-signal task (SST) data from the Adolescent Brain Cognitive Development (ABCD) study to examine Gaussian, ex-Gaussian, and DM indicators of RTV. The sample provides an unprecedented opportunity to examine RTV patterns in a large pediatric sample. The sample is homogeneous developmentally (all participants were 9–10 years old) yet heterogeneous in terms of sex, race, and psychological diagnoses. In addition to examining interrelations among RTV indicators and how these relate to task accuracy, we describe changes in RTV with time on task. Finally, we examine sex differences across computational model parameters to illustrate how these indicators can illuminate processes contributing to documented sex differences in RT speed and variability.
Methods
Participants
The ABCD Study recruited youth aged 9–10 years of age across 21 geographically diverse US sites. Informed consent/assent was obtained, and all procedures were approved by a central Institutional Review Board ensuring research was completed in accordance with the Helsinki Declaration. The present study accessed publicly available ABCD data through the National Data Archive. In release 3.0, baseline trial-level SST data for 10,179 participants were available. Children were excluded if their accuracy on the SST was <66% on non-stop trials (n = 1199) or their mean stop probability was <25% or >75% (n = 196). Hence, the sample size for the current study was 8,916 children (mean age = 9.9, SD = .62; 49.1% female; 77.4% White, 19.8% Hispanic, 18.1% African American, 7.2% Asian, 3.3% American Indian, 0.2% Native Alaskan/Hawaiian, 0.5% Pacific Islander).
Measures
The SST is a computerized measure of response inhibition with two 180 trial runs with a brief (median = 43 s) break between runs (Casey et al., Reference Casey, Cannonier, Conley, Cohen, Barch, Heitzeg, Soules, Teslovich, Dellarco, Garavan, Orr, Wager, Banich, Speer, Sutherland, Riedel, Dick, Bjork and Thomas2018). On every trial, the participant views a horizontal arrow pointing either right or left. Participants indicate the direction of the arrow via a two-button response panel within 1000 ms after which a fixation cross appears with an intertrial interval that lasts from 700 to 2000 ms. Thirty (16.6%) trials in each run were stop trials on which the horizontal arrow is followed by an upward arrow (i.e., the stop signal) for 300 ms. Participants inhibit their response when they see the stop signal. The delay between presentation of the horizontal target arrow and the upward arrow (SSD) begins at 50 ms and varies according to the participant’s performance. Successful inhibition results in increases of 50 ms and unsuccessful inhibition results in decreases of 50 ms so that the rate of inhibition is approximately 50%. This SSD resets to 50 ms at the start of the second run.
RTs <150 ms were excluded in our computational models. Stop-signal reaction time (SSRT) was computed using the integration method in accordance with current consensus best-practice for measuring inhibitory control on this task (Verbruggen et al., Reference Verbruggen, Aron, Band, Beste, Bissett, Brockett, Chamberlain, Chambers, Colonius, Colzato, Corneil, Coxon, Dupuis, Eagle, Garavan, Greenhouse, Heathcote, Huster, Jahfari and Boehler2019). In the integration method, the time required to stop is estimated by integrating the RT distribution and identifying the point at which the integral equals the probability of responding. SSRT is then calculated by subtracting SSD from the finishing timeFootnote 1 . Consistent with best practice recommendations, Go RT omissions were replaced with the longest Go RT for that participant and premature responses on stop trials (i.e., responses before stop-signal presentation) were included when calculating the participant’s probability of successful stopping and the SSD’s.
Gaussian estimation
The SST RT trial data from Go-trials were utilized to compute mean RT (MRT), RTSD, and coefficient of variation (CV). MRT was computed by averaging RTs on correct response trials. RTSD was derived by computing the SD of each individual’s RTs. CV was computed by dividing RTSD by the MRT, providing a measure of RTV controlling for speed.
Ex-Gaussian estimation
Correct RTs on Go-trials were used to compute ex-Gaussian indicators using retimes (Massidda, Reference Massidda2013; Van Zandt, Reference Van Zandt2000). A mean (mu) and SD (sigma) for the Gaussian distribution are estimated along with the exponential distribution (tau) which reflects the tail or positive skew of the RT distribution.
DM estimation
Fast-DM (Voss & Voss, Reference Voss and Voss2007), which uses an iterative distribution fitting approach to compare the observed RT distribution to the distribution predicted to occur with specific parameter values, was used to estimate DM parameters. We allowed drift rate (v), boundary separation (a), non-decision time (t 0 ), and the variability of non-decision time (st 0 ) to vary between individuals. The relative starting point (z) was held constant at .5 indicating the absence of decisional bias. st 0 was modeled with the other parameters because it may improve overall model fits when fast guesses are present (Ratcliff & Tuerlinckx, Reference Ratcliff and Tuerlinckx2002). Other parameters (i.e., differences in speed of response execution, intertrial variability of starting point, intertrial variability of drift, and percentage of contaminants) were fixed at 0 given that they were unlikely to be reliably modeled with the number of trials available (Lerche et al., Reference Lerche, Voss and Nagler2017). Because both speed and accuracy are accounted for in DM, both correct and error RTs on Go-trials were used, reflecting the upper and lower boundaries of the model, respectively. Smaller absolute values of v indicate slower drift rates. Smaller values of a indicate greater speed-accuracy trade off. t 0 and st 0 are reported in seconds. Despite legitimate concerns with p-value cutoffs for participant exclusion there is currently no other consensus method, particularly in very large samples. Here, similar to others (Arnold et al., Reference Arnold, Broder and Bayen2015; Klatt et al., Reference Klatt, Schneider, Schubert, Hanenberg, Lewald, Wascher and Getzmann2020; Lerche et al., Reference Lerche, Neubauer and Voss2018), we relied on p-values and excluded participants (n = 4) based on a Kolmogorov–Smirnov fit statistic <.05 (see Supplemental Figure S1 for cumulative distribution plots).
Parameter recovery
Prior simulation studies have suggested that ex-Gaussian (Galloway-Long & Huang-Pollock, Reference Galloway-Long and Huang-Pollock2018), and DM parameters can be estimated with the number of trials available here, albeit with loss of precision for some parameters in the context of either slow or fast contaminants (Lerche et al., Reference Lerche, Voss and Nagler2017). Nonetheless, we conducted parameter recovery studies (Voss et al., Reference Voss, Nagler and Lerche2013). To assess parameter recovery with trial numbers available in the full task, 1,000 sets of values for (1) ex-Gaussian and (2) DM parameters were simulated using the mvrnorm function from the R MASS package. Simulated values were based on the observed means and covariance structure in the observed ABCD sample. Next, trial-level RT data for each of the 1,000 parameter sets was simulated using the rexgauss function from the R retimes package (ex-Gaussian) and the construct-samples tool from fast-dm (DM). Data sets included n = 261 (ex-Gaussian where only correct go-trials are used) or n = 300 Go-trials (DM where correct and incorrect trials are used). Parameter estimates were recovered from the simulated trial-level data using retimes or fast-dm. Bias was computed as the difference between the simulated and recovered parameters. Mean percent error, which indicates the signed average difference between simulated and recovered values as a function of the simulated parameter value, ranged from –1.1% to 0.2% for ex-Gaussian parameters and from –1.7 to 4.4% for DM parameters. Raw bias and mean percent error for all parameters are reported in Table S1 in the Supplement. We also considered correlations between simulated and recovered parameters, which we interpreted based on guidelines from White et al. (Reference White, Servant and Logan2018): r below .5 poor, 0.5 < r < 0.75 fair, 0.75 < r < 0.9 good, and r > 0.9 excellent. Parameter recovery was good to excellent for all parameters (see Table S2 and Figures S2–S5 in the Supplement for correlations and Q-Q plots of simulated and recovered parameters).
We repeated parameter recovery studies for: (1) run level and (2) block-level data to assess whether parameters could be adequately recovered at these lower trial numbers. Parameter recovery was good to excellent for ex-Gaussian parameters at both the run and block level (range r = .84–.97). Parameter recovery was good to excellent for diffusion model parameters at the run level (range r = .77–.90) and fair to good at the block level (range r = .63–.80). Additional details, Q-Q plots, and simulated-recovered parameter correlations are all available in the Supplement.
Analyses
Descriptive statistics for performance indices and their intercorrelations (Pearson) were estimated. To explore task performance over time, each of the SST indices was estimated for each of the two runs, and paired t-tests were run testing for differential performance across runs. Next, each SST run was divided into two equal blocks, and performance across the four blocks was tested for linear and quadratic trends. Note that SSRT was only computed for the whole task since the SSD algorithm adjusts across the whole task precluding unbiased SSRT computation across runs/blocks. To examine sex differences, t-tests were conducted comparing performance outcomes between males and females. Cohen’s d (Cohen, Reference Cohen1992) was calculated to estimate effect size.
Results
Overall performance
The mean accuracy on nonstop trials (i.e., correct discrimination of arrow directionality) was 87.8% (SD = 7.7%; range: 0.661–1.000). The mean SSRT for the sample was 985.87 ms (SD = 484.10; range: 2–2577). RT performance indices are presented in Table 1 (see Supplemental Figure S6 for distributions).
Table 1. Descriptive statistics
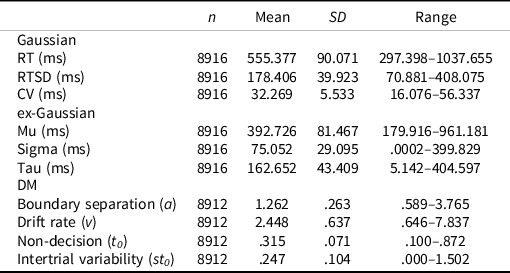
Note. RT = reaction time, RTSD = standard deviation of RT, CV = coefficient of variation, DM = diffusion model.
Intercorrelations
The large sample size resulted in statistically significant correlations between most of the accuracy, SSRT, and RT performance indices (Table 2; see Supplemental Figure S6 for scatterplots). Accuracy was moderately correlated with SSRT (r = -.46). Of the RT indices, CV (r = -.65) and v (r = .77) were most highly correlated with accuracy. v was most highly correlated with SSRT (r = -.41).
Table 2. Intercorrelations between RTV and SST performance indices
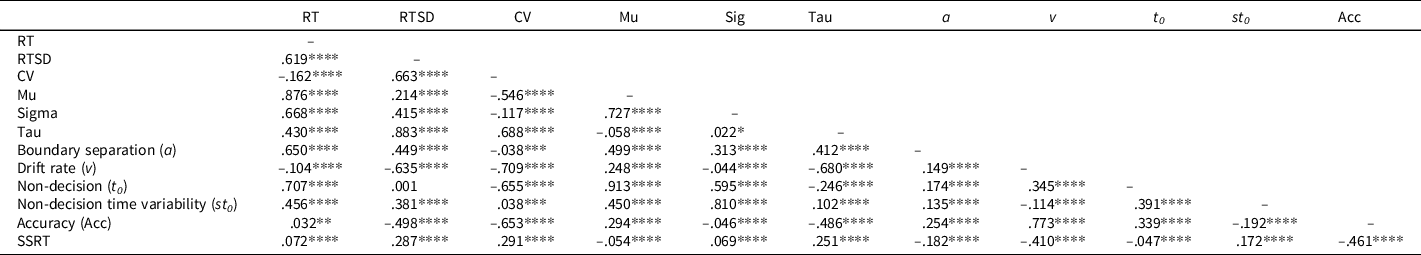
Note. RT = reaction time, RTSD = standard deviation of RT, CV = coefficient of variation, SSRT = stop-signal RT.
*p < .05; **p < .01; ***p < .001; ****p < .0001.
Parameters derived from the same models showed varying patterns of correlation. As would be expected, RTSD was correlated with RT (r = .62) and CV (r = .66). For ex-Gaussian parameters, sigma was highly correlated with mu (r = .73), but the magnitude of correlation between other parameters was small (all rs < .1). Although the DM indices were significantly intercorrelated, the magnitude of these correlations was modest (r = .35 for v and t 0 and all other rs < .18).
There were also strong intercorrelations among parameters across models. Mu correlated most highly with t 0 (r = .91), but also correlated moderately with st 0 (r = .45) and a (r = .50). Sigma correlated strongly with t 0 (r = .60) and st 0 (r = .81) and moderately with a (r = .31). Tau correlated strongly with v (r = -.68) and moderately with a (r = .41).
Finally, we considered relationships between Gaussian metrics and parameters from the other models. Ex-Gaussian parameters describing the normal part of the RT distribution (mu, sigma) correlated strongly with RT (rs = .67–.88) and moderately with RTSD (rs = .21-.41), whereas tau showed the opposite pattern (i.e., strongly correlated with RTSD, r = .88, and moderately with RT, r = .43). For DM parameters, v was strongly correlated with RTSD (r = -.64) but only weakly correlated with RT (r = -.10). In contrast, t 0 was strongly correlated with RT (r = .71) but uncorrelated with RTSD (r = .001). a was moderately correlated with both RT and RTSD (rs = .42–.67).
Performance across time
While performance indices were significantly correlated across runs (r=.45–.86), there were also significant performance decrements between the runs (Table 3). Accuracy worsened, MRT slowed, and both RTSD and CV increased on the second run compared to the first. On ex-Gaussian indicators, the largest effect was an increase in tau from run 1 to run 2. Mu decreased and sigma increased from run 1 to 2 but with small effects. On DM indicators, the largest effect was for slower v from run 1 to run 2, but faster t 0 and larger st 0 were also observed on the second run, compared to the first run.
Table 3. Performance across SST runs

Note. **p < .01; ****p < .0001; RT = reaction time, RTSD = standard deviation of RT, CV = coefficient of variation, DM = drift diffusion model.
The two runs were further divided into 4 blocks (2 per run) to more finely examine performance on the SST task. All performance indices demonstrated significant linear and quadratic trends across blocks (Table 4).
Table 4. Performance across SST blocks

Note. RT = reaction time, RTSD = standard deviation of RT, CV = coefficient of variation, DM = drift diffusion model.
*p <. 05; **p < .01; ****p < .0001.
For most indicators, there was a distinct pattern of worsening performance from the first half of run 1 to the second half of run 1. This was followed by a pattern of fairly comparable performance in the second half of run 1 to the first half of run 2 followed by a repeated pattern of worsening performance between the first and second half of run 2. Notably, performance during the first block of run 1 and the second block of run 2 (i.e., first and fourth blocks) was quite discrepant with mean estimates displaying more than a .5 SD decrement between these blocks for some variables (e.g., RTSD, CV, tau, v) (Figure 1). Indeed, it appears that the RTV indicators (RTSD: t = 28.28, p < .0001; CV: t = 25.67, p < .0001; tau: t = 21.33, p < .0001; and v: t = 20.79, p < .0001) were most susceptible to this pattern, as evidenced by significant linear and quadratic trends for these variables.
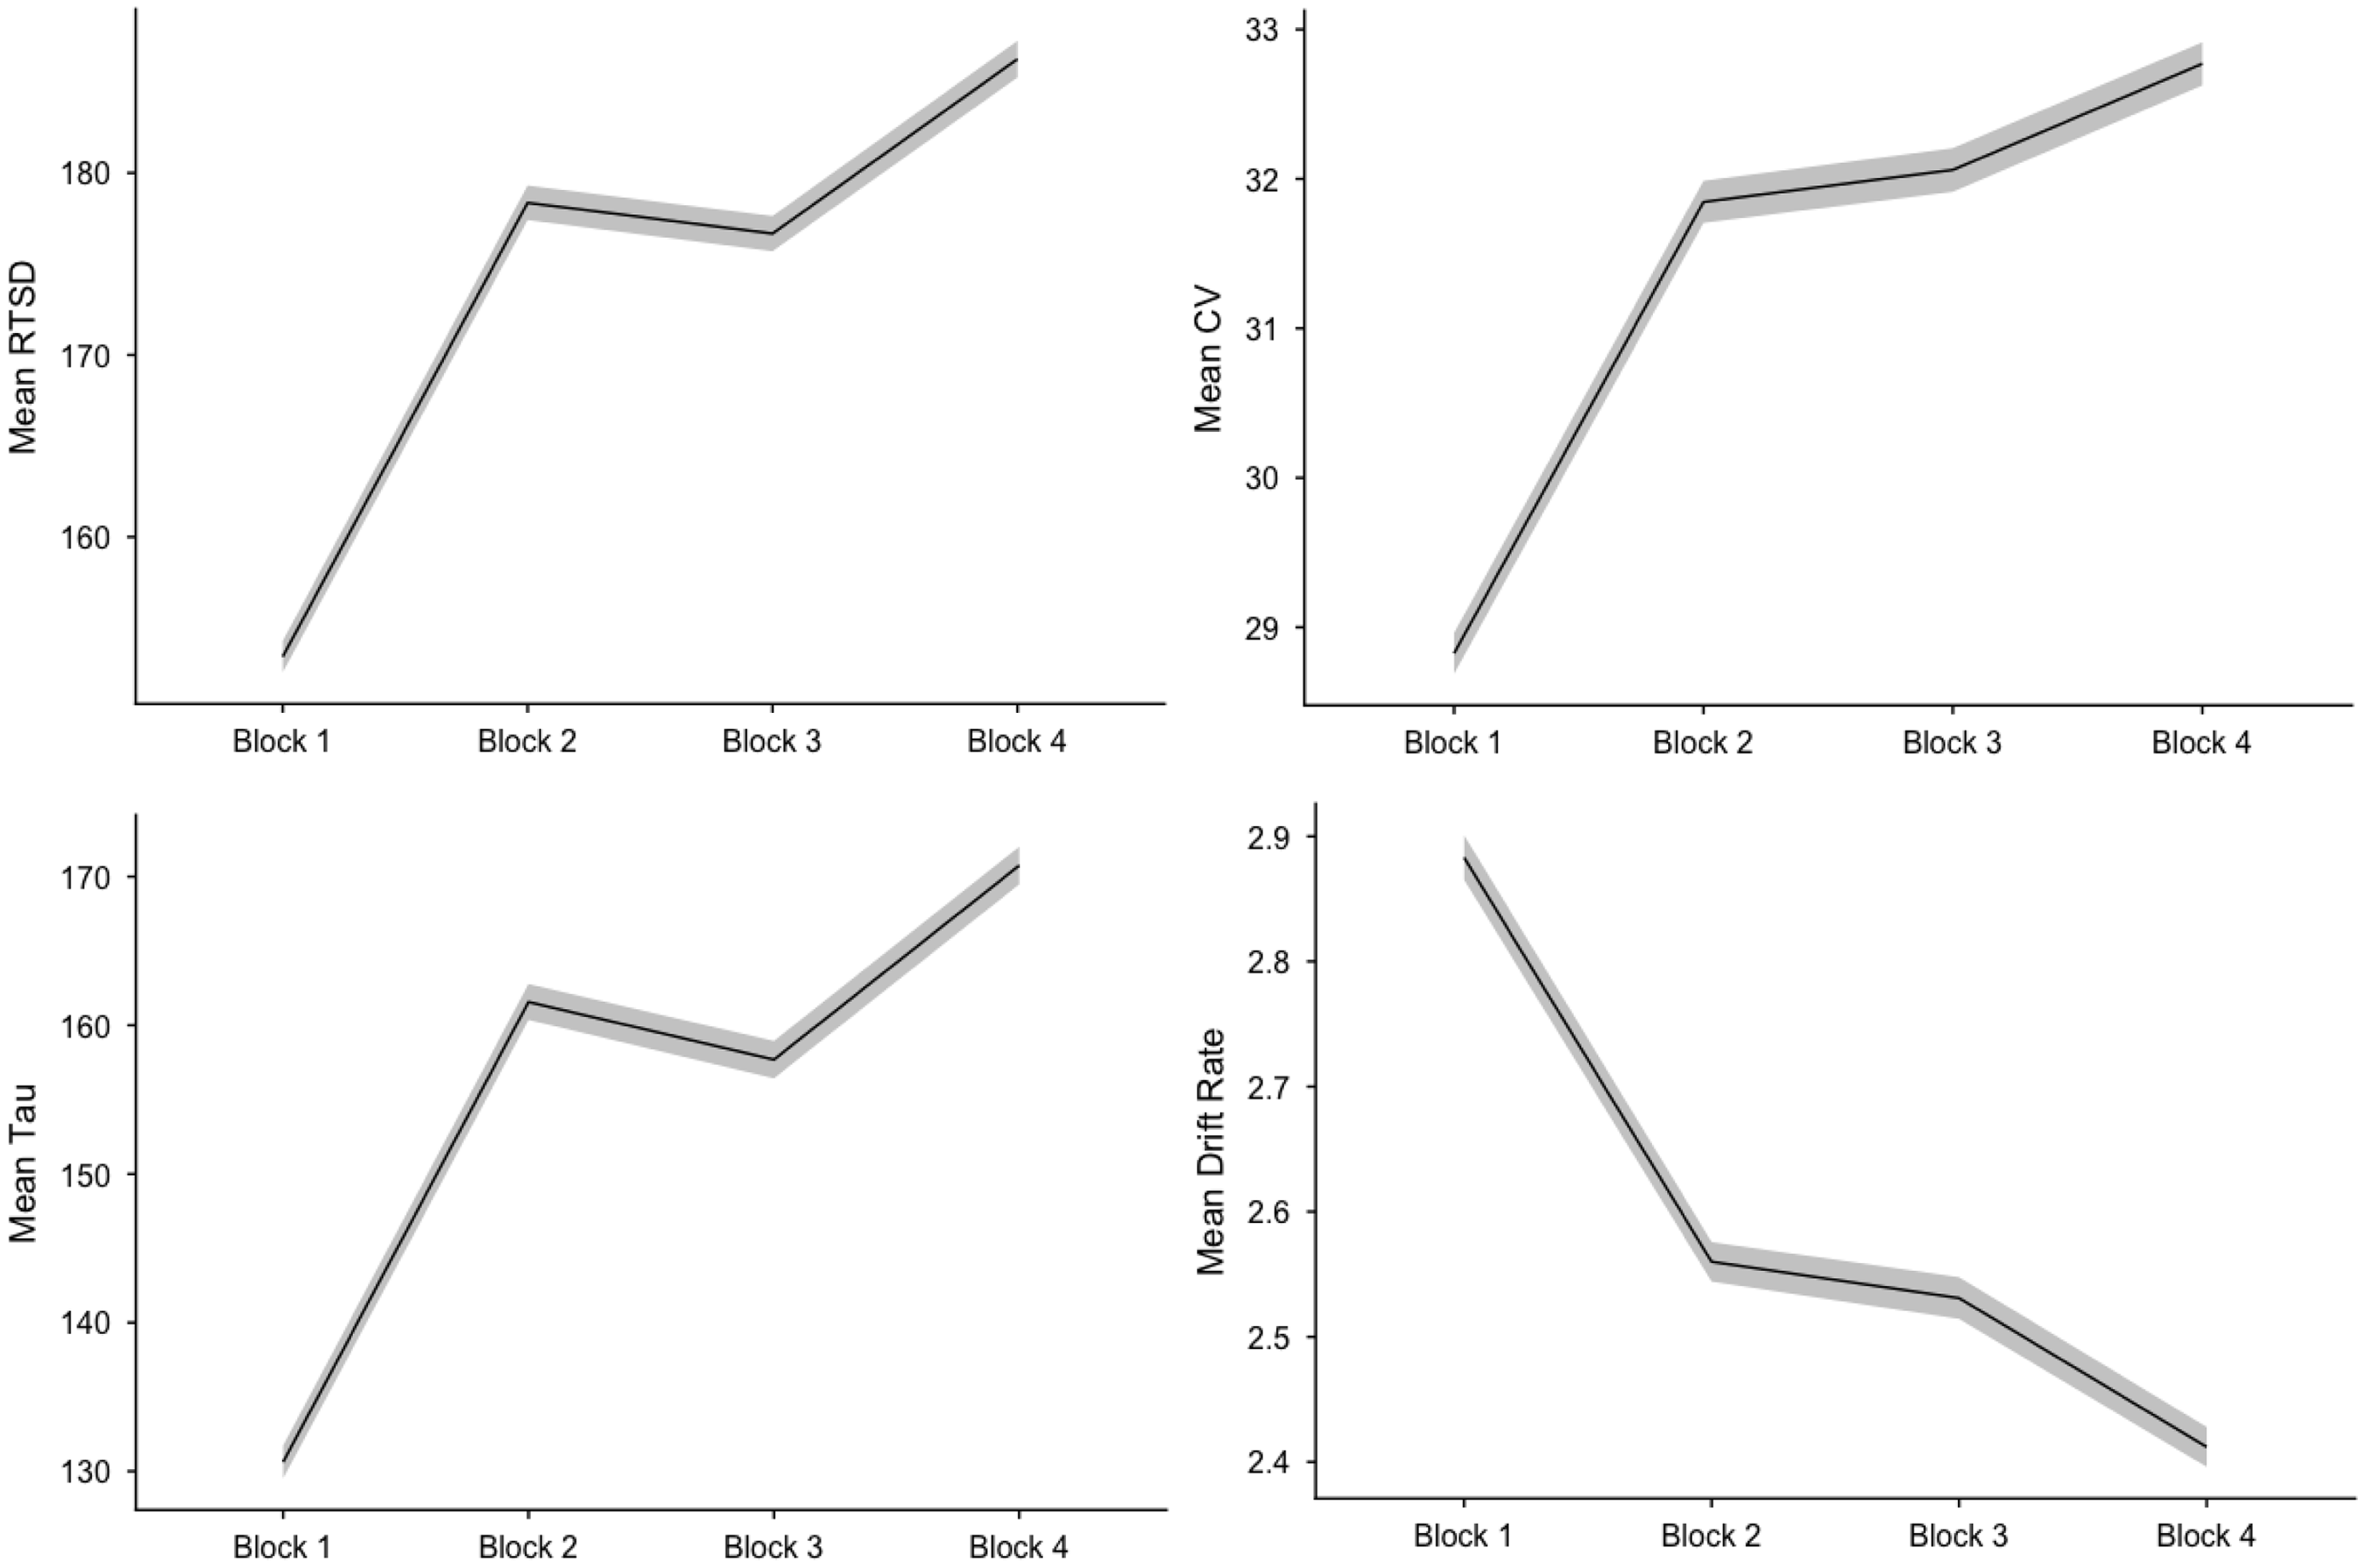
Figure 1. Performance across SST blocks. Shaded areas reflect 95% confidence interval. Note. RTSD = standard deviation of reaction time, CV = coefficient of variation.
Sex differences
Females were more accurate than males on go-trials (d = .09), but did not differ from males on SSRT (d = .01), see Table 5. Males were faster (RT; d = .39) and less variable (RTSD; d = .31) than females. However, for CV, which factors in the mean when estimating variability, no sex differences emerged (d = .00).
Table 5. Sex differences

Note. **** p < .0001, RT = reaction time, RTSD = standard deviation of RT, CV = coefficient of variation, DM = drift diffusion model, SSRT = stop-signal reaction time.
Interrogating further with ex-Gaussian indicators, females had higher mu (d = .28), sigma (d = .21), and tau (d = .28) than males, though all effect sizes were relatively small. Analyses of the DM indicators found a moderate effect size for higher a in females than males (d = .42), and smaller but reliable effects for faster v (d = .09), and slower, more variable t 0 (d = .14) and st 0 (d = .30) in females than males.
Discussion
The ABCD sample is unprecedented including its large sample, geographic, gender and racial/ethnic diversity, and comprehensive assessment of behavioral, cognitive, and neurophysiological functioning. While the SST is generally considered an inhibitory task, the large number of RTs collected on “go” trials also makes it conducive to characterizing individual’s RT distributions. Here, we capitalize on the unique ABCD sample to demonstrate that associations among RT parameters from common computational modeling approaches in middle childhood are similar to findings in adults. Such confirmation can guide integration of prior studies using disparate approaches and inform model selection for additional studies. We also demonstrate how computational modeling can clarify the processes contributing to change in performance over time, and cognitive mechanisms contributing to sex differences in RT and RTV in middle childhood.
This is one of the few studies applying multiple RTV approaches to the same data set in middle childhood, when relationships among model parameters are largely unknown. Correlations between DM and ex-Gaussian parameters are consistent with prior simulation studies (Matzke & Wagenmakers, Reference Matzke and Wagenmakers2009). Ex-Gaussian parameters correlated at least moderately with multiple DM parameters, suggesting the ex-Gaussian measures cannot be interpreted in terms of specific cognitive processes (Rieger & Miller, Reference Rieger and Miller2020), or at least not in terms of the specific processes reflected in DM parameters (Fitousi, Reference Fitousi2020).
Nonetheless, the strength of correlations among parameters varied in consistent ways. In particular, v correlated most strongly with tau, consistent with slowing drift rates having the greatest effect on the tail of the RT distribution (Ratcliff, Reference Ratcliff2006; Ratcliff & McKoon, Reference Ratcliff and McKoon2008). In line with prior simulations (Fitousi, Reference Fitousi2020; Matzke & Wagenmakers, Reference Matzke and Wagenmakers2009) t 0 was most strongly correlated with mu. st 0 was most strongly correlated with sigma. Taken together, results suggest that differences in nondecisional processing primarily affect the Gaussian portion of the RT distribution, while differences in speed and efficiency of decision processes are important contributors to the exponential features of RT distributions. Such associations support recent calls to use ex-Gaussian and DM models in conjunction by designing experiments where convergent patterns across models may help rule in or out specific interpretations (Fitousi, Reference Fitousi2020).
Relations between parameters and Gaussian measures were also informative. In particular, v was strongly correlated with RTSD but not RT, whereas t 0 and st 0 metrics were strongly correlated with RT but not RTSD. This suggests that higher RTSDs observed in prior studies may best be understood in terms of slow/inefficient information processing, whereas RT differences may be more related to differences in nondecisional processes such as encoding and motor response speed. Crucially, this interpretation differs from that applied in many clinical studies where slow MRTs are interpreted as reflecting primarily slow/inefficient information processing rather than motor (or other nondecisional) processing. Similarly, RTSD was most strongly correlated with tau, consistent with long RTs being a primary driver of RTSD (Tamm et al., Reference Tamm, Narad, Antonini, O’Brien, Hawk and Epstein2012). Tau is often interpreted in terms of attention lapses, but general slowing may result in similarly long tails at the upper end of the distribution (Ratcliff, Reference Ratcliff2006; Ratcliff & McKoon, Reference Ratcliff and McKoon2008). Investigations to explore the roles of general slowing and specific attention lapses in this developmental period are needed (Killeen, Reference Killeen2019; Unsworth et al., Reference Unsworth, Redick, Lakey and Young2010; Weigard et al., Reference Weigard, Huang-Pollock, Brown and Heathcote2018).
Questions about the role of general slowing in higher level executive processes, particularly in the context of developmental psychopathology, remain relevant. Recent evidence suggests that such task general processes may account for a wide range of impairments on higher level executive tasks (Weigard et al., Reference Weigard, Clark and Sripada2021; Weigard & Sripada, Reference Weigard and Sripada2021), and findings here support this possibility. Overall, RT and RTV correlations with SSRT were modest (r range = .04–.29), similar to prior SST studies (Lipszyc & Schachar, Reference Lipszyc and Schachar2010). However, SSRT and v were moderately correlated, suggesting a unique relationship between this indicator of general speed/efficiency of processing and inhibitory control. At least one prior study has similarly found that slower v mediates impairments in SSRT observed in some psychiatric disorders (Karalunas & Huang-Pollock, Reference Karalunas and Huang-Pollock2013), and more recent studies also suggest a general cognitive efficiency factor predicts top-down control in everyday life better than traditional lab-based measures of top-down control (Weigard et al., Reference Weigard, Clark and Sripada2021).
Large temporal within-task effects were observed across every index of performance. Consistent with large bodies of prior research on sustained attention using a variety of tasks (Conners et al., Reference Conners, Epstein, Angold and Klaric2003; Fortenbaugh et al., Reference Fortenbaugh, Rothlein, McGlinchey, DeGutis and Esterman2018; Huang-Pollock et al., Reference Huang-Pollock, Karalunas, Tam and Moore2012; Klein et al., Reference Klein, Wendling, Huettner, Ruder and Peper2006; Losier et al., Reference Losier, McGrath and Klein1996; Rosenberg et al., Reference Rosenberg, Noonan, DeGutis and Esterman2013; Sykes et al., Reference Sykes, Douglas and Morgenstern1973), children demonstrated slower RTs, more variable responding, and poorer accuracy with increasing time on task. Decrements in performance, especially between the first and last blocks, were substantial (i.e., >.5 SD in magnitude). Notably, children did not demonstrate worsening performance between the second block on run 1 and the first block of run 2, which may be partially due to the short break between runs.
Examination of ex-Gaussian and DM parameters further clarifies the processes contributing to performance changes over time. Mu decreased across time indicating faster responding (often associated with better performance). However, when taken together with the corresponding decreases in t 0 (associated with faster motor output), these changes in the RT distribution are likely indicative of increases in motor impulsivity. The largest time effects were increases in tau and decreases in v, suggesting worsening attention and slowed/less efficient information processing as time on task increased. The changes in v, in particular, are consistent with its association with arousal-related circuitry that includes the locus coeruleus-norepinephrine system (Aston-Jones & Cohen, Reference Aston-Jones and Cohen2005).
Cognitively, decrements in both tau and v over time are also consistent with attention depletion models. Such models suggest that sustaining attention is an effortful process and thus the likelihood of an attention lapse increases as time in an attentive state increases (Killeen, Reference Killeen2013). This may be particularly true when the attentional state must be endogenously maintained (e.g., when the participant must actively work to maintain attention to things that are not inherently interesting). Events that exogenously capture attention (e.g., novel stimuli) or provide breaks to endogenously maintain attentional states (e.g., breaks between runs) may serve to attenuate attention depletion (Killeen, Reference Killeen2013). Such effects would help explain why participants’ performances declined nonlinearly across blocks with performance levels remaining similar before and after the provided break.
We also used the broad range of RT and performance indices to examine sex differences in RT. Consistent with most previous research, males had faster RTs than females and females had more variable RTs than males. Notably, the effect sizes for both of these effects were small (RT: d = .39; RTSD: d = .31) but were still nearly double those observed in a prior meta-analysis (d = .17 across the lifespan; Silverman, Reference Silverman2006) and other large-scale studies of both SST (d = .23 across the lifespan; Williams et al., Reference Williams, Ponesse, Schachar, Logan and Tannock1999) and other tasks (e.g., Dykiert et al., Reference Dykiert, Der, Starr and Deary2012). In general, sex differences in RT and RTSD have been less consistently found in children than adults (Dykiert et al., Reference Dykiert, Der, Starr and Deary2012; Ghisletta et al., Reference Ghisletta, Renaud, Fagot, Lecerf and de Ribaupierre2018). This pattern of findings has led some investigators to propose that variability in RTs may be related to the effects of post-pubertal levels of estrogen in brain areas involved in the regulation of variability in information processing and attention (Deary & Der, Reference Deary and Der2005). However, the effects at young ages in the ABCD sample argue against such a possibility. Additional studies directly considering puberty will be important. The difference in size of effects here versus in prior studies may be related to differences in task demands between studies, geographic regions in which participants were recruited, or other factors. Regardless, in the largest sample of children to-date (larger than even the total samples available in meta-analytic studies), there appear to be small but reliable sex differences in RT.
An additional question is what may be causing these differences. It is notable that the observed sex differences in RT occurred in the context of females having higher accuracy than males, which suggests a slower speed for higher accuracy trade-off among females. Indeed, DM parameters confirm this conclusion. The largest effect size for sex differences across all of the performance measures was for a (d = .42), consistent with increased response caution (i.e., decreased speed-accuracy trade-off) contributing to slower RTs in females. Results confirm that similar findings on emotional decision-making tasks (Xu et al., Reference Xu, Hao, Chen, He, Jiang, Tian, Wang, Wang, Wang, Han, Tan, Men, Gao, He, Tao, Dong and Qin2021) may reflect more general response strategy, rather than specific effects of emotional context.
Females also had slower and more variable t 0 than males, confirming a body of research suggesting that differences in motor response speed may contribute to overall sex effects in RT (Era et al., Reference Era, Sainio, Koskinen, Ohlgren, Harkanen and Aromaa2011; Landauer et al., Reference Landauer, Armstrong and Digwood1980; Lynn & Ja-Song, Reference Lynn and Ja-Song1993). While both greater response caution and slower, more variable motor output are likely driving the Gaussian findings of slower and more variable RTs, these effects “hide” that females actually have equally strong or slightly faster processing speed/efficiency than males based on DM parameters. Similarly, ex-Gaussian parameters, which bear nonspecific relationships to cognitive processes, showed a consistent pattern of females performing more poorly than males without identifying the equal or better cognitive efficiency observed when using DM parameters. Thus, the analyses here not only clarify the processes underlying observed sex effects in RTs but also illustrate how important information may be lost in using performance metrics that do not adequately distinguish different components of cognitive processing.
Here, we demonstrate in the largest sample of children to-date that the patterns of correlations between different RT models are similar in middle childhood to those observed in adults on a task with integrated inhibitory control demands. Additional studies using paradigms without inhibitory demands will be informative. Understanding these patterns can guide integration of prior studies using a single RT model, as well as parameter selection in future studies. Further, we confirm the presence of small but reliable sex differences in RT. We demonstrate that computational models can be used to characterize the processes underlying these differences—greater response caution and slower motor output in females. Importantly, we also show that the use of parameters that do not adequately differentiate cognitive processes may miss important information, such as the equally strong or better cognitive efficiency observed in females as compared to males, despite slower and more variable RTs based on Gaussian indicators. Similar models and approaches are likely to be informative for future studies focused on the association of the various RTV metrics with behavioral correlates (e.g., ratings of emotion/behavior or neurocognitive task performance) and within children diagnosed with various disorders (e.g., ADHD). Relatedly, additional studies examining the association of intrinsic brain activity with various RTV metrics will be important for clarifying the functional and clinical significance of RTV as a biomarker of attentional functioning.
Supplementary material
For supplementary material accompanying this paper visit https://doi.org/10.1017/S1355617722000431
Acknowledgements
We are grateful to Alex Weigard who provided very helpful constructive feedback on earlier versions of the manuscript.
Author contributions
Jeff Epstein: Conceptualization, Investigation, Methodology, Writing – Original draft preparation, review and editing, Funding acquisition. Sarah Karalunas: Conceptualization, Investigation, Methodology, Writing – Original draft preparation, review and editing, Formal analysis, Visualization, Validation, Funding acquisition. Leanne Tamm: Conceptualization, Writing – Original draft preparation, review and editing, Funding acquisition. Jon Dudley: Conceptualization, Investigation, Methodology, Data Curation, Visualization, Writing – Review and editing, Funding acquisition. James Lynch: Visualization, Writing – Review and editing. Mekibib Altaye: Conceptualization, Investigation, Methodology, Software, Data Curation, Writing – Review and editing, Funding acquisition. John Simon: Investigation, Methodology, Software, Data Curation, Writing – Review and editing. Tom Maloney: Investigation, Methodology, Software, Data Curation, Writing – Review and editing. Gowtham Atluri: Conceptualization, Writing – Review and editing, Funding acquisition.
Funding statement
The research reported here was supported by the National Institute of Mental Health (NIMH; 1 R01 MH123831-01). Data used in the preparation of this article were obtained from the Adolescent Brain Cognitive DevelopmentSM (ABCD) Study (https://abcdstudy.org), held in the NIMH Data Archive (NDA). This is a multisite, longitudinal study designed to recruit more than 10,000 children aged 9–10 years and follow them over 10 years into early adulthood. The ABCD Study® is supported by the National Institutes of Health (NIH) and additional federal partners under award numbers U01DA041048, U01DA050989, U01DA051016, U01DA041022, U01DA051018, U01DA051037, U01DA050987, U01DA041174, U01DA041106, U01DA041117, U01DA041028, U01DA041134, U01DA050988, U01DA051039, U01DA041156, U01DA041025, U01DA041120, U01DA051038, U01DA041148, U01DA041093, U01DA041089, U24DA041123, U24DA041147. A full list of supporters is available at https://abcdstudy.org/federal-partners.html. A listing of participating sites and a complete listing of the study investigators can be found at https://abcdstudy.org/consortium_members/. ABCD consortium investigators designed and implemented the study and/or provided data but did not necessarily participate in the analysis or writing of this report. This manuscript reflects the views of the authors and may not reflect the opinions or views of the NIH or ABCD consortium investigators. The ABCD data repository grows and changes over time. The ABCD data used in this report came from ABCD Curated Annual Release 3.0 (10.15154/1519007). Some of the data from this study (10.15154/1521162) have been shared on the NDA in accordance with National Institutes of Health (NIH) guidelines. The collection title is using Variance Time course Analyses with Stop Signal Data in the ABCD.
Conflicts of interest
None.


 Open access