


INTRODUCTION
Megafauna includes mammals that weigh >45 kg and can have an important ecological role in shaping habitats and entire ecosystems (Martin and Klein, Reference Martin, Klein, Martin and Klein1984; Mills et al., Reference Mills, Soulé and Doak1993; Gill et al., Reference Gill, Williams, Jackson, Lininger and Robinson2009). Megafauna can modify vegetation composition (Gordon et al., Reference Gordon, Rion, Allin, Greve and Svenning2021), influence seed dispersal (Peres et al., Reference Peres, Emilio, Schietti, Desmoulière and Levi2016), maintain grass versus woody cover (Sankaran et al., Reference Sankaran, Hanan, Scholes, Ratnam, Augustine, Cade and Gignoux2005), change soil carbon storage (Derner et al., Reference Derner, Boutton and Briske2006; Wigley et al., Reference Wigley, Augustine, Coetsee, Ratnam and Sankaran2020) and suppress fire activity (Waldram et al., Reference Waldram, Bond and Stock2008). In modern savannas, antelope-induced grazing suppresses grass and tree growth (Staver and Bond, Reference Staver and Bond2014) while rhinos can limit fire activity by feeding on grasses and controlling fuel build up (Waldram et al., Reference Waldram, Bond and Stock2008). Pleistocene megafauna likely played similar roles in the ecosystems they inhabited (Johnson, Reference Johnson2009).
A large proportion of megafauna species went extinct on all continents during the Pleistocene (Barnosky et al., Reference Barnosky, Koch, Feranec, Wing and Shabel2004). Given their ecological importance, the consequences of these Pleistocene extinctions are thought to be significant (Johnson, Reference Johnson2009; Malhi et al., Reference Malhi, Doughty, Galetti, Smith, Svenning and Terborgh2016). South America lost an estimated 80% of its megafauna, including ground sloths (Megatherium americanum) and glyptodons (Glyptodon clavipes) (Barnosky et al., Reference Barnosky, Koch, Feranec, Wing and Shabel2004; Wroe et al., Reference Wroe, Field, Fullagar and Jermin2004; Lima-Ribeiro and Diniz-Filho, Reference Lima-Ribeiro and Diniz-Filho2013). Despite experiencing one of the most significant declines of megafauna species, information about South American megafaunal extinctions remains limited.
The timing of the Pleistocene megafaunal extinction in South America is yet to be determined because records are scarce (e.g., Elias and Schreve, Reference Elias, Schreve and Elias2007; Rozas-Dávila et al., Reference Rozas-Dávila, Valencia and Bush2016; Raczka et al., Reference Raczka, Bush and De Oliveira2018, 2019). In North America, robust archaeological evidence suggests the timing of megafaunal extinction between 11,500–11,000 years ago (Barnosky et al., Reference Barnosky, Koch, Feranec, Wing and Shabel2004). However, extinctions may have occurred earlier, between 14,000–12,700 cal yr BP (calibrated years before present, hereafter BP) (Robinson et al., Reference Robinson, Pigott Burney and Burney2005; Gill et al., Reference Gill, Williams, Jackson, Lininger and Robinson2009, 2012; Perrotti, Reference Perrotti2018). In South America, the extinction window has been suggested to have occurred between 15,000–10,000 years ago (Barnosky et al., Reference Barnosky, Koch, Feranec, Wing and Shabel2004). The limited records available suggest variability in megafaunal extinction timings. In the Peruvian Andes, researchers found the local extinction occurring as early as 15,800 BP (Rozas-Dávila et al., Reference Rozas-Dávila, Valencia and Bush2016), whereas in the Ecuadorian Andes extinction was recorded by 12,800 BP (Raczka et al., Reference Raczka, Mosblech, Giosan, Valencia, Folcik, Kingston, Baskin and Bush2019). This timing is similar to the extinction recorded in the Brazilian cerrado, which was reached by 12,000 BP (Raczka et al., Reference Raczka, Bush and De Oliveira2018). However, in Argentina and Brazil, fossilised megafauna bones have been dated to the Early Holocene and as late as 6555 14C yr BP (calibrated to ca. 7400 cal yr BP) (Borrero et al., Reference Borrero, Zarate, Miotti and Massone1998; Steadman et al., Reference Steadman, Martin, MacPhee, Jull, McDonald, Woods, Iturralde-Vinent and Hodgins2007), thus suggesting an Early Holocene survival of some megafauna (Neves and Piló, Reference Neves and Piló2003). The available information in South America results in a broad range for the timing of Pleistocene megafaunal decline between 15,800–7400 BP.
Late Pleistocene megafaunal extinctions likely had significant ecological consequences on the ecosystems we know today. The extinction of the megafauna in North America possibly led to the formation of flora without modern analogues and increased fire activity (Gill et al., Reference Gill, Williams, Jackson, Lininger and Robinson2009, 2012). In the Peruvian Andes, the collapse of megafauna was followed by a rise in fire activity and species turnover (Rozas-Dávila et al., Reference Rozas-Dávila, Valencia and Bush2016). In the Brazilian cerrado, the ecosystem remained largely stable but showed an increase in some palatable species (Raczka et al., Reference Raczka, Bush and De Oliveira2018). However, the ecological consequences of extinctions in other high-biodiversity regions in South America and whether these were habitat-specific remains unclear.
Fossilised bones of megafauna provide accurate dating; however, they are rare, isolated, and often geographically concentrated (Johnson et al., Reference Johnson, Rule, Haberle, Turney, Kershaw and Brook2015; van Asperen et al., Reference van Asperen, Perrotti, Baker, Marret, O'Keefe, Osterloff, Pound and Shumilovskikh2020). The use of spores of coprophilous fungi (SCF) to indicate megafaunal presence can circumvent these limitations because they preserve well in stratigraphic units where chronological frameworks can be built (van Geel et al., Reference van Geel, Zazula and Schweger2007, Reference van Geel, Guthrie, Altmann, Broekens, Bull, Gill, Jansen, Nieman and Gravendeel2011; Lee et al., Reference Lee, van Geel and Gosling2022). SCF grow and reproduce on herbivore feces, making them reliable indicators for the presence/absence and abundance of megafauna (Davis and Shafer, Reference Davis and Shafer2006; Wood and Wilmshurst, Reference Wood and Wilmshurst2013; Johnson et al., Reference Johnson, Rule, Haberle, Turney, Kershaw and Brook2015). Furthermore, SCF can be found in conjunction with other palaeoecological proxies, including pollen and charcoal, providing information on the consequences of megafaunal extinctions on vegetation and fire activity (Raczka et al., Reference Raczka, Bush and De Oliveira2018; van Asperen et al., Reference van Asperen, Perrotti, Baker, Marret, O'Keefe, Osterloff, Pound and Shumilovskikh2020). Since first proposed as a proxy for Pleistocene megafaunal abundance (Davis, Reference Davis1987), Sporormiella-type spores have been the dominant source of information for reconstructing Pleistocene megafaunal extinction. However, other SCF can reflect the presence of megafauna (Perrotti and van Asperen, 2019). In fact, the sum of all SCF may provide the most reliable measure for megafaunal presence and enhance the interpretation of palaeoecological spore records (Conroy et al., Reference Conroy, Baker, Jones, van Hardenbroek, Hopla, Collier, Lister and Edwards2020). Despite the information provided by SCF, just a handful of studies in South America have used SCF to reconstruct Pleistocene megafaunal presence (Rozas-Dávila et al., Reference Rozas-Dávila, Valencia and Bush2016; Raczka et al., Reference Raczka, Bush and De Oliveira2018; Pino et al., Reference Pino, Abarzúa, Astorga, Martel-Cea, Cossio-Montecinos, Navarro and Lira2019; Raczka et al., Reference Raczka, Mosblech, Giosan, Valencia, Folcik, Kingston, Baskin and Bush2019). However, these studies have relied on Sporormiella as the only SCF indicative of megafaunal presence.
Here we present the first investigation of the timing and ecological consequences of megafaunal declines from Monquentiva—a diverse ecosystem in the eastern Colombian Cordillera. We analysed a well-dated sedimentary record for pollen and charcoal and used a multi-species SCF approach to investigate the timing and ecological consequences of megafaunal declines on the vegetation and fire activity of the eastern Andes of Colombia.
STUDY AREA
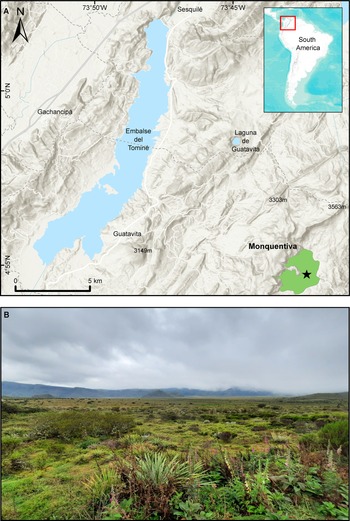
Pantano de Monquentiva (hereafter Monquentiva) is a peat bog that lies in the high Andean slopes of the eastern Colombian Cordillera within the Vista Hermosa Regional Natural Park (4°54′N, 73°45′W) (Fig. 1). The site is found in the jurisdiction of the Municipality of Guatavita, Cudinamarca, ~50 km northeast of the city of Bogotá. Monquentiva lies in an altitudinal strip between 2900–3500 m above sea level (m asl). Despite this elevation, the site is a relatively flat oval area, with slopes <5° (Espinoza et al., Reference Espinoza, Franco-Gaviria, Castañeda, Robinson, Room, Berrío, Armenteras and Urrego2022). Small streams on the eastern side of the mountain range contribute to the site's hydrology, which feeds into the Orinoco River basin (Avella-M et al., Reference Avella-M, Torres, Gómez and Pardo2014). During pre-Hispanic times, Monquentiva was prone to flooding and may have contained a water body (Avella-M et al., Reference Avella-M, Torres, Gómez and Pardo2014; Espinoza et al., Reference Espinoza, Franco-Gaviria, Castañeda, Robinson, Room, Berrío, Armenteras and Urrego2022). The contemporary peat bog underwent transformations through the establishment of colonial drainage systems for livestock (Gomez and Rubio, Reference Gomez and Rubio2003; Avella-M et al., Reference Avella-M, Torres, Gómez and Pardo2014). The shape and position of Monquentiva are controlled by the Río Blanco-Machetá Anticline fold and Machetá fault (Kammer et al., Reference Kammer, Piraquive, Gómez, Mora, Velásquez, Gómez and Mateus-Zabala2020; Espinoza et al., Reference Espinoza, Franco-Gaviria, Castañeda, Robinson, Room, Berrío, Armenteras and Urrego2022) built upon sedimentary Cretaceous rocks (Kammer et al., Reference Kammer, Piraquive, Gómez, Mora, Velásquez, Gómez and Mateus-Zabala2020).

Figure 1. Location of the study site. (A) Map of Pantano de Monquentiva (green polygon), Colombia (red square). The black star shows the location of the coring site. (B) Field photograph of the Monquentiva peat bog; photo taken by Pym, 2022.
Monquentiva is characterised by a low 11°C mean annual temperature (CAR, 2007; Rojas et al., Reference Rojas, Arce, Peña, Boshell and Ayarza2010). The mean annual precipitation is 1425 mm, with a unimodal regime of heaviest rainfall between April and November (CAR, 2007; Avella-M et al., Reference Avella-M, Torres, Gómez and Pardo2014). The main climatic factors influencing Monquentiva are the annual migration of the Intertropical Convergence Zone (ITCZ) bringing moisture from the Amazon and the Atlantic Ocean, and the irregular variation in winds and sea surface temperatures associated with the El Niño-Southern Oscillation (ENSO) (Poveda et al., Reference Poveda, Mesa, Salazar, Arias, Moreno, Vieira, Agudelo, Toro and Alvarez2005, Reference Poveda, Waylen and Pulwarty2006). The topography of the Andean mountain range also plays an influential role. This orographic barrier interrupts the easterly airflows from the Amazon basin, forcing the airflows to rise and cover the slopes of the eastern Andean flank with fog (Poveda et al., Reference Poveda, Mesa, Salazar, Arias, Moreno, Vieira, Agudelo, Toro and Alvarez2005).
The climate, geographical location, and topography of Monquentiva favour a mosaic of vegetation and concentration of biodiversity along a narrow altitudinal gradient in which the High Andean Forest, Subpáramo, and Páramo are the most abundant vegetation types (Avella-M et al., Reference Avella-M, Torres, Gómez and Pardo2014; Espinoza et al., Reference Espinoza, Franco-Gaviria, Castañeda, Robinson, Room, Berrío, Armenteras and Urrego2022). High Andean forest is the most represented vegetation surrounding Monquentiva today (76%), where Weinmannia and Clusia dominate (Avella-M et al., Reference Avella-M, Torres, Gómez and Pardo2014). Other abundant arboreal genera include Brunellia, Clethra, Drimys, Hedyosmum, Ternstroemia, and Vallea (Rangel-Ch, Reference Rangel-Ch, Churio and Orlando2000; Avella-M et al., Reference Avella-M, Torres, Gómez and Pardo2014). The Subpáramo is represented by shrubs including Aragoa, Arcytophyllum, Diplostephium, Hypericum, Gaultheria, Paepalanthus, and Puya (Avella-M et al., Reference Avella-M, Torres, Gómez and Pardo2014). The Páramo vegetation represents >20% of the flora in Monquentiva and contains various vegetation types in which grasses and herbs dominate (Avella-M et al., Reference Avella-M, Torres, Gómez and Pardo2014). Poaceae (primarily Calamagrostis) is the largest component of the Páramo (Rangel-Ch, Reference Rangel-Ch, Churio and Orlando2000; Avella-M et al., Reference Avella-M, Torres, Gómez and Pardo2014).
Monquentiva's ecological richness and the abundance of palatable plant species make the site an attractive habitat for extant megafauna. This includes species of megafauna that survived the Pleistocene extinction, such as the white-tailed deer (Odocoileus virginianus), Brocket deer (Mazama pita), and Andean bear (Tremarctos ornatus) (Cooke, Reference Cooke1998; García-Rangel, Reference García-Rangel2012; Martínez-Polanco, Reference Martínez-Polanco2019). Known macrofaunal evidence for extinct Pleistocene megafauna in Colombia is concentrated in the Cundinamarca department (Barnosky and Lindsey, Reference Barnosky and Lindsey2010). In Bogotá, skeletal records of Mastodons (Haplomastondon) have been dated between ca. 40,000–15,000 years BP (van der Hammen and Correal Urrego, Reference van der Hammen and Correal Urrego1978). Megafaunal remains have also been found in Tocaima, an archaeological site at 340 m asl (Correal Urrego, Reference Correal Urrego1993; Correal Urrego et al., Reference Correal Urrego, Olano, Calderón and Cardozo2005; Alfonso-Rojas et al., Reference Alfonso-Rojas, Herrera-Gutierrez, Suárez, Ciancio, Pelegrin and Cadena2021). Here, bones of gomphotheres (Notiomastodon platensis) and bone fragments of giant ground sloths (Eremotherium) have been recovered. These faunal remains and records of other gomphotheres (Cuvieronius and Stegomastodon) from Tibitó (~2500 m asl) provide evidence for a diverse Late-Pleistocene megafaunal presence in Colombia (Correal Urrego, Reference Correal Urrego1981; Prado et al., Reference Prado, Alberdi, Azanza, Sánchez and Frassinetti2005; Borrero, Reference Borrero and Haynes2009; Alfonso-Rojas et al., Reference Alfonso-Rojas, Herrera-Gutierrez, Suárez, Ciancio, Pelegrin and Cadena2021). However, at higher elevations, such as Monquentiva, no macrofaunal remains have been reported in the literature.
MATERIAL AND METHODS
Core collection and sampling
A 3.65 m sediment core was recovered from Monquentiva using a modified Livingston piston corer (Colinvaux et al., Reference Colinvaux, De Oliveira and Moreno1999) in 2019. The core was transported in sealed aluminium tubes to the Tropical Palaeoecology Laboratory at the University of Exeter. Subsequently, the cores were open lengthwise and stored at 4°C. The Troels-Smith method (Kershaw, Reference Kershaw1997) was used to describe stratigraphic units in the four 1-m sections. Sixteen bulk sediment samples were extracted and sent to the radiocarbon dating facility at the Queen's University Belfast for 14C dating (Table 1). The intervals for 14C dating were selected by visual analysis of stratigraphic changes and by distributing equally other dated intervals in the whole core. A general outlier model (Ramsey, Reference Ramsey2009b) was used to detect outlying ages using Oxcal v.4.4 (Ramsey, Reference Ramsey2009a). A chronological model was built using the Bacon package v.2.3.9.1 (Blaauw and Christen, Reference Blaauw and Christen2013) within R (R Core Team, 2021) using acc.mean = 200 yr/cm and acc.shape = 1.5 as priors (Fig. 2). Radiocarbon dates were calibrated using the IntCal20 calibration curve (Reimer et al., Reference Reimer, Austin, Bard, Bayliss, Blackwell, Ramsey and Butzin2020).

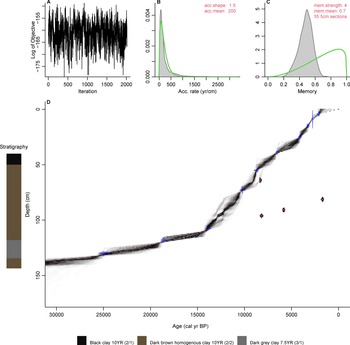
Figure 2. Bayesian age-depth model and stratigraphic descriptions for the Monquentiva core. The inset figures show the models: (A) Markov Chain Monte Carlo (MCMC) iterations; (B) distributions for the accumulation rate (Bacon MCMC iterations estimates the accumulation rate in years/cm; so more correctly, sedimentation times); (C) the memory of variability; and (D) the calibrated 14C dates (transparent blue) and the age-depth model; red curve shows the ‘best’ model based on the weighted mean age for each depth. The filled red radiocarbon dates represent the outliers identified using Oxcal analysis (Ramsey, Reference Ramsey2009a, Reference Ramseyb). Stratigraphic descriptions include Munsell colour notations (Munsell Color, 1992).
Table 1. Radiocarbon ages (14C) from organic lake sediments and calibrated ages (cal yr BP, IntCal20, Reimer et al., Reference Reimer, Austin, Bard, Bayliss, Blackwell, Ramsey and Butzin2020) for the Monquentiva core. Calibrated ranges are rounded to the nearest 10 years.
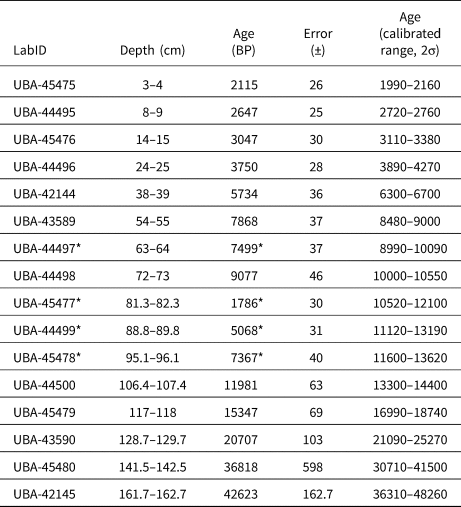
* Indicates ages identified as outliers using Oxcal analysis (Ramsey, Reference Ramsey2009a, b).
To cover the Late Pleistocene and Early Holocene this study focused on the upper two drives, Drive 1 (40–77 cm) and Drive 2 (78.1–137.1 cm) of the Monquentiva-I sediment core. Volumetric samples of 1 cm3 were extracted for fungal spore quantification between 40–137.1 cm at 1 cm intervals. Samples of 1 cm3 for charcoal and 0.5 cm3 for pollen were also extracted at 1 cm intervals between 40–137.1 cm core depth. Five samples at the top of drive 2 were restored to the top of drive 1 after 14C ages revealed they represented Holocene sediment. Locked pistons generally do not slip when pushed through lake mud (Colinvaux et al., Reference Colinvaux, De Oliveira and Moreno1999) and sediment mixing is rare. However, maintaining an efficient core seal is complex and, in this case, pressure may have released the rubber seal of the piston (Colinvaux et al., Reference Colinvaux, De Oliveira and Moreno1999; Last and Smol, Reference Last and Smol2002) resulting in Holocene sediments being collected at the top of drive 2.
Laboratory analysis
Fungal spores were prepared following a modified version of Fægri et al. (Reference Fægri, Kaland and Krzywinski1989). This modification removed acetolysis, which can cause spore deterioration (van Asperen et al., Reference van Asperen, Kirby and Hunt2016). In each sample, a Lycopodium tablet with a known number of spores (Batch 1031; 20,848 ± 691 spores/tablet) was added for SCF and pollen analysis. The Lycopodium spike was used to calculate concentrations per volume (Stockmarr, Reference Stockmarr1971). Percentages were calculated based on the total pollen assemblage (hereafter %TPA). SCF treatment included 10% HCl and 10% KOH, warming in a 90°C ultrasonic bath, sieving at 180 μm, density separation using sodium metatungstate Na6(H2W12O40) at 1.9–2.0 grams/litre, and suspending in glycerol (van Asperen et al., Reference van Asperen, Kirby and Hunt2016). Spores and pollen were identified using a Zeiss Axioskop light microscope at 400× and 1000× magnification. All fungal spores were quantified until 300 Lycopodium were counted per sample (Etienne and Jouffrey-Bapicot, Reference Etienne and Jouffroy-Bapicot2014).
The fungal spore quantification included the commonly used Sporormiella taxon and other identifiable spores of coprophilous, semi-coprophilous, and non-coprophilous taxa. Spore identification was conducted using published descriptions, fungal keys, and published images (van Geel et al., Reference van Geel, Buurman, Brinkkemper, Schelvis, Aptroot, van Reenen and Hakbijl2003; Cugny et al., Reference Cugny, Mazier and Galop2010; Guarro et al., Reference Guarro, Gené, Stchigel and Figueras2012; Revelles et al., Reference Revelles, Burjachs and van Geel2016; Loughlin et al., Reference Loughlin, Gosling and Montoya2018). Where identification at a particular taxonomic level became difficult, spores were assigned to their closest morphotype (van Asperen et al., Reference van Asperen, Perrotti, Baker, Marret, O'Keefe, Osterloff, Pound and Shumilovskikh2020). Spore morphotypes were assigned to their primary substrate following existing associations (Perrotti and van Asperen, Reference Perrotti and van Asperen2019; van Asperen et al., Reference van Asperen, Perrotti, Baker, Marret, O'Keefe, Osterloff, Pound and Shumilovskikh2020).
The pollen and charcoal records were used to assess vegetation changes and past fire activity. Pollen and charcoal were recorded in separate samples selected from the same stratigraphic levels as samples for SCF analysis. These samples were prepared following their respective standard protocols (Fægri et al., Reference Fægri, Kaland and Krzywinski1989; Whitlock and Larsen, Reference Whitlock, Larsen, Smol, Birks, Last, Bradley and Alverson2002). Pollen sums of 300 pollen grains per sample were identified and described using keys and descriptions for Andean vegetation (Hooghiemstra, Reference Hooghiemstra1984; Colinvaux et al., Reference Colinvaux, De Oliveira and Moreno1999; Bush and Weng, Reference Bush and Weng2006; Velásquez et al., Reference Velásquez, Jojoa, Restrepo, Vergara, Samboni and Castañeda2022) and modern reference material archived in the tropical pollen reference collection at the University of Exeter. The ecological and habitat affinities of pollen taxa were extracted from the literature (e.g., van der Hammen and González, Reference van der Hammen and González1960; Hooghiemstra, Reference Hooghiemstra1984; Marchant et al., Reference Marchant, Almeida, Behling, Berrio, Bush, Cleef and Duivenvoorden2002; Bernal et al., Reference Bernal, Gradstein and Celis2019; Espinoza et al., Reference Espinoza, Franco-Gaviria, Castañeda, Robinson, Room, Berrío, Armenteras and Urrego2022). Charcoal particles were sieved to retain fragments >180 μm (macroscopic) and 106–63 μm (microscopic). The size fractions were determined by sieve size availability and closely followed the size fraction standards in charcoal analysis (Whitlock and Larsen, Reference Whitlock, Larsen, Smol, Birks, Last, Bradley and Alverson2002). The retained particles were manually separated and photographed using a Zeiss Stemi stereo microscope at 50× magnification. Subsequently, charcoal area and raw counts (Clark and Patterson, Reference Clark, Patterson, Clark, Cachier, Goldammer and Stocks1997; Halsall et al., Reference Halsall, Ellingsen, Asplund, Bradshaw and Ohlson2018) were extracted using image analysis in ImageJ software (Abràmoff et al., Reference Abràmoff, Magalhães and Ram2004). Stratigraphic diagrams of SCF, selected pollen taxa, and charcoal were plotted using C2 v.1.7.7 (Juggins, Reference Juggins2007).
Quantitative analysis
Pearson correlation coefficients were calculated among all identifiable SCF at the 0.01 and 0.05 levels of significance (Supplementary Table 2) using SPSS (IBM Corp, 2020). SCF that showed positive and significant correlations were grouped to create a multi-species group of key SCF associated with megafaunal presence (Dix and Webster, Reference Dix and Webster1995; Johnson et al., Reference Johnson, Rule, Haberle, Turney, Kershaw and Brook2015; Perrotti and van Asperen, Reference Perrotti and van Asperen2019). Confidence limits were calculated for the key SCF concentrations to assess uncertainty linked to sampling effort (Maher, Reference Maher1981, p. 179). A sequential t-test analysis of regime shifts (STARS) (Rodionov, Reference Rodionov2004) was performed using key SCF concentrations to identify statistically significant deviations in megafaunal abundance. The analysis utilised a regime shift index (hereafter RSI) to quantify the size of the regime shift (Rodionov and Overland, Reference Rodionov and Overland2005) and was calculated using a cut-off length l = 4 and probability level p = 0.05. STARS analysis was deployed using the R package rshift (Room et al., Reference Room, Franco-Gaviria and Urrego2022). Canonical correspondence analysis (CCA) (Oksanen, Reference Oksanen2009) was performed to test the influence of constraining variables (key SCF and charcoal concentration) on the pollen assemblages. CCA analysis was performed on key SCF concentrations, macroscopic and microscopic charcoal counts, and pollen percentages. The CCA was performed using the R package vegan (Oksanen et al., Reference Oksanen, Kindt, Legendre, O'Hara, Simpson, Solymos, Stevens and Wagner2007), and included every pollen taxon quantified with an abundance over 1% TPA to reduce the weighting of rare taxa (Urrego et al., Reference Urrego, Bush, Silman, Correa-Metrio, Ledru, Mayle, Paduano, Valencia, Vimeux, Sylvestre and Khodri2009, Reference Urrego, Bush, Silman, Niccum, De La Rosa, McMichael, Hagen and Palace2013). Both STARS and CCA were performed within R (R Core Team, 2021).
To reconstruct local fire history and identify significant fire events near Monquentiva (Clark et al., Reference Clark, Royall and Chumbley1996; Higuera et al., Reference Higuera, Brubaker, Anderson, Hu and Brown2009), raw charcoal counts were converted into interpolated charcoal concentration (particles/cm3) and separated into peak magnitude and peak frequency using CharAnalysis v.1.1 at the 0.99 level of significance within Matlab (Higuera, Reference Higuera2009; MathWorks, 2019). Zone division for charcoal in CharAnalysis used the entire record of samples with depth data from the youngest to oldest age (6700–32,290 BP). Charcoal concentrations were interpolated into 200-year intervals based on the median sample resolution (Espinoza et al., Reference Espinoza, Franco-Gaviria, Castañeda, Robinson, Room, Berrío, Armenteras and Urrego2022). Charcoal frequency (Cback) was estimated using a LOWESS smoother method with a 1000-year smoothing record (Higuera, Reference Higuera2009; Espinoza et al., Reference Espinoza, Franco-Gaviria, Castañeda, Robinson, Room, Berrío, Armenteras and Urrego2022).
RESULTS
Chronology and stratigraphy
The 97.5-cm sediment section analysed provided a record of sediment accumulation from ca. 30,290–6700 BP (Table 1, Fig. 2). Four radiocarbon ages detected as outliers (Supplementary Table 1) were excluded from the age-depth model because they likely represented age reversals (Trachsel and Telford, Reference Trachsel and Telford2017). Between 137.1–135 cm depth (ca. 30,290–27,740 BP) the sediment is characterised by dark-brown homogenous clay (Munsell Color, 1992, 10YR 2/1) (Fig. 2). A sharp boundary from 135 cm is followed by a 17 cm layer of very dark-grey clay (7.5YR 3/1) sediment up to 118 cm (ca. 17,900 BP). From 118–92.5 cm depth (17,900–12,350 BP) the sediments returned to a dark-brown homogenous clay (10YR 2/2). This section is overlain at the top of drive 2 with a layer of black homogenous clays (10YR 2/1) that extends to 40 cm depth (ca. 6700 BP) in drive 1.
Spores of coprophilous fungi (SCF) pollen and charcoal records
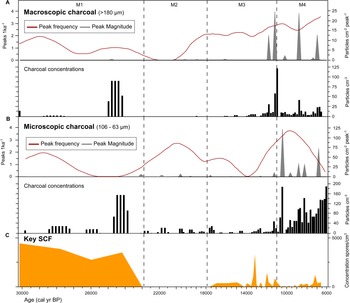
The SCF record was composed of 28 identifiable taxa, including eight key SCF (Supplementary Figure 1). SCF were found in 36 of the 52 samples analysed. Confidence intervals calculated for key SCF concentrations showed that the uncertainties attributable to count size were minimal (Fig. 3). This suggested the sampling effort was sufficient to provide statistical validity to the key SCF data (Maher et al., Reference Maher, Heiri, Lotter, Birks, Lotter, Juggins and Smol2012). The SCF and pollen records were divided into five palynological zones based on sedimentological changes, key SCF regime shifts, and prominent changes in SCF and pollen assemblages (Fig. 3, Supplementary Figure 2). This includes zone M5, dating between ca. 2150–1170 BP. Charcoal counts and area showed no observable differences in the Late Holocene (Supplementary Figure 3). Charcoal concentration and peak magnitude and frequency of fires in Monquentiva were greater in the Early and Middle Holocene samples (Fig. 4). CHAR analysis could not be run on the charcoal data from zone M5 due to the low number of samples.

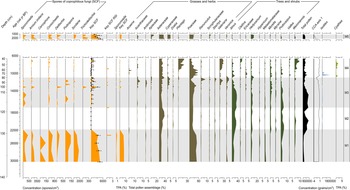
Figure 3. Summary diagram of the most abundant spore and pollen taxa recorded from the sediments of Monquentiva. All spores are expressed as a concentration per cubic centimeter (spores/cm3). Key SCF concentration shows the 0.95 confidence interval as whiskers (Maher, Reference Maher1981). The key SCF RSI shows the regime shift analysis and plots the statistically significant shifts in key SCF concentration (p-value < 0.05). Sporormiella and the key SCF (%) are also expressed as a percentage of the total pollen assemblage (%TPA) (see Supplementary Figure 4 for all spores quantified as %TPA). Canonical correspondence analysis (CCA) plots Axis 1 scores from the site. Cyathea, a pteridophyte, is not grouped.

Figure 4. Monquentiva charcoal record and concentration of key SCF. (A) Macroscopic charcoal; (B) microscopic charcoal; and (C) key SCF record. Charcoal concentration (black bars; particles/cm3), peak frequency (red line, left hand axis; peaks/ka), and peak magnitude (grey silhouettes, right hand axis; particles/cm2/peak) for charcoal data analysed in CharAnalysis using a LOWESS smoother model (Higuera et al., Reference Higuera, Brubaker, Anderson, Hu and Brown2009). Vertical dashed lines show the four palynological zones (M1–M4) based on sedimentological changes in the core stratigraphy, key SCF regime shifts, and prominent changes in SCF and pollen assemblages as in Figure 3.
Zone M1 (ca. 30,300–22,900 BP)
The highest abundance of SCF was observed in Zone M1 (Fig. 3). Sporormiella peaked at 417 spores/cm3 (<1%), Sordaria at 1737 spores/cm3 (3%), and Podospora at 139 spores/cm3 (<1%). The record of key SCF also included: Arnium imitans (1946 spores/cm3; 3%), Coniochaeta (695 spores/cm3; 1%), Delitschia (208 spores/cm3; <1%), and Cercophora (139 spores/cm3; <1%). The most abundant pollen taxa were Poaceae (49%), Asteraceae (16%), and Alnus (15%) (Fig. 3). Other prominent tree and shrub taxa occurring at <5% are Hedyosmum, Hypericum, Melastomataceae, Podocarpus, and Weinmannia. Before 25,000 BP, macroscopic and microscopic charcoal concentrations were low (<20 particles/cm3), but increased to 91 and 157 particles/cm3, respectively at ca. 24,240 BP (Fig. 4). Peak frequency for both charcoal fractions remained at <2 fires per 1000 yr. The STARS analysis identified a key SCF regime shift at 24,240 BP, reaching 2.3 RSI (Fig. 3).
Zone M2 (ca. 22,900–17,890 BP)
Zone M2 is characterised by the near absence of SCF (Fig. 3). OU-100 and UAB-2 were the only fungal spores recovered at ca. 19,900 and 17,890 BP (69 spores/cm3) (Supplementary Figure 4). Asteraceae (36%) and Alnus (25%) were the most abundant pollen taxa, while Poaceae remained relatively low (20%) (Fig. 3). Hedyosmum (4%), Podocarpus (4%), Valeriana (2%), and Weinmannia (1%) were all present. Arboreal taxa such as Morella and Myrsine increased slightly (1–2%). Macroscopic (<2 particles/cm3) and microscopic (0–29 particles/cm3) charcoal remained low (Fig. 4). Peak frequency for both charcoal fractions increased in this zone (between 0–2.5 fires per 1000 yr). One key SCF regime shift was detected in the zone, reaching 1.23 RSI at 17,890 BP (Fig.4).
Zone M3 (ca. 17,890–10,990 BP)
SCF rebounded in zone M3 to levels comparable to those recorded in zone M1 (Fig. 3). Key SCF concentration fluctuated between 0–2154 spores/cm3 (0–3%). Sporormiella increased within this zone (278 spores/cm3; <1%), along with Arnium imitans (3336 spores/cm3; 2%), Delitschia (416 spores/cm3; <1%), and Sordaria (695 spores/cm3; < 1%). Podospora (139 spores/cm3; <1%), Coniochaeta (208 spores/cm3; <1%), and Trichodelitshia (208 spores/cm3; <1%) were also present. Herbaceous taxa such as Asteraceae (20%) and Poaceae (27%) dominated in this zone (Fig. 3). Acanthaceae (1–5%), Ambrosia (0–3%), Apiaceae (0–4%), Cyperaceae (0–4%), Draba (0–2%), Ranunculus (0–8%), and Valeriana (0–24%) all increased in abundance. Alnus (29%) and Podocarpus (4%) increased again up to ca. 14,150 BP before declining to 2% and 0%, respectively, by 10,990 BP. Hedyosmum (4%) and Melastomataceae (1%) were present while Ericaceae (0–2%) and Morella (1–4%) increased. Macroscopic charcoal was absent at 17,890 BP, but increased to 59 particles/cm3 by 11,200 BP, alongside the largest macroscopic charcoal peak recorded ([25 particles/cm2]/peak) (Fig. 4). Peak frequency steadily increased (from 2 to 3 fires per 1000 yr). Microscopic charcoal increased from 0 to 65 particles/cm3 across the zone. By 14,200 BP, microscopic peak frequency decreased to <1 fire per 1000 yr, before rising to >3 fires per 1000 yr by 12,000 BP. The regime shift analysis recorded two key SCF changes at 12,770 and 12,140 BP (0.681 and 0.621 RSI) (Fig. 3).
Zone M4 (ca. 10,990–6700 BP)
Zone M4 showed a reduction of all SCF (Fig. 3). Between 11,915–9720 BP, key SCF declined from 1459 to 0 spores/cm3 (2–0%). Sporormiella was found in only one sample at 9890 BP while Cercophora, Podospora, and Trichodeltischia were absent. At ca. 7220 BP, Arnium imitans (1112 spores/cm3; 1%) and Sordaria (139 spores/cm3; <1%) increased, aligning with a rise in key SCF to 1251 spores/cm3 (>1%). Most grasses and herbs, including Cyperaceae (2–0%), Acanthaceae (2–0%), Ambrosia (2–0%), Apiaceae (4–0%), Ranunculus (8–0%), Stachys (3–0%), and Veronica (3–0%), declined at the onset of this zone (Fig. 3). Poaceae increased up to 59% and then decreased to 15% by 6700 BP. Asteraceae remained abundant (22%) while Acaena (0–6%), Plantago (1–20%), and Valeriana (9–27%) increased. Tree taxa such as Alnus (20–0%), Hedyosmum (5–0%), and Podocarpus (4–0%) decreased in the zone, while Clethra (0–4%), Ericaceae (1–3%), Vallea (0–3%), and Weinmannia (1–8%) increased. Cyathea (2%) was recorded for the first time at ca. 10,600 BP. Zone M4 displayed the highest macroscopic charcoal concentration (123 particles/cm3) in the record ca. 10,990 BP (Fig. 4). Macroscopic charcoal peak frequency continued to increase across the zone (2.5–3.5 fires per 1000 yr). Microscopic charcoal and peak magnitude were highest in abundance, reaching 190 particles/cm3 and (123 particles/cm2)/peak (ca. 10,990 BP). Between 9600–6700 BP, microscopic charcoal frequency increased then decreased from 3.5 to 1.4 fires per 1000 yr. The interval recorded two final key SCF regime shifts at 10,990 BP and 9018 BP, reaching 0.41 RSI and 1.1 RSI, respectively.
Zone M5 (ca. 2150–1150 BP)
Key SCF peaked at 4726 spores/cm3 (3%) ca. 2150 BP in zone M5 (Fig. 3). Sporormiella (278 spores/cm3; <1%), Arnium imitans (3405 spores/cm3; 2%), Coniochaeta (487 spores/cm3; <1%), Delitshia (347 spores/cm3; <1%), Sordaria (695 spores/cm3; <1%), and Trichodelitschia (278 spores/cm3; <1%) were all present. Herbaceous taxa including Apiaceae (10%), Asteraceae (36%), Cyperaceae (6%), and Poaceae (34%) dominated the zone and were accompanied by Acanthaceae (<3%), Scrophulariaceae (<4%), and Veronica (<2%) (Fig. 3). From the arboreal record, Alnus (3%) and Hedyosmum (8%) were the most representative. In this zone, Rumex appeared for the first time (1%) (Supplementary Figure 2). Concentrations of both macroscopic (624–1308 particles/cm3) and microscopic (1484–3574 particles/cm3) charcoal were the highest in the record (Supplementary Figure 3).
SCF correlations
Sporormiella concentration in the Monquentiva record correlates positively with Arnium imitans, Delitschia, Podospora, Sordaria, and Trichodelitschia (p-value < 0.01) and with Cercophora and Coniochaeta (p-value < 0.05) (Table 2). This includes a high positive correlation between Sporormiella spores with Sordaria (R2 = 0.633, p < 0.01), Arnium imitans (R2 = 0.644, p < 0.01), and Delitschia (R2 = 0.691, p < 0.01). Twenty other spores were recorded at Monquentiva and included 13 spores described relatively recently in the literature (Supplementary Figure 1) (Revelles et al., Reference Revelles, Burjachs and van Geel2016; Loughlin et al., Reference Loughlin, Gosling and Montoya2018). Sporormiella concentration was positively correlated with four of these newly described fungal spores: OU-5 (R2 = 0.624, p < 0.01), OU-100 (R2 = 0.770, p < 0.01), OU-108 (R2 = 0.549, p < 0.01) and UAB-50 (R2 = 0.412, p < 0.01), but showed no significant correlation with OU-18, UAB-1, UAB-2, UAB-7, UAB-15, UAB-30A, UAB-32, UAB-40, UAB-48, or UAB-49 at the 0.01 level of significance (Supplementary Table 2). The significant correlations between Sporormiella and the other SCF were used to create the key SCF sum to represent megafaunal abundance changes over time (Fig. 3).
Table 2. Pearson correlation coefficients calculated among SCF concentrations from the Monquentiva record. Statistical significance of correlations are highlighted at p-value < 0.01 (**) and < 0.05 (*) levels.

Multivariate ordinations
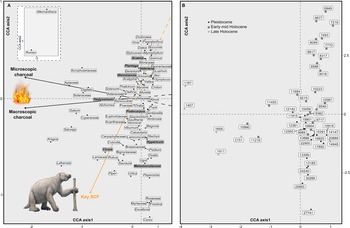
CCA analysis of the fossil pollen record grouped taxa along two axes, which explained a cumulative 87% of the total variance in the dataset (Fig. 5). CCA Axis 1 explained 63% of the variance (eigenvalue: 0.0879) of the pollen data, and CCA Axis 2 explained 24% of the variance (eigenvalue: 0.0337). CCA Axis 1 ordinated taxa including Ilex, Croton, Gesneriaceae, and Oxalis at the positive end, and Rumex, Alternanthera, Aragoa, and Apiaceae at the negative end (Fig. 5a). The pollen taxa with the highest scores in Axis 2 were Alternanthera, Rumex, Vicia, and Dodonaea at the positive extreme of the axis, whereas Carex, Escallonia, Myrtaceae, and Rosaceae were distributed at the negative end. The CCA ordination displayed a clear separation between samples from the Holocene at the positive extreme and the Pleistocene at the negative end of Axis 2 (Fig. 5b). Taxa in the centre of the ordination, such as Asteraceae, Poaceae, Alnus, Hedyosmum, and Podocarpus, are more constant throughout the record, thus they are not strongly grouped to any of the environmental variables. The CCA also showed that the key SCF variable covaried with the negative end of Axis 2 and explained 74% of the variance along this axis. Macroscopic and microscopic charcoal covaried with the negative end of Axis 1 and both explained 98% of the variance along this axis.

Figure 5. Canonical correspondence analysis (CCA) results for the pollen, charcoal, and spore records from Monquentiva. (A) Species scores for the pollen record of taxa >1% the total pollen sum, using key SCF and macroscopic and microscopic charcoal as constraining variables. Bold taxa in grey boxes are discussed in detail in the text. The inset shows pollen species with high CCA Axis 1 and Axis 2 scores. The giant ground sloth (Eremotherium) concept art sourced from Ugueto (Reference Ugueto2020). (B) Sample scores labelled with their corresponding ages in calibrated years before present (BP).
DISCUSSION
The timing of megafaunal decline in the northern tropical Andes
We found robust evidence for megafaunal presence and decline at Monquentiva (Table 2, Fig. 3). In our record, Sporormiella remained below the 2% functional megafaunal extinction threshold proposed from arid sites in western North America (Davis and Shafer, Reference Davis and Shafer2006). However, that threshold may be inappropriate for other environments (Perrotti and van Asperen, Reference Perrotti and van Asperen2019). Sporormiella percentages below 2% are not uncommon in the literature (e.g., Burney et al., Reference Burney, Robinson and Burney2003; Perrotti, Reference Perrotti2018). The use of Sporormiella concentrations (Perrotti, Reference Perrotti2018; Chepstow-Lusty et al., Reference Chepstow-Lusty, Frogley and Baker2019; Conroy et al., Reference Conroy, Baker, Jones, van Hardenbroek, Hopla, Collier, Lister and Edwards2020) instead of percentages has been shown to be effective to infer megafaunal extinctions (Johnson et al., Reference Johnson, Rule, Haberle, Turney, Kershaw and Brook2015; Raczka et al., Reference Raczka, Bush and De Oliveira2018, Reference Raczka, Mosblech, Giosan, Valencia, Folcik, Kingston, Baskin and Bush2019). In southeastern Brazil, Sporormiella concentrations between 0–339 spores/cm3 have been interpreted to indicate low to medium numbers of cattle that were present around lakes (Raczka et al., Reference Raczka, Bush, Folcik and McMichael2016). We recovered Sporormiella at concentrations between 0–417 spores/cm3, suggesting Pleistocene megafaunal presence. We also found statistically significant positive correlations (p-value < 0.01 and p-value < 0.05) between Sporormiella concentrations and the concentrations of all of the other SCF (Table 2). These correlations allowed us to create a multi-species key SCF group to estimate megafaunal presence and track megafaunal declines in Monquentiva (Fig. 3).
The recovery of SCF can also be influenced by biotic and abiotic conditions related to fungal spore germination and growth. Dung fungi face interspecific competition (Kuthubutheen and Webster, Reference Kuthubutheen and Webster1986; Dix and Webster, Reference Dix and Webster1995) and have genus- or species-specific responses to microenvironmental factors, including temperature and limnological conditions (Dickinson and Underhay, Reference Dickinson and Underhay1977; Krug et al., Reference Krug, Benny, Keller, Mueller, Bills and Foster2004). Our understanding of the role of environmental conditions on fungal spore germination is focused on temperature zones (Lee et al., Reference Lee, van Geel and Gosling2022). However, fluctuating water levels have been shown to skew Sporormiella (Raper and Bush, Reference Raper and Bush2009; Raczka et al., Reference Raczka, Bush, Folcik and McMichael2016) and other spore records (Ponel et al., Reference Ponel, Court-Picon, Badura, Guiter, de Beaulieu, Andrieu-Ponel, Djamali, Leydet, Gandouin and Buttler2011). This can increase or decrease the transportation and accumulation of spores in lakes (Raper and Bush, Reference Raper and Bush2009; Etienne et al., Reference Etienne, Wilhelm, Sabatier, Reyss and Arnaud2013; Lee et al., Reference Lee, van Geel and Gosling2022). At Monquentiva, we used the multi-species key SCF concentration record to minimise the effects of environmental conditions on individual SCF germination and growth.
The key SCF record indicates the presence of megafauna in Monquentiva and the eastern Colombian Cordillera at least since 30,290 BP (Fig. 3). Megafaunal bone remains are scarce in northern South America (Barnosky and Lindsey, Reference Barnosky and Lindsey2010), but have been dated in Venezuela back to 41,000 14C age BP (calibrated to 42,060 BP) (Jull et al., Reference Jull, Iturralde-Vinent, O'Malley, MacPhee, McDonald, Martin, Moody and Rincón2004), in Ecuador back to 20,980 14C age BP (calibrated to 23,240 BP) (Coltorti et al., Reference Coltorti, Ficcarelli, Jahren, Espinosa, Rook and Torre1998), in Peru back to 14,150 14C age BP (calibrated to 15,270 BP) (MacNeish et al., Reference MacNeish, Berger and Protscha1970), and in Brazil back to 20,060 BP (Neves and Piló, Reference Neves and Piló2003). The limited spore records produced to date provide evidence for megafaunal presence in Ecuador back to 16,280 BP (Raczka et al., Reference Raczka, Mosblech, Giosan, Valencia, Folcik, Kingston, Baskin and Bush2019), in Peru back to 25,000 BP (Rozas-Dávila et al., Reference Rozas-Dávila, Valencia and Bush2016), and in Brazil back to 23,000 BP (Raczka et al., Reference Raczka, Bush and De Oliveira2018). In Colombia, macrofaunal remains are limited (Barnosky and Lindsey, Reference Barnosky and Lindsey2010) but have been dated back to 40,000 14C age BP (van der Hammen and Correal Urrego, Reference van der Hammen and Correal Urrego1978). Faunal remains have been found in Tocaima (Correal Urrego, Reference Correal Urrego1993; Correal Urrego et al., Reference Correal Urrego, Olano, Calderón and Cardozo2005; Alfonso-Rojas et al., Reference Alfonso-Rojas, Herrera-Gutierrez, Suárez, Ciancio, Pelegrin and Cadena2021) and at Tibitó (Correal Urrego, Reference Correal Urrego1981; Borrero, Reference Borrero and Haynes2009). Megafaunal presence has also been inferred from rock shelter cave paintings from Serranía de la Lindosa (~500 km from Monquentiva) that date back to ca. 12,600 years ago (Bischler and Pinto, Reference Bischler and Pinto1959; Correal et al., Reference Correal, Piñeros and Van Der Hammen1990). However, this evidence has been highly criticised because cave art does not contain organic material that can be directly dated and heavily relies on artist representation (Hedges et al., Reference Hedges, Ramsey, Van Klinken, Pettitt, Nielsen-Marsh, Etchegoyen, Niello, Boschin and Llamazares1997). Our key SCF record reveals that megafauna also roamed the higher altitudes of Colombia during the Pleistocene and were present at Monquentiva and the Colombian Andes dating back to at least 30,290 BP.
Our SCF data indicated the first wave of megafaunal decline in Monquentiva at ca. 22,900 BP, followed by a recovery ca. 16,900 BP and a second decline by ca. 10,990 BP (Fig. 3). Such SCF fluctuations could result from differential preservation due to water-level changes (Wood and Wilmshurst, Reference Wood and Wilmshurst2013; Raczka et al., Reference Raczka, Mosblech, Giosan, Valencia, Folcik, Kingston, Baskin and Bush2019) and water-body size (Raper and Bush, Reference Raper and Bush2009; Lee et al., Reference Lee, van Geel and Gosling2022). However, the pollen record shows that Isoëtes was low during the onset of both megafaunal declines and did not coincide with changes in SCF (Fig. 3). Isoëtes is an aquatic taxon, common in lake bottoms, marshes, and bogs in the high Páramo (van der Hammen and González, Reference van der Hammen and González1960). Isoëtes did increase in the Monquentiva record, suggesting the formation of a small water body, but ca. 600 years after the second SCF decline. Consistently low water levels and independence of the SCF and Isoëtes records at Monquentiva suggest that the SCF concentration decreases represent megafaunal declines and are not due to water-level fluctuations.
The first megafaunal decline at ca. 22,900 BP was identified as a statistically significant regime shift in Monquentiva (Fig. 3). Three further key SCF regime shifts were identified at ca. 12,770, 12,140, and 10,990 BP. The shifts at 12,140 BP and 10,990 BP are linked to reductions in key SCF concentrations from 1459 to 0 spores/cm3. We interpret these shifts as the extinction of Pleistocene megafauna at Monquentiva. This record is consistent with a two-wave megafaunal decline reported from Lake Pacucha in the high Andes of Peru (Rozas-Dávila et al., Reference Rozas-Dávila, Valencia and Bush2016). However, the first megafaunal decline at Pacucha started at 21,000 BP and resulted in an extinction by 15,800 BP (Rozas-Dávila et al., Reference Rozas-Dávila, Valencia and Bush2016). We have little evidence to explore the causes of extinction, but it is notable that megafaunal extinctions were recorded ca. 3,000 years before early records of human occupation at Pacucha (Rozas-Dávila et al., Reference Rozas-Dávila, Valencia and Bush2016), while at Monquentiva the second wave of megafaunal decline coincides with early archaeological records (see discussion in next section). In Ecuador, the extinction of Pleistocene megafauna is recorded at 12,800 BP (Raczka et al., Reference Raczka, Mosblech, Giosan, Valencia, Folcik, Kingston, Baskin and Bush2019), while in Lagoa Santa, Brazil, extinction was reached by 12,000 BP and showed no evidence of megafaunal recovery (Raczka et al., Reference Raczka, Bush and De Oliveira2018). At Monquentiva and the Colombian Andes, the second megafaunal decline (ca. 10,990 BP) was recorded later than at other diverse South American sites, suggesting that Monquentiva provided a suitable habitat for megafauna. Additionally, macrofaunal remains from species such as Doedicurus sp. have been dated as late 7400 BP (Steadman et al., Reference Steadman, Martin, MacPhee, Jull, McDonald, Woods, Iturralde-Vinent and Hodgins2007). Because ecosystems are complex and highly diverse across South America, this heterogeneity could be linked to variability in megafaunal extinction timings (Gill et al., Reference Gill, Williams, Jackson, Lininger and Robinson2009, 2012; Rozas-Dávila et al., Reference Rozas-Dávila, Valencia and Bush2016), with sites like Monquentiva probably providing a temporary refuge until the final extinction.
Climate, vegetation, and human occupation during megafaunal declines
Páramo vegetation dominated Monquentiva between 30,000–22,900 BP (Fig. 6). The dominance of Poaceae up to ca. 24,240 BP, the low abundance of arboreal elements, and low total pollen concentration indicate a cool and dry climate. The tree line, defined as the upper altitudinal boundary of continuous forests (Urrego et al., Reference Urrego, Niccum, La Drew, Silman and Bush2011a), was lowered and open vegetation was found not just at Monquentiva but also across the high elevations in the eastern Colombian Andes (van Geel and van der Hammen, Reference van Geel and van der Hammen1973). This period corresponded with the coldest phase of the last glacial period (van der Hammen, Reference van der Hammen1974, Bogotá-A et al., Reference Bogotá-A, Groot, Hooghiemstra, Lourens, Van der Linden and Berrio2011). High concentrations of key SCF during the last glacial period at Monquentiva indicate that open vegetation was favourable for megafaunal presence. Between 25,000–24,200 BP, charcoal concentration increased, indicating fire activity surges at Monquentiva, however, charcoal peak magnitude and frequency remained low, suggesting the fires were of low intensity and low frequency (Fig. 4). Increased fire activity could have resulted from relatively dry conditions, as indicated by the low abundance of aquatic and wetland taxa including Isoëtes and Cyperaceae (Fig. 3). However, fire activity was not sustained, particularly during the first wave of megafaunal decline ca. 22,900 BP. This could have resulted from the cold and dry conditions in the Andes at the end of the late glacial period (Bogotá-A et al., Reference Bogotá-A, Groot, Hooghiemstra, Lourens, Van der Linden and Berrio2011; Urrego et al., Reference Urrego, Silman, Correa-Metrio and Bush2011b) and from a reduction in fuel-load by the decrease of Poaceae from 24,240 BP (Fig. 3).

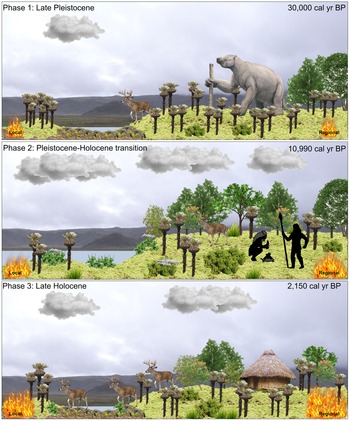
Figure 6. A conceptual landscape drawing of the changes in megafaunal presence, vegetation and fire activity reconstructed for Monquentiva during the Late Pleistocene and Holocene. Produced using Inkscape (Inkscape Project, 2022). Megafauna are depicted by the giant ground sloth (Eremotherium; concept art sourced from Ugueto, Reference Ugueto2020) and a white-tailed deer representation (Odocoileus virginianus) (https://www.allwhitebackground.com/?p=4845; viewed 04 January 2022). The flora clipart not cited are sourced from Microsoft clipart 2016. Trees and shrubs include representations of Alnus (https://www.turbosquid.com/Search/Index.cfm?keyword=Alnus+glutinosa&media_typeid=2; viewed 10 January 2022) and Morella (https://globalpollenproject.org/Taxon/Myricaceae/Morella/cerifera; viewed 10 January 2022). Herbaceous taxa include Espeletia (Asteraceae), Stachys (Mergili, Reference Mergili2007; Zwerver, n.d.), and Valeriana (https://vancouverislandgrows.wordpress.com/2018/01/23/valeriana officinalis/; viewed 12 January 2022). Local and regional fire activity represented by relative size of flame. Silhouettes indicate hunter-gatherer groups (Vlasiuk, Reference Vlasiuk2020). Kogi hut represents occupation by the pre-Hispanic indigenous group Muiscas (Benedek, Reference Benedek2015). Clouds and lake (blue polygon) represent humidity and lake level at the site (Garcia, Reference Garcia2022). Photographic backdrop of Monquentiva taken by J.W. Oughton in 2019.
The first wave of megafaunal decline at 22,900 BP took place during a short period of a slightly warm and humid climate at Monquentiva, as evidenced by displacements of Páramo by SubPáramo vegetation and increases in arboreal elements (Figs. 3, 7). The increase of Andean forest taxa including Alnus and Podocarpus indicated a relative increase in temperatures, whereas the absence of Isoëtes indicated low water levels. Alnus and Podocarpus are cold-tolerant and generous wind-pollinated pollen producers, and their high abundance could imply over-representation from lower altitudes (van der Hammen and González, Reference van der Hammen and González1960; Colinvaux et al., Reference Colinvaux, De Oliveira and Moreno1999). However, we suggest an upslope tree line migration, because Weinmannia and Podocarpus, two taxa associated with upper montane forest in the tropical Andes, also increased (Gómez et al., Reference Gómez, Berrío, Hooghiemstra, Becerra and Marchant2007; Hagemans et al., Reference Hagemans, Tóth, Ormaza, Gosling, Urrego, León-Yánez, Wagner-Cremer and Donders2019). This relative warming was short-lived, and temperatures decreased, as indicated by a further rise in Subpáramo taxa such as Asteraceae and a decline of arboreal elements at ca. 20,890 BP. Fluctuations of the upper forest line are consistent with changes from lower altitudes of Colombia (van Geel and van der Hammen, Reference van Geel and van der Hammen1973; Bogotá-A et al., Reference Bogotá-A, Groot, Hooghiemstra, Lourens, Van der Linden and Berrio2011) and suggest temperature changes as megafaunal populations declined during the Late Pleistocene. By ca. 16,930 BP, environmental conditions once again provided a favourable habitat for megafauna at Monquentiva.
The second wave of megafaunal decline occurred at ca. 10,990 BP, during the El Abra stadial (Fig. 6) (Hooghiemstra and van der Hammen, Reference Hooghiemstra and van der Hammen1993). This period coincided with an increase of high Andean forest and Páramo vegetation, suggesting novel and transitional vegetation (see ecological consequences discussion). Nearby vegetation records from Lake Fuquene (2580 m asl; Bogotá-A et al., Reference Bogotá-A, Groot, Hooghiemstra, Lourens, Van der Linden and Berrio2011) and Cienaga del Visitador (3300 m asl; van der Hammen and González, Reference van der Hammen and González1965) also show rises in Alnus and a vegetation mosaic composed by Andean forest, Subpáramo, and Páramo. The decline of megafauna at Monquentiva during the cool El Abra stadial contrasts with the literature, which suggests extinctions during warm interstadials (Cooper et al., Reference Cooper, Turney, Hughen, Brook, McDonald and Bradshaw2015; Rozas-Dávila et al., Reference Rozas-Dávila, Valencia and Bush2016), but converge with declines occurring during periods of climate instability.
The decline of megafauna at ca. 10,990 BP also coincided with the earliest evidence of hunter-gatherers in Colombia (Fig. 6). Hunter-gatherer groups are reported since the Guantiva interstadial ca. 12,500 BP in the Bogotá highlands (2600 m asl) and downslope from Monquentiva at 340 m asl since 11,740 BP (van der Hammen and Correal Urrego, Reference van der Hammen and Correal Urrego1978; Correal Urrego, Reference Correal Urrego1993; Triana-Vega et al., Reference Triana-Vega, Sedov, Salinas-Acero, Carvajal-Contreras, Moreano, Tovar-Reyes, Solleiro-Rebolledo and Díaz-Ortega2019; Alfonso-Rojas et al., Reference Alfonso-Rojas, Herrera-Gutierrez, Suárez, Ciancio, Pelegrin and Cadena2021). Megafaunal extinctions have been linked to overhunting by humans worldwide (Martin and Klein, Reference Martin, Klein, Martin and Klein1984; MacPhee and Sues, Reference MacPhee and Sues1999) and suggested as a major driver of extinction in North America and Australia (Martin and Klein, Reference Martin, Klein, Martin and Klein1984; Stuart, Reference Stuart and MacPhee1999; Rule et al., Reference Rule, Brook, Haberle, Turnery, Kershaw and Johnson2012). In South America, our understanding of the role of overhunting in the decline of Pleistocene megafauna is less clear due to the paucity of records. Records from coastal Ecuador suggest a stratigraphic correlation between megafaunal remains and stone tools of suspected Holocene age (Ficcarelli et al., Reference Ficcarelli, Azzaroli, Bertini, Coltorti, Mazza, Mezzabotta, Espinosa, Rook and Torre1997). However, megafauna hunting by humans is not thought to be the cause of extinction at this site (Ficcarelli et al., Reference Ficcarelli, Azzaroli, Bertini, Coltorti, Mazza, Mezzabotta, Espinosa, Rook and Torre1997). The Pleistocene collapse of megafauna in Brazil occurred during a window of human occupation (Raczka et al., Reference Raczka, Bush and De Oliveira2018), but megafauna populations in Peru collapsed before the first records of human presence (Rozas-Dávila et al., Reference Rozas-Dávila, Valencia and Bush2016). At Monquentiva, megafauna populations were unable to recover after 10,990 BP, suggesting that both humans and climate could have contributed to their decline. Overall, our record allows us to infer the timing of megafaunal decline and ecological consequences, but we have little evidence to explore the cause of extinctions.
Ecological consequences of megafaunal collapse
We found that some tree and shrub species became absent from the record during both waves of megafaunal decline, increasing in abundance during the partial recovery of megafauna ca. 16,930–10,990 BP (Fig. 3). Melastomataceae and Hypericum increased at Monquentiva when megafaunal abundance recovered. These pollen taxa can be dispersed by herbivores (Grabandt, Reference Grabandt1980), suggesting a close link that is corroborated by the CCA analysis (Fig. 5a). Similarly, we found that several herbaceous taxa, including Acanthaceae, Apiaceae, Ranunculus, and Veronica, became absent from the record during the second wave of megafaunal decline ca. 10,990 BP (Fig. 3). This suggests that the decline of these taxa are likely a result of reduced seed dispersal by megafauna, rather than climate alone. Such relations between seed dispersal and the loss of megafauna have been found in the Neotropics today, where the loss of primates has led to dispersal limitation in plant species (Peres et al., Reference Peres, Emilio, Schietti, Desmoulière and Levi2016). As Pleistocene megafauna declined in the high Andes of Peru, the abundance of grasses and forbs also decreased (Rozas-Dávila et al., Reference Rozas-Dávila, Valencia and Bush2016). In the Brazilian lowlands, vegetation remained largely unchanged, with only a few taxa declining in abundance (Raczka et al., Reference Raczka, Bush and De Oliveira2018). These contrasting records probably relate to differences in the original vegetation and suggest the ecological consequences of megafaunal declines were habitat-specific. In the Colombian Andes however, our palaeoecological record suggests an important role of the megafauna in the reproduction and dispersion of tree, grass, and herb taxa.
The pollen record also showed palatable and woody taxa increasing at Monquentiva following the second decline of megafauna ca. 10,990 BP (Fig. 3). Plantago and Valeriana, which are palatable SubPáramo and Páramo herbs (Kutschker and Morrone, Reference Kutschker and Morrone2012; Rozas-Dávila et al., Reference Rozas-Dávila, Valencia and Bush2016; Hooghiemstra and Flantua, Reference Hooghiemstra, Flantua, Gómez and Pinilla-Pachon2019), increased after the second megafaunal decline. The CCA analysis shows that these taxa ordinate on the opposite extreme of key SCF, indicating their sensitivity to megafaunal presence (Fig. 5a). Therefore, the Early Holocene Plantago and Valeriana abundance increases likely suggest their release from megafaunal grazing rather than warming. At Monquentiva, Ericaceae increases after the second megafaunal decline (Fig. 3) and plots on the opposite ecological extreme of key SCF in the CCA (Fig. 5a). Some Ericaceae species are woody shrubs in Andean sites (Bush et al., Reference Bush, Alfonso-Reynolds, Urrego, Valencia, Correa-Metrio, Zimmermann and Silman2015; Rozas-Dávila et al., Reference Rozas-Dávila, Valencia and Bush2016), so this increase suggests woody species overgrowth following megafaunal declines. Such woody overgrowth is also recorded in other palaeoecological records from Andean and North American sites (Gill et al., Reference Gill, Williams, Jackson, Lininger and Robinson2009, 2012; Rozas-Dávila et al., Reference Rozas-Dávila, Valencia and Bush2016; Raczka et al., Reference Raczka, Bush and De Oliveira2018). The lack of herbivory after the second megafaunal decline probably contributed to the encroachment of palatable and woody species at the higher altitudes of the eastern Colombian Cordillera.
At Monquentiva, a turnover in arboreal taxa and reduction of an open Poaceae-dominated grassland is recorded after the second wave of megafaunal decline ca. 10,990 BP (Fig. 6). The prominent Andean taxa were Ericaceae, Hedyosmum, Podocarpus, and Weinmannia, surrounded by shrubby Subpáramo herbs including Acaena, Asteraceae, and Valeriana. The presence of Cyathea, a tree fern that typically inhabits gaps in closed forests, suggests increases in forest cover (Crystal-Arens, Reference Crystal-Arens2001). This ecosystem transformation at Monquentiva suggests the replacement of open vegetation with a closed formation of non-analogue vegetation following the second megafaunal decline. This finding coincides with the consequences of defaunation reported for the Peruvian Andes (Rozas-Dávila et al., Reference Rozas-Dávila, Valencia and Bush2016) and other Neotropical (Dantas and Pausas, Reference Dantas and Pausas2022) and North American sites (Gill et al., Reference Gill, Williams, Jackson, Lininger and Robinson2009, 2012). The flora turnover at Monquentiva occurred during the warmer Guantiva interstadial and cooler El Abra stadial 12,000–10,200 BP (Hooghiemstra and van der Hammen, Reference Hooghiemstra and van der Hammen1993), thus climate oscillations could have played a role in vegetation changes observed. However, the CCA analysis showed that the abundance of some of these novel taxa including Acaena, Valeriana, and Weinmannia ordinate on the opposite end of the constraining variable for megafauna (Fig. 5a). This suggests the transitional non-analogue vegetation was closely linked to megafaunal declines and their role in determining vegetation composition and structure at Monquentiva.
Andean megafauna likely acted as fuel-load suppressors in the tropical Andes. The charcoal record from Monquentiva represents a transition to increased local and regional fire activity during the Early Holocene megafaunal decline (Fig. 4). The reduction of herbivory during the Early Holocene probably led to fuel build-up of woody and grass biomass and increased fire activity. Megafaunal presence and fire activity on our CCA show an opposite relationship (Fig. 5a), highlighting the link between rising fire activity and megafaunal absence. For instance, white-tailed deer are browsers, thus trample on vegetation and feed on palatable flora (Martínez-Polanco, Reference Martínez-Polanco2019). Our record is consistent with increased fire activity after megafaunal collapse, as has been reported in other systems (Burney et al., Reference Burney, Robinson and Burney2003; Gill et al., Reference Gill, Williams, Jackson, Lininger and Robinson2009, Reference Gill, Williams, Jackson, Donnelly and Schellinger2012; Rule et al., Reference Rule, Brook, Haberle, Turnery, Kershaw and Johnson2012; Rozas-Dávila et al., Reference Rozas-Dávila, Valencia and Bush2016). However, the record of Monquentiva contrasts with the record from the Brazilian Cerrado where the collapse of megafauna populations did not coincide with increased fire activity (Raczka et al., Reference Raczka, Bush and De Oliveira2018). We suggest that the complexity and diversity of South American ecosystems led to heterogeneity and habitat specificity regarding the relationship between Pleistocene megafaunal declines and increasing fire activity.
Extant Holocene megafauna, climate, and human activity
Monquentiva witnessed a recovery in key SCF concentrations from ca. 8800 BP (Figs. 3, 6) that could represent the presence of extant megafauna (Perrotti, Reference Perrotti2018; Conroy et al., Reference Conroy, Baker, Jones, van Hardenbroek, Hopla, Collier, Lister and Edwards2020). This probably included those that inhabit Colombian ecosystems today, such as the Brocket and white-tailed deer (Cooke, Reference Cooke1998; Martínez-Polanco, Reference Martínez-Polanco2019) and the Andean spectacled bear (García-Rangel, Reference García-Rangel2012). This is consistent with surveys of white-tailed deer bone remains dated back to 2320 ± 50 14C age BP (Becerra, Reference Becerra1995). The recovery of megafauna during human occupation could relate to a change from hunter-gatherer societies to sedentism (Triana-Vega et al., Reference Triana-Vega, Sedov, Salinas-Acero, Carvajal-Contreras, Moreano, Tovar-Reyes, Solleiro-Rebolledo and Díaz-Ortega2019; Archila et al., Reference Archila, Groot, Ospina, Mejía and Zorro2021). In the Late Holocene, Poaceae and Asteraceae were dominant, suggesting an increase in open vegetation at Monquentiva. Increases in Hedyosmum, Weinmannia and Podocarpus indicated an expansion of forest on the surrounding slopes (Bogotá-A et al., Reference Bogotá-A, Groot, Hooghiemstra, Lourens, Van der Linden and Berrio2011). Rumex appeared in the record at low but consistent percentages (Supplementary Figure 2) and has been linked to degraded soils in Monquentiva (Espinoza et al., Reference Espinoza, Franco-Gaviria, Castañeda, Robinson, Room, Berrío, Armenteras and Urrego2022). The increase in Hedyosmum also could be linked to disturbed areas (Gentry, Reference Gentry1993). These vegetation changes could reflect disturbance by pre-Hispanic Muisca groups (Langebaek, Reference Langebaek1985, Reference Langebaek2001). Increased humidity could have resulted in the formation of a shallow water body from a peat bog, as suggested by the rise in Cyperaceae and low abundance of Isoëtes (Hooghiemstra and van der Hammen, Reference Hooghiemstra and van der Hammen1993). The Late Holocene vegetation cover and environmental conditions at Monquentiva likely provided habitat, water, and food for extant megafauna, allowing some species to persist in this part of the Colombian Andes until today.
During the late Holocene, fire activity escalated at Monquentiva (Espinoza et al., Reference Espinoza, Franco-Gaviria, Castañeda, Robinson, Room, Berrío, Armenteras and Urrego2022) (Supplementary Figure 3, Fig. 6). High charcoal concentrations likely reflected increased fires linked to agriculture (Gómez et al., Reference Gómez, Berrío, Hooghiemstra, Becerra and Marchant2007) and other anthropogenic activities (Espinoza et al., Reference Espinoza, Franco-Gaviria, Castañeda, Robinson, Room, Berrío, Armenteras and Urrego2022). Thus, the escalated fire record during Late Holocene megafaunal presence is likely to have been induced by human activities and facilitated by climate, which coupled to override the suppressive effect of megafauna on the vegetation.
CONCLUSIONS
This study is the first in the eastern Andes of Colombia, and probably across the South American continent, to use a multi-species SCF record to investigate the decline of Late Pleistocene megafauna. We showed that the combined spore record of coprophilous and semi-coprophilous fungi provided more robust evidence than using Sporormiella spores alone to infer megafaunal presence and declines. The multi-species SCF record from Monquentiva indicated the presence of Pleistocene megafauna in the eastern Colombian Cordillera since at least ca. 30,290 BP. At Monquentiva, megafauna populations declined in two waves. The first decline was reached by ca. 22,900 BP during a short period of a slightly warm and humid climate. The second megafaunal decline was reached by 10,990 BP, in a period coeval with the El Abra stadial and the presence of hunter-gatherer groups. The extinction of some megafauna at Monquentiva also points to declines occurring during periods of climate instability. However, our data do not allow us to infer the direct causes of megafaunal extinctions or the potential role of overhunting.
One ecological consequence of the megafaunal declines at Monquentiva was the formation of novel vegetation assemblages. The abundance of some plant species decreased while other palatable and woody taxa increased. This highlighted the role of megafauna in seed dispersal and herbivory. Another ecological consequence was the increase in fire activity after megafauna declined. Pleistocene megafauna likely acted as fuel-load suppressors in the tropical Andes as they trampled on vegetation and fed on palatable flora.
Overall, we show that ecosystems in the high eastern Andes of Colombia were highly sensitive to the decline of megafauna populations. Under the current biodiversity crisis, our understanding of the ecological consequences of megafaunal declines suggests that current and future extinctions could have devastating consequences for biodiversity. This knowledge is fundamental for contemporary management and conservation efforts. To effectively manage biodiversity, these efforts must account for the effect of local herbivore declines on the dispersal of certain plant species, on fire activity, and the potential loss of ecosystem services.
Acknowledgments
We thank Terri Lacourse, Nicholas Lancaster, Marco F. Raczka, and one anonymous reviewer for helpful feedback that improved the quality and clarity of the article. This research was supported by the BioResilience research project funded by the Natural Environment Research Council (NERC) and the Arts and Humanities Research Council (AHRC) grant number NE/R017980/1 under the Newton-Caldas Colombia-Bio programme. We are grateful to the community of Monquentiva for receiving and assisting us in all phases of the research. We thank Jack Oughton and Thya van den Berg for assistance in the field, Ivonne Castañeda for help with pollen identification, Alex Room for help with regime shift analysis, Anggi Hapsari for assistance with Oxcal and Nathaniel Reid for RStudio support. We also thank Angela Elliott, Joana Zaragoza-Castells, and the Exeter University laboratory team for their dedicated work and technical support.
Workload division among authors is as follows. Felix Pym: conceptualisation, methodology, validation, formal analysis, investigation, writing (original draft, review, editing). Felipe Franco-Gaviria: conceptualisation, methodology, formal analysis, writing (review and editing), project administration, supervision. Ismael G. Espinoza: investigation, visualisation, writing (review and editing). Dunia H. Urrego: conceptualisation, methodology, supervision, validation, writing (original draft, review, and editing), supervision, project administration, funding acquisition. Service Layer Credits: Source, Esri, Maxar, GeoEye, Earthstar Geographics, CNES/Airbus DS, USDA, USGS, AeroGRID, IGN, and the GIS User Community Esri, HERE, Garmin, (c) OpenStreetMap contributors, and the GIS user community.
The authors declare no conflict of interest. The data supporting this publication are openly available from the NERC Data repository or can be accessed by contacting the corresponding author(s).
Supplementary material
The supplementary material for this article can be found at https://doi.org/10.1017/qua.2022.66


 Open access