


The Marshall Plan, sponsored by the United States between 1948 and 1952 to help Europe recover from WWII, is the largest economic and financial aid program ever experienced in the world (Zamagni Reference Zamagni1997). It transferred to European countries $130 billion (in 2010 USD)—around 5 percent of U.S. GDP in 1948—which was mainly used to provide immediate relief and to fund the reconstruction. Footnote 1 Economic historians have long recognized the importance of the Marshall Plan in developing pro-market institutions in Western Europe (e.g., De Long and Eichengreen 1993; Casella and Eichengreen Reference Casella and Eichengreen1996; Hogan Reference Hogan1987). However, little is known about its causal effect on the recovery and development of local economies within European countries. The major empirical challenges to this line of research were the lack of geographically detailed data on the use of Marshall Plan aid and the identification of quasi-random variation in the allocation of resources within recipient countries.
In this paper, we study how the Marshall Plan’s investments in reconstruction affected the postwar economic development of Italian provinces. Italy was the third largest recipient of Marshall Plan aid. It received $12 billion between 1948 and 1952—on average, 2.3 percent of its GDP for five years (Fauri Reference Fauri2006). The Marshall Plan encompassed three types of interventions: reconstruction grants to the Italian government for rebuilding public infrastructure (74 percent of total aid), in-kind subsidies during the first postwar years (24 percent), and direct loans to privately owned firms (2 percent). In this paper, we focus on the reconstruction grants, while controlling for the distribution of the other two forms of Marshall Plan aid.
We digitized data on all 14,912 Marshall Plan reconstruction projects in Italy, as well as data on war damage documented by U.S. authorities between 1947 and 1949. We then matched this information with both prewar and postwar economic outcomes from the Italian Bureau of Statistics for the 91 provinces existing in 1952, as well as detailed data on Allied bombing during WWII compiled by the U.S. Air Force.
We start our analysis by showing that there is a positive correlation between the amount of Marshall Plan grants received by a province and its post-war development. However, provinces that had ex-ante higher potentials may have been allocated more reconstruction funds. To solve the potential endogeneity of the OLS, we instrument the amount of reconstruction money with the intensity of Allied air strikes in each province during the last stages of WWII. Specifically, we exploit a change from strategic to tactical Allied bombing following Italy’s surrender in 1943. After its capitulation, Italy became an active warfront between the German army, coming down from the north, and the Allied army, moving up from the south. In this period, Allied air forces focused on tactical bombings intended mainly to help their ground troops break through enemy lines. The distribution of these tactical air attacks was mostly driven by war-related events, such as land battles and intelligence on the movement of troops and supplies, not by other local factors, such as prewar economic conditions.
In addition to not being correlated with prewar economic characteristics and with the prewar stock of transportation infrastructure, post-armistice tactical bombings are a strong predictor of reconstruction grants during the Marshall Plan because these bombings were often targeted at public infrastructure. A 1-standard-deviation increase in post-armistice tactical bombing tonnage (1,681 tons) is correlated with damage valued 21 percent higher and 22 percent more grant money. More than half of the Marshall Plan reconstruction funds (52 percent) were employed to rebuild Italy’s road and railway networks. This finding is consistent with historians’ accounts that identify Italy’s broken transportation systems as the main constraint on its economic recovery (Fauri Reference Fauri2006). Moreover, we show that greater bombing damage during WWII required that provinces build new infrastructure instead of just restoring preexisting roads and railways. These findings support the hypothesis that more widespread destruction during the war decreased the opportunity cost of radical updates to the transportation system after the arrival of international grants.
We find three key results. First, the Marshall Plan had a positive effect on Italy’s economic development. Provinces with more reconstruction funds experienced larger increases in agricultural production—between 10 and 20 percent for major crops. This effect started only after the completion of the first public infrastructure funded through the Marshall Plan, close to ten years after the first Allied air raids. This finding indicates that our main results are indeed driven by the reconstruction effort funded through the Marshall Plan rather than stemming from other war-related events or the bombing itself. The fact that provinces with more bombings and greater damage were able to redesign their transportation systems out of necessity played an important role. More efficient roads and railways allowed farmers to reach more distant markets more quickly, essentially increasing demand for their agricultural products. Consistent with this fact, the estimated effect of reconstruction grants is positive and large for perishable crops (a threefold increase for fruit with a short shelf-life), but not statistically different from zero for products with a very long post-harvest life (8 percent decrease for tree nuts).
Second, in addition to increased production, we observe structural changes in the labor markets. In provinces with more reconstruction money, the number of agricultural workers decreased disproportionately by 21 percent. Manual labor was replaced with mechanical tools. We observe, for example, a fourfold increase in the use of tractors. General-purpose motorized machines had become increasingly important on American farms during the first half of the twentieth century, but their adoption in Italy was still low at the beginning of the Marshall Plan due to years of autarkic Fascist policies. It is therefore unsurprising that more efficient transportation and possibly higher profits spurred agricultural firms to invest more in physical capital.
Third, workers unable to find employment in agriculture were absorbed by the booming industrial and service sectors. In provinces with more reconstruction money, we also observe a larger increase in the number of active firms, especially those with fewer than ten employees. More efficient roads and railways might have decreased the barriers to entering the industrial sector.
This paper naturally contributes to the literature on the Marshall Plan. Previous papers have argued that the Marshall Plan created an environment in which democratic institutions could grow (as opposed to the communist system), but that its impact on investments in industrial capacity and infrastructure repairs was modest overall (Eichengreen et al. Reference Eichengreen, Uzan, Crafts and Hellwig1992; De Long and Eichengreen 1993). Our paper complements this set of findings by studying the effects of the Marshall Plan within a recipient country instead of relying on cross-country comparisons. In this sense, our empirical setting is designed to keep macroeconomic changes at the national level fixed while leveraging differences in the distribution of aid across local economies within a single country. Within this microeconomic framework, our results suggest that the modernization of the transportation network played a role in explaining differences in postwar development across Italian provinces located within the same region. Therefore, in addition to affecting European political institutions, the Marshall Plan had a more direct effect on the development of local economies.
Moreover, this paper contributes to the literature on the economic consequences of bombings. Previous work has examined the effects of aerial bombings on urban development (Davis and Weinstein Reference Davis and Weinstein2002), poverty rates (Miguel and Roland Reference Miguel and Roland2011), military and political activities (Dell and Querubin Reference Dell and Querubin2018), the creation of scientific knowledge (Waldinger Reference Waldinger2016), and education (Akbulut-Yuksel Reference Akbulut-Yuksel2014; Riaño and Valencia Caicedo Reference Riaño and Valencia Caicedo2020). Footnote 2 In the context of postwar Italy, our paper shows that, after a bombing campaign, foreign aid can generate a large economic expansion beyond the scope of simple mean reversion, even within otherwise similar macro regions.
HISTORICAL BACKGROUND
The Italian Campaign
Nazi Germany’s invasion of Poland on 1 September 1939 marked the beginning of WWII. Despite being an Axis power, Italy remained nonbelligerent until 10 June 1940, when it declared war on France and Great Britain.
The war in Italy can be divided into two periods: before and after the Italian armistice with the Allied forces. During the first phase of the war, between 11 June 1940 and 3 September 1943, the Allies wanted to depress the morale of the urban population, generate dissatisfaction with the Fascist regime, and wreck industrial firms that had been readapted to produce military equipment. To do so, they relied on strategic bombing. Air raids targeted industries in largely populated areas, “where the effects of air attack will be brought home to the largest portion of the population.” Footnote 3 The British War Cabinet was convinced that “even a limited offensive against Italy would have a big morale effect.” Footnote 4
On 3 September 1943, Italy signed the Armistice of Cassibile with the Allied forces. The armistice, made public on 8 September 1943, opened the so-called Italian Campaign, a new active warfront on Italian soil between the German and Allied armies. The Allies moved into mainland Italy from the southern island of Sicily. At the same time, German troops, which had arrived in Italy in July 1943, took control of most of the Italian peninsula and disarmed Italian soldiers. At this stage of the war, the Allies resorted to tactical bombing to facilitate ground operations and destroy the occupying German forces. Preferred targets became troop concentrations, railways, and roads (Baldoli and Knapp Reference Baldoli and Knapp2012).
The war in Italy formally ended on 2 May 1945. That year, Italian GDP per capita was 38 percent lower than the value observed in 1938, while industrial production was 66 percent lower (Lombardo Reference Lombardo2000). Immediately after the end of the war, damaged public infrastructure represented the main obstacle to recovery: 70 percent of the roads had been damaged, and 45 percent of the railroad system was no longer usable (Fauri Reference Fauri2006). It was therefore difficult for firms to obtain raw materials from suppliers and to distribute their products to clients. In contrast, firms’ physical capital had been only marginally affected by bombing: estimates suggest that between 80 and 90 percent of the Italian industrial capacity survived the war (Grindrod Reference Grindrod1955; Zamagni Reference Zamagni1997; Fauri Reference Fauri2006).
New infrastructure was desperately needed, but Italy lacked the funds to start reconstruction. Footnote 5 This situation changed on 5 June 1947, when U.S. Secretary of State George C. Marshall announced an assistance program for Europe. This program was formally approved by the U.S. Congress in March 1948 through the passage of the Economic Cooperation Act. Known formally as the European Recovery Program (ERP) and informally as the Marshall Plan, it was signed into law by President Truman in April 1948. The main goals of the ERP were (1) rebuilding and repairing European infrastructure; (2) increasing production, expanding foreign trade, and controlling inflation; (3) facilitating European economic cooperation and integration; and (4) preventing the expansion of communism (Boel Reference Boel2003). The ERP remained in operation from March 1948 to June 1952, Footnote 6 and granted $130 billion (in 2010 USD) to 17 western and southern European countries.
Prior Studies on the Marshall Plan
The impact of the Marshall Plan on the European recovery is a hotly debated topic in the economic history literature. On the one hand, early triumphalist accounts describe the Marshall Plan as vital for the reconstruction of productive capacity, the development of the necessary institutions for cooperation among former adversaries, and the restoration of European confidence in market capitalism (Jones Reference Jones1955; Mayne Reference Mayne1970; Arkes Reference Arkes1972). In the words of Mayne (Reference Mayne1970), Marshall Plan aid “was a precondition of all later affluence and economic miracles, as well as moves toward European unity.” On the other hand, Milward (Reference Milward1984) discounts the importance of ERP transfers, arguing that the recovery was well under way before 1948 and the reconstruction of the damaged private and public capital stocks was almost complete.
While these first reports were mainly qualitative in nature, the first empirical studies seemed to support the thesis that the Marshall Plan had a direct effect on development. Specifically, several papers highlighted the role of the Marshall Plan in promoting financial stabilization and market liberalization. Eichengreen et al. (Reference Eichengreen, Uzan, Crafts and Hellwig1992) find that U.S. aid had a significant impact on Europe’s recovery from WWII: the recipients of large amounts of Marshall aid recovered significantly faster than other industrial countries. Strikingly, however, it finds that the obvious channels through which the Marshall Plan could have affected European recovery—stimulating investment, augmenting capacity to import, and financing infrastructure repair—were relatively unimportant. Rather, the crucial role of the Marshall Plan was to facilitate the restoration of financial stability and the liberalization of production and prices. Casella and Eichengreen (Reference Casella and Eichengreen1996) argue that the Marshall Plan helped bring monetary stabilization to recipient countries. De Long and Eichengreen (1993) find that the Marshall Plan did play a role in alleviating resource shortages, but this channel was not strong. More importantly, the Marshall Plan significantly sped up Western European growth by altering the environment in which economic policy was made.
In a similar vein, Hogan (Reference Hogan1987) argues that the Marshall Plan was mostly intended to make Western Europe’s economy more similar to the mixed capitalist economy of the United States. In line with this analysis, more recently, Steil (Reference Steil2018) emphasizes that the Marshall Plan was primarily a political success and that it was inspired more by anticommunist sentiment than economic goals. While acknowledging that the Marshall aid did stimulate investment, Steil (Reference Steil2018) states that the overall effect of the Marshall Plan on the European postwar economic recovery is still unknown.
In short, most of the cross-country evidence on the Marshall Plan indicates that the program played an important role in spurring the economic recovery of recipient European countries. However, there is no consensus on the mechanisms through which it worked.
Details about the Marshall Plan in Italy
Italy received 10.6 percent of all ERP budgeted funds in Europe, making it the third largest recipient (ECA 1951). Footnote 7 Between May 1948 and June 1952, the country got around $12 billion from the United States, 11.5 percent of its 1948 GDP or an average of 2.3 percent of its GDP for five years.
Aid was of three types: financial grants, in-kind subsidies, and loans (Online Appendix Figure A1). Data on financial grants, the focus of this paper, come from the “Mutual Security Agency” bulletins. In addition to the amount of grant money paid to the Italian government, these reports describe the type, cost, and location of each reconstruction project financed through ERP aid. Financial grants represented 74 percent of ERP aid and were used to finance 14,912 projects. Moreover, we collected data on in-kind subsidies from the report “Missione Americana per l’ERP in Italia” (American ERP Mission in Italy), which lists quantities and monetary values of the goods transferred to each Italian province between March and December 1948 (after which the delivery of in-kind aid stopped). Finally, we hand-collected and digitized data on loans received by each Italian firm from 1948 to 1952; the data were stored at the historical archive of the Istituto Mobiliare Italiano (IMI). Since they represented the main source of funding, we primarily focus on the reconstruction grants, although we also include controls for the other forms of aid disbursed through the Marshall Plan.
The American authorities kept tight control over the whole funding process. First, the U.S. government collected detailed data on both the state of the Italian economy and the lingering problems left by the war through the so-called Italy Country Study. After this initial assessment, the U.S. Economic Cooperation Administration (ECA) and the Italian government jointly elaborated annual programs, each divided into four quarters, during the five years (1948–1952) in which the Marshall Plan actively disbursed funds. These annual and quarterly programs used the results from the Country Study to identify the main economic and geographical areas that needed funding. Each quarter, the ECA approved each individual project to be financed with ERP funds without further influence from the Italian government. Within 20 days of approval, the ECA had to transfer the grant money to the Italian government, which in turn had to start the project within four months of receiving the funds (Fauri Reference Fauri2006).
Italian newspapers provide qualitative evidence that Marshall Plan reconstruction grants, mostly used to update and modernize infrastructure, had positive effects on local economies. In many cases, the modernization of a preexisting railroad entailed the addition of a second track, allowing the local transportation network to accommodate much higher traffic levels. Similarly, preexisting roads heavily damaged by Allied bombing received additional lanes. For instance, Marshall Plan aid was used to rebuild and expand the Carmagnola-Fossano railroad in the province of Turin, an area that experienced widespread destruction during the war. The completion of the reconstruction of the railroad in 1956, paired with the addition of a second track, allowed local winemakers to transport their products more easily to other local markets. Footnote 8
DATA
Italian Censuses
The Censimento dell’Industria e dei Servizi (Industrial Census) provides information on the number of firms and workers in different Italian industries for the 91 provinces that existed in Italy in 1951 (Table 1). Footnote 9 We focus on nine major industries in the Italian economy—food, paper, chemicals, construction, mining, manufacturing, metallurgy, textile, and clothing—that employed 59 percent of the total industrial workforce in 1937.
Table 1 SUMMARY STATISTICS
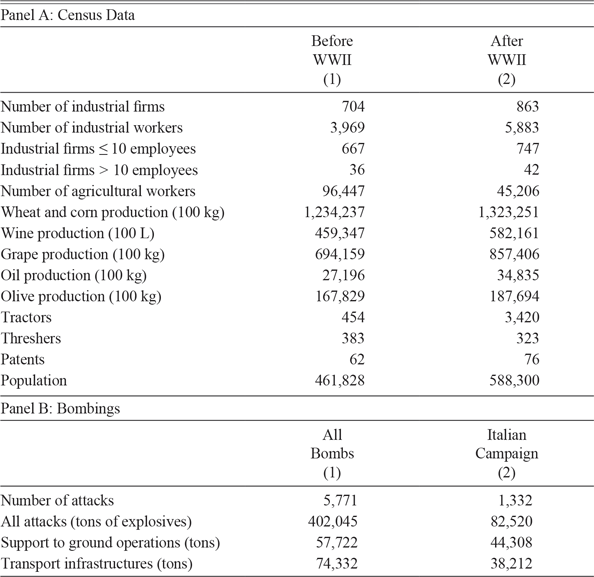
Notes: Panel A shows summary statistics on Italian industry and agriculture. Column (1) shows averages per province and industry before WWII (1927 and 1937 for Industrial Census; 1937, 1938, 1939 for agricultural annals), while Column (2) shows averages after WWII (every 10 years from 1951 to 2001 for Industrial Census; every year from 1946 to 1969 for agricultural annals). Panel B shows summary statistics of Allied bombings (all bombings in Column (1) and the Italian Campaign bombings in Column (2)). The air strikes associated with the Italian Campaign happened after March 1944 and focused on targets related to land battles against the German forces.
Sources: Censimento dell’Industria e dei Servizi, Annuario di Statistica Agraria, Censimento Generale della Popolazione, Istituto Nazionale di Statistica (Panel A). USAF Theater History of Operations Reports (THOR) Database, available at www.afri.au.af.mil/thor (Panel B).
Moreover, the Annuari di Statistica Agraria (Annals of Agricultural Statistics) provide additional information on the production of different crops and on the adoption of agricultural inputs for each year between 1937 and 1969.
We also digitized the yearly Bollettini della Proprietà Intellettuale (Bulletins of Intellectual Property) from 1938 to 1962. These documents contain information about all patents issued by the Italian Patent Office to domestic and foreign inventors.
Finally, the Censimento Generale della Popolazione (Population Census) provides information on the number and characteristics of individuals living in each Italian province before the war (in 1931 and 1936) and after the war (one observation every ten years from 1951 to 2001).
Allied Bombing, Consequent Damage, and the Transportation Network
We retrieved detailed information about Allied bombing in Italy from the Theater History of Operations Reports (THOR) (Lt. Col. Robertson, Burr, and Barth Reference Robertson, Burr and Barth2013), compiled by the U.S. Air Force Research Institute. For each Allied air strike executed in Italy during WWII, this database lists the location, the date, the type of target, and the amount of explosives in tons. Out of 84 countries targeted by at least one Allied air raid, Italy was the second hardest hit country after Germany. Out of 5,771 attacks with information on the targeted province, the Allied forces used 402,045 tons of explosives against targets on Italian soil (Table 1, Panel B, Column (1)).
By using the date of the attack and the type of target, we could isolate the tactical air strikes that were executed in support of ground operations against German troops during the Italian Campaign. We first considered only attacks that took place after February 1944, because in this period support for land battles in Italy became the top priority of the Allied Tactical Air Forces. Footnote 10 We then selected target types linked to operations against the German Army: direct cooperation with Allied ground forces, German troop concentrations, radar installations, gun emplacements, weapon launching sites, tactical targets, supply dumps, train tracks and marshaling yards; moving trains, highways, and vehicles, and transportation facilities.
The distribution of these bombings followed the land battles of the Italian Campaign and the progressive retreat of German troops toward Austria. The most heavily affected areas connect the central provinces in the Lazio region on the so-called Gustav line (a series of German fortifications around the town of Cassino), the provinces in the Tuscany and Emilia-Romagna regions on the so-called Gothic line (a second German entrenchment), and the provinces leading to the Brenner Pass on Italy’s northeastern border with Austria (Figure 1, Panel B). In contrast, the strategic bombings that predated the Armistice of Cassibile had targeted the richest and most populated areas across all Italian regions (Figure 1, Panel A).
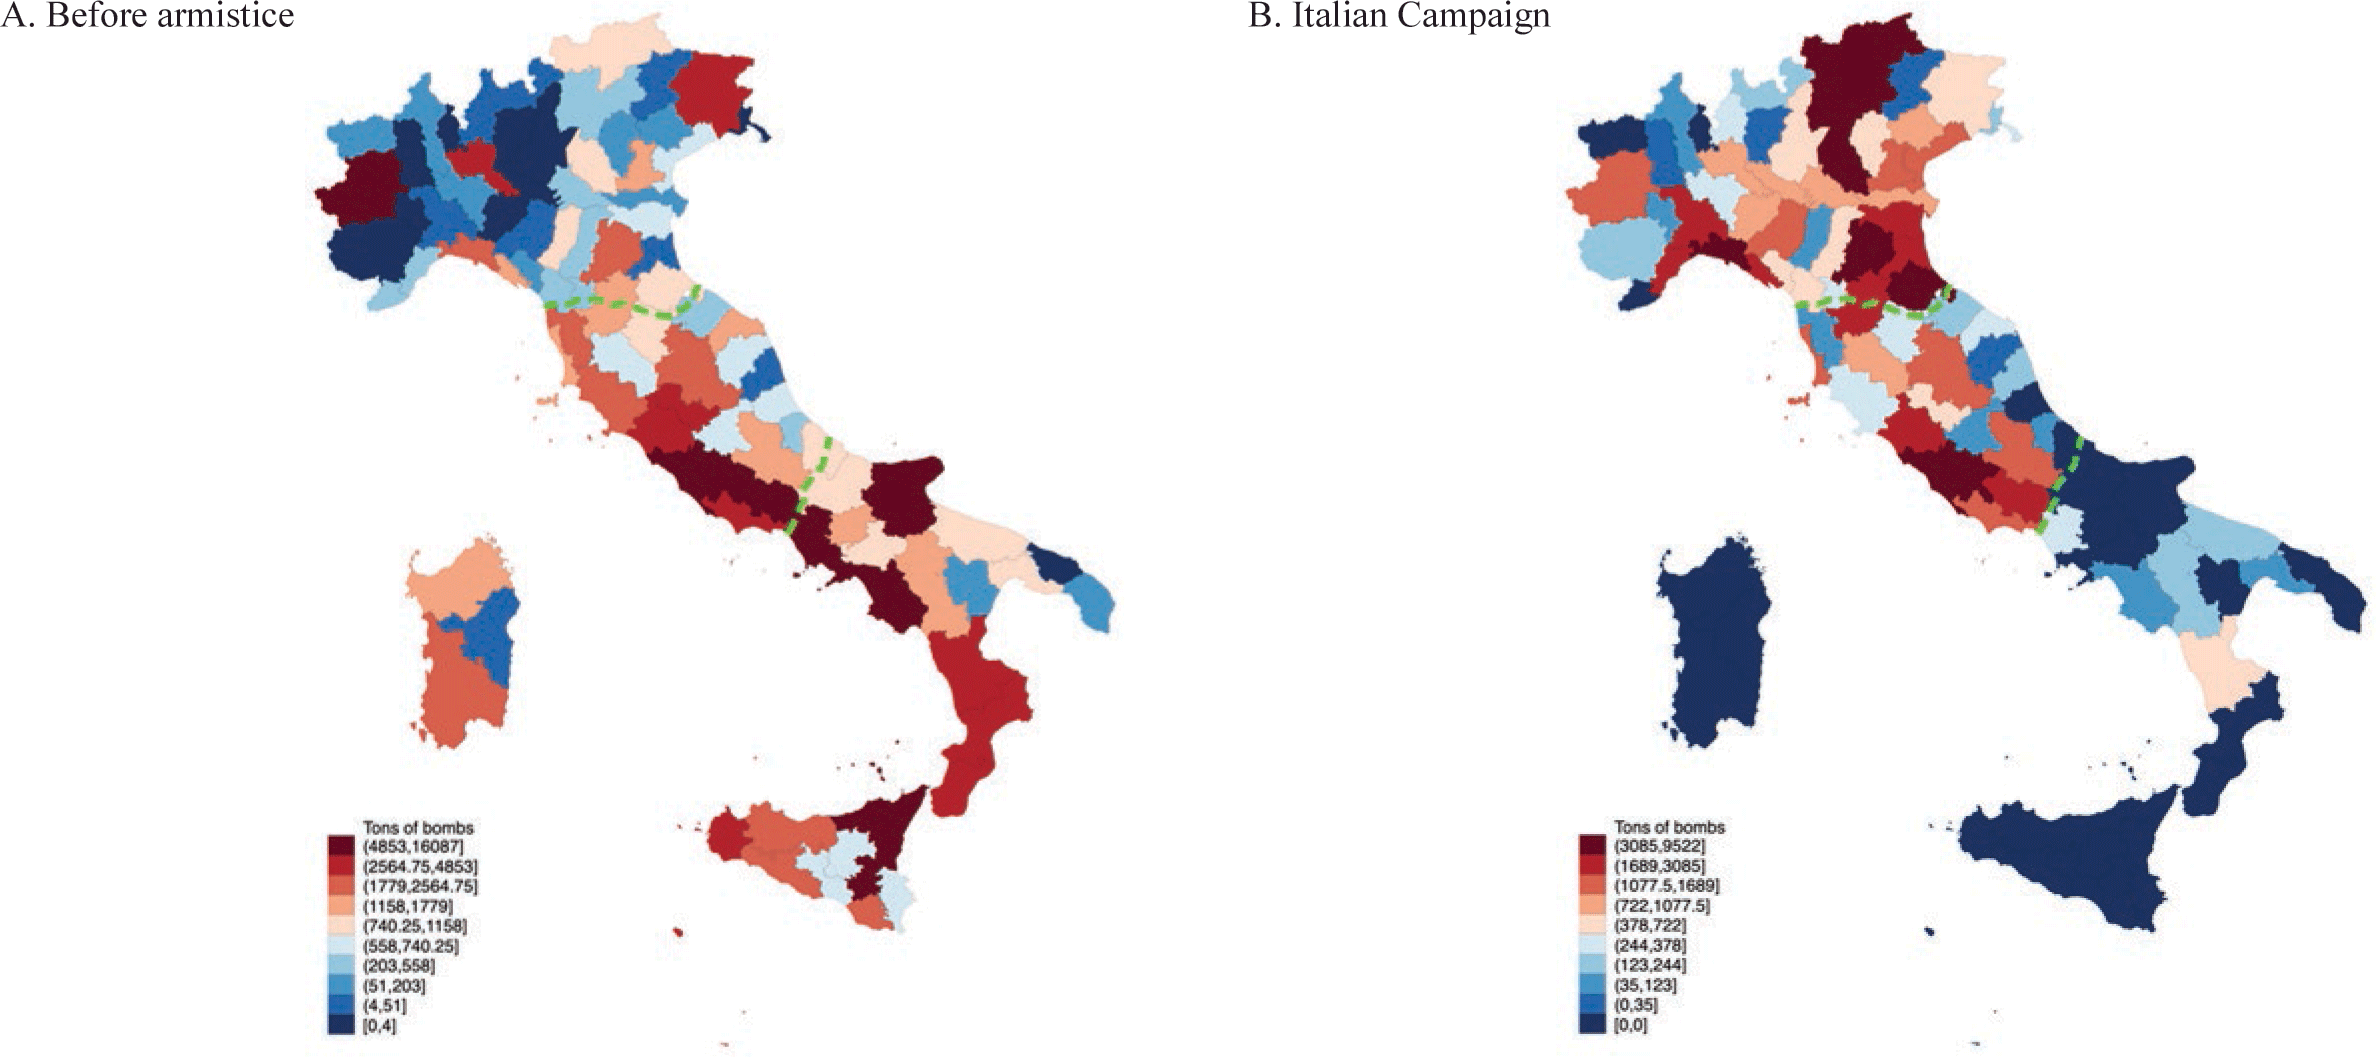
Figure 1 MAPS OF ALLIED BOMBING
Notes: These figures show the distribution of Allied bombings across Italian provinces. Panel A shows the distribution of bombings before the Armistice of Cassibile, on 3 September 1943. Panel B shows only the Allied bombings associated with the Italian Campaign: these air strikes happened after March 1944 and focused on targets related to land battles against the German forces. The two dotted green lines represent the two major German defense lines during the Italian Campaign: the Gothic Line in Northern Italy was active between August 1944 and March 1945; the Gustav Line in Center-Southern Italy was active between October 1943 and April 1944.
Sources: USAF Theater History of Operations Reports (THOR) Database, available at www.afri.au.af.mil/thor.
Late in the Italian Campaign, the Allied air forces used 82,520 tons of explosives against targets on Italian soil in 1,332 attacks (Table 1, Panel B, Column (2)). Of the 57,722 tons of explosives used in support of ground operations, 44,308 tons (77 percent) were dropped after February 1944. Similarly, of the 74,332 tons of explosives used to target transport infrastructure, 38,212 tons (51 percent) were dropped during the Italian Campaign.
Data on war damage come from the 1947 and 1949 “Italy’s country studies,” compiled by the ECA to document the condition of Italian public infrastructure. These data provide the monetary value of war-related damage to public infrastructure, as well as the share of roads and railways that were deemed unusable by U.S. officials.
Finally, we digitized the Italian road and railroad network just before WWII and immediately after the Marshall Plan (Online Appendix Figure A2). We use these data to measure how access to the main local economic centers, the provincial capitals, has changed over time in each province.
THE RECONSTRUCTION EFFORT
In this section, we show that more intense tactical bombing during the Italian Campaign is associated with the granting of more reconstruction funds.
The Correlation between Allied Bombing and ERP Aid
The destruction of Italian railroads and roads after WWII was major: according to both the 1947 and 1949 Italy Country Study by the ECA, 77 percent of roads and 44 percent of railroads were classified as unusable. Provinces with more bombings during the Italian Campaign suffered significantly more damage to public infrastructure during WWII. A 1-standard-deviation (σ) increase in the tons of explosives dropped (1,681 tons) correlates with an additional $8.8 million (in 2010 USD) in damages, a 21 percent increase from the mean (Table 2, Column (1), Panel A). However, the intensity of bombings did not translate into differential disruption of the local transportation networks. A 1 – σ increase in bombings correlates with only 0.17 percent fewer unusable roads and 0.84 percent fewer unusable railways (Table 2, Columns (2) and (3), Panel A). These findings indicate that Allied air attacks during the Italian Campaign did more damage, but the bombings were sufficiently intense across provinces to disrupt transportation networks to a similar extent (Fauri Reference Fauri2006). Footnote 11 Consequently, if the lack of an efficient transportation network was indeed one of the main obstacles to recovery, we would not expect to observe differential economic development across provinces between the end of WWII and the beginning of the Marshall Plan.
Table 2 BOMBINGS, DESTRUCTION, AND ERP AID

Sources: Data on funding from the Marshall Plan come from “Missione Americana ERP in Italia,” “Mutual Security Agency” bulletins, and the historical archive of the Istituto Mobiliare Italiano. Data on damages to public infrastructure (transportation system, sanitation system, and public buildings) come from “Italy: Country Study” by the ECA. The variable “Unusable roads” (railways) measures the share of roads (railways) that was deemed not usable by U.S. authorities in 1947. Province controls in Panel B include region fixed effects, population density, employment rate, industrial horsepower, share of industrial workers, and share of agricultural workers (all observed before WWII). Robust standard errors in parentheses, *** p<0.01, ** p<0.05, * p<0.1.
Importantly, our data show that provinces that had suffered more bombings and greater damage received significantly more reconstruction funds. A 1 – σ increase in the tons of explosives dropped correlates with an additional $17 million assigned for reconstruction projects, a 22 percent increase from the mean (Table 2, Column (4), Panel A). It is interesting to note that heavily bombed provinces received more reconstruction grant money at the expense of other forms of aid, such as in-kind subsidies (Table 2, Column (5), Panels A and B). The amount of explosives is also positively correlated with the value of loans given to private firms, but the relationship is small and not robust to the inclusion of province characteristics (Table 2, Column (6), Panels A and B).
The Characteristics of Funded Projects
Not all funds arrived immediately after the Marshall Plan began. Each year between 1948 and 1952, the ECA set a national quarterly budget and picked the projects to fund according to the results of a yearly Country Study (ECA 1951). Italian officials could predict neither prospective budgets nor the program’s duration.
Regardless of the amount of bombing they had received, all provinces employed most of their funds to reconstruct their transportation network. The average Italian province used 52 percent of its ERP grants for transportation infrastructure, 32 percent for public buildings, and only 15 percent for sanitation (Table 3). Footnote 12 This focus on improving transportation did not depend on the intensity of tactical bombings during the Italian Campaign and, therefore, not on the total amount of reconstruction funds either. This result is additional evidence that damage to the transportation network was one of the main obstacles to Italian recovery.
Table 3 CHARACTERISTICS OF FUNDED PROJECTS

Notes: This table shows statistics on the projects funded through ERP reconstruction aid in all provinces not in the regions of Sardegna or Sicilia (Column (1)), provinces in the first quintile of the distribution of explosives dropped during the Italian Campaign (Column (2)), in the second quintile (Column (3)), third quintile (Column (4)), fourth quintile (Column (5)), and fifth quintile (Column (6)). The variables named “Share of grants” divide the amount of grants used for a specific purpose by the total amount of grants received between 1948 and 1952 or in a given year. Costs are expressed in 2010 USD. “New infrastructure” identifies public works that did not reconstruct public infrastructure that was present before WWII.
Sources: “Missione Americana ERP in Italia,” “Mutual Security Agency” bulletins, and the historical archive of the Istituto Mobiliare Italiano.
The data indicate that widespread destruction became an opportunity for modernization with the arrival of international aid. Because WWII destroyed a larger portion of their infrastructure, provinces in the top quintile of tactical bombings were able to use their ERP aid to fully update their transportation network. Footnote 13 Instead of just rebuilding preexisting roads and railways, they could redesign their transportation system from the ground up. And their modern infrastructure then gave economic activities located in these provinces a key advantage at a turning point in Italian history, when the country fully opened to international trade for the first time after decades of Fascist autarkic policies. Footnote 14
If the project description uses words such as new construction, extension, or modernization, we classify the project as new infrastructure. By contrast, if it contained words such as reconstruction, restoration, or reactivation, we would consider the project a restoration of the existing infrastructure. Strikingly, the average province in the top quintile used 80 percent of its ERP funds to build new infrastructure, while the average province in the bottom quintile committed 98 percent of its budget to the reconstruction of old ones. Almost all new projects were aimed at modernizing the transportation network. Of all funds for new infrastructure, the share used for transportation was 96 percent in the top quintile and 100 percent in the bottom quintile.
Moreover, we use data on the Italian road and railroad network to measure how access to the main local economic centers, the provincial capitals, changed over time in each province. Specifically, we regress the average or median post-WWII change in commuting distance between the provincial capital and each municipality within a province on the amount of reconstruction grants assigned to each province. A 1 – σ ($15 million) increase in the reconstruction grants used for the transportation infrastructure is associated with a 22-kilometer decrease in the mean commuting distance to the provincial capital, a 1 – σ reduction in the commuting distance (Online Table A2, Panel A, Column (2)). Footnote 15 These results hold if we use the median change in commuting distance (Table A2, Panel A, Columns (5) and (6)) or if we consider only municipalities that were already connected to the network before WWII (Table A2, Panel B).
IDENTIFICATION
In this section, we show how the geographical distribution of Allied tactical bombings was not driven by preexisting economic conditions but rather followed the confrontations between Allied and German troops. As a consequence, two adjacent provinces with similar economic conditions might have received vastly different numbers of air strikes during the latter stages of the war.
The Distribution of Allied Bombings across Italian Provinces
After the Armistice of Cassibile on 3 September 1943, the Allied military strategy against Italy changed from strategic to tactical bombing (Figure 1, Panels B and C). As noted earlier, pre-armistice bombing was primarily strategic: the Allies mainly targeted factories in densely populated areas to destroy military production and weaken Italian morale. There is a positive relationship between the explosive tonnage dropped before the armistice in each province and its prewar economic features. Out of 22 proxies for prewar economic characteristics, 16 variables are significantly correlated with the amount of explosives dropped by Allied forces before the armistice (Table 4, Column (1)).
Table 4 CORRELATION BETWEEN PREWAR CHARACTERISTICS, WAR EVENTS, AND BOMBING
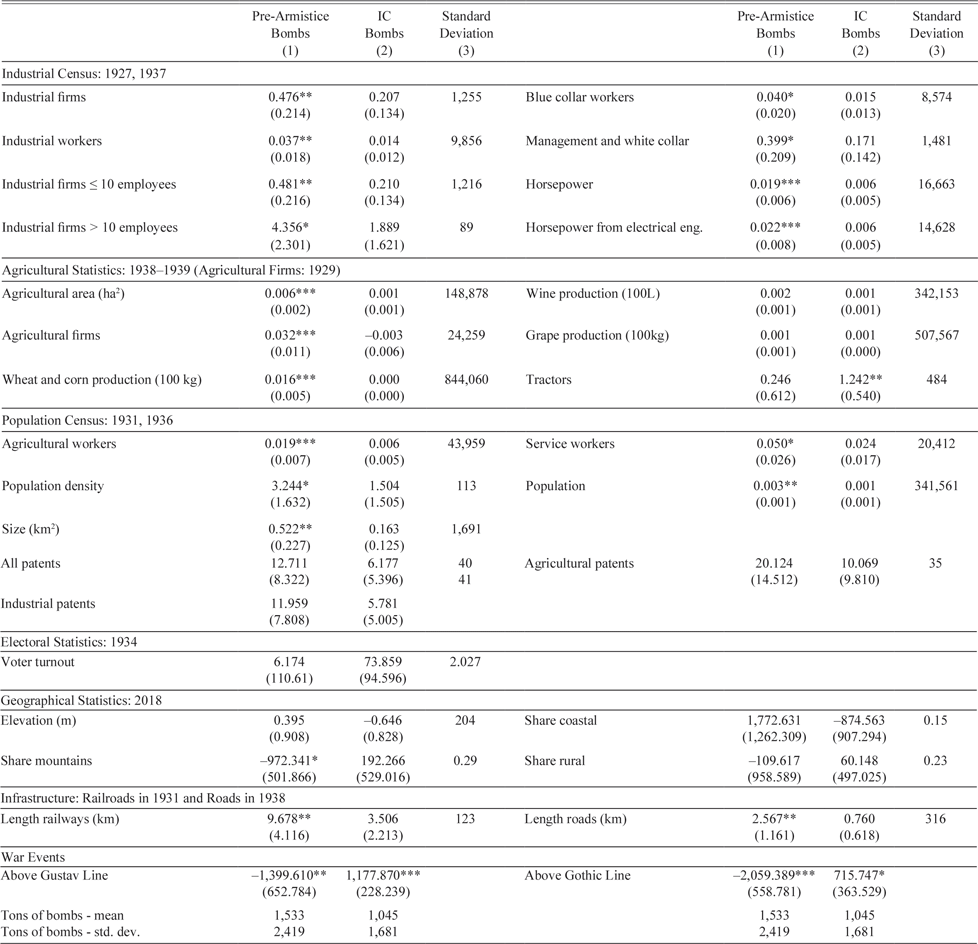
Notes: Each row-column combination shows the coefficient β 1 from a different regression of the tonnage of bombs in a province on a prewar variable: Tons p = β 0 + β 1 Pre-war characteristic pt + ε pt , where t < 1940. Column (1) uses the tons of explosive dropped by Allied forces before the armistice of 8 September 1943 as dependent variable. Column (2) uses the tons of explosives launched during the Italian campaign as dependent variable. When the independent variable comes from the Industrial Census, the regression also includes industry fixed effects. *** p<0.01, ** p<0.05, * p<0.1.
Sources: Censimento dell’Industria e dei Servizi, Annuario di Statistica Agraria, Censimento Generale della Popolazione, Statististica delle Elezioni Generali Politiche per la XXIX Legislatura, USAF Theater History of Operations Reports (THOR) Database.
Even if more bombings before the armistice resulted in more ERP aid after the war, we avoid this source of variation in the empirical analysis. The stark differences in prewar economic conditions between provinces that receive more or less strategic bombing would not allow us to isolate the role of the Marshall Plan on postwar recovery. Provinces that were more economically successful before the war, in fact, might have flourished after the war for a variety of reasons, and not only thanks to ERP aid. Our empirical analysis exploits, instead, the shift to tactical bombing that followed the Armistice of Cassibile.
We test whether prewar economic conditions are correlated with the amount of tactical bombing used during the Italian Campaign (Table 4, Column (2)). Variables measuring population, size of the province, number of industrial firms, agricultural output, and number of patents before the war cannot explain significant variations in the severity of tactical air strikes during the Italian Campaign. Footnote 16 In addition to having similar economic conditions, provinces with different intensities of tactical bombing also had similar levels of prewar political participation. Footnote 17 Similarly, the geographical characteristics of a province, such as elevation or the share of coastal municipalities, do not predict different levels of bombing during the Italian Campaign. Even the length of railroads in 1931 and the length of roads in 1938 in each province are not associated with more intense air strikes. These findings indicate that the mere presence of a more developed transportation network in a province was not sufficient to draw more bombings during the Italian Campaign.
Then what did predict more tactical air attacks? The moving location of the warfront, first on the Gustav Line in central Italy and then on the Gothic Line in northern Italy, partially explains why some provinces received more tactical bombings. Provinces above the Gustav Line, for example, were hit on average by 1,178 additional tons of bombs. The remaining variation in bombings between provinces above the Gustav Line is correlated with the movement of German troops and supplies. Overall, these findings suggest that the extent of tactical bombing in a province during the Italian Campaign mostly depended on war-related events, such as the movement of the warfront, rather than on its prewar economic conditions.
Empirical Specifications
We first estimate the following OLS specifications:
 $$\eqalign{ & {y_{pt}} = {\alpha _p} + {\gamma _{rt}} + \delta ({\mathop{\rm }\nolimits}Reconstruction \, {\rm{ }}grant{s_p} \times Post\,{1952_t}) \cr & + \sum\nolimits_{z = 1}^3 {{\mu _z}} trend_t^z \times Eco{n_p} + \sum\nolimits_{z = 1}^3 {{\theta _z}} trend_t^z \times Wa{r_p} + {\varepsilon _{pt}}, \cr} $$
.
where the unit of observation is province p and census year t. Footnote 18 Standard errors are clustered at the provincial level.
The dependent variable y pt is one of many measures of agricultural or industrial output obtained from the Italian Bureau of Statistics. Footnote 19 The regressions control for nonlinear differences in industrial outcomes by including fixed effects for provinces (α p ), and fixed effects for combinations of regions and census years (γ rt ). In addition, Equation (1) includes interactions between prewar provincial characteristics (population density, employment rate, industrial horsepower, share of industrial workers, and share of agricultural workers in 1937) and trends up to the third order. These variables (Econ p ) account for time-varying nonlinear output changes that are correlated with economic conditions observed before the start of the conflict. Finally, these regressions control for another war-induced effect (War p ): the loss of human capital. Footnote 20 Specifically, Equation (1) includes interactions between the share of war-related deaths in the province and trends up to the third order. The results are robust if we use alternative controls for war damage and ERP aid.
The variable Reconstruction grants
p
measures the value of reconstruction grants assigned to province p during the Marshall Plan. Post 1952
t
is a dummy variable equal to 1 for every post-ERP census year. The coefficient of interest δ measures changes in economic activity before and after the program began and between provinces that received different amounts of reconstruction funds. However, the OLS estimate of δ could be biased because the monetary amount of reconstruction grants assigned to a province can be related to unobservable characteristics in ${\varepsilon _{pt}}$
. We therefore instrument the amount of reconstruction grants in province p with the tons of explosives dropped by Allied forces in the same province during the Italian Campaign (IC Bombs
p
). This specification exploits variation in the timing and the target of Allied bombings between provinces with similar prewar conditions and total war-related deaths. These differences in tactical bombing during the Italian Campaign are plausibly exogenous, because they stem from the confrontations between the German and Allied armies on Italian soil.
${\varepsilon _{pt}}$
. We therefore instrument the amount of reconstruction grants in province p with the tons of explosives dropped by Allied forces in the same province during the Italian Campaign (IC Bombs
p
). This specification exploits variation in the timing and the target of Allied bombings between provinces with similar prewar conditions and total war-related deaths. These differences in tactical bombing during the Italian Campaign are plausibly exogenous, because they stem from the confrontations between the German and Allied armies on Italian soil.
The exclusion restriction states that, after controlling for trends in prewar characteristics (Econ p ) and total war-related damages in the province (War p ), the instrument IC Bombs p affects the outcome only through changes in reconstruction grants. While the exclusion restriction is not directly testable, we provide several pieces of evidence in support of our identification strategy. First, as highlighted by prior work on this topic, more bombing may directly lead to more negative postwar outcomes. However, in the Italian context, Allied bombing was sufficiently intense to render the transportation system largely unusable in all Italian provinces that experienced some bombing episodes, generating similar transportation constraints (Table 2, Columns (2) and (3)). Moreover, we find that areas with more bombings received more reconstruction funds during the Marshall Plan and experienced a larger economic expansion. Therefore, if there was a large negative direct effect of tactical bombing on postwar outcomes, it would bias our results toward zero.
Another potential concern is that, even if they were as good as random, the bombings may have affected other unobservable factors unrelated to the Marshall Plan but related to post-WWII recovery. However, any effect of tactical bombing that is not mediated by the Marshall Plan would become visible immediately after the first Allied air attacks or in the very first postwar years. By contrast, our analysis shows that any cross-provincial difference starts only after the completion of the first public infrastructure funded through the Marshall Plan, close to ten years after the first Allied air raids. In short, we think that it is implausible for omitted factors to have affected provinces with the exact substantial lag with which the Marshall Plan was implemented.
In addition to instrumental-variable regressions, we estimate reduced-form specifications that directly link the dependent variables to tactical bombings. We compare economic outcomes before and after the Marshall Plan between provinces bombed differentially during the Italian Campaign:
 $$\eqalign{
& {y_{pt}} = {\alpha _p} + {\gamma _{rt}} + \delta (IC\,Bomb{s_p} \times Post\,{1952_t}) + \sum\nolimits_{z = 1}^3 {{\mu _z}} trend_t^z \cr
& \,\,\,\,\,\,\,\,\,\,\,\,\,\,\,\,\,\,\,\,\,\, \times Eco{n_p} + \sum\nolimits_{z = 1}^3 {{\theta _z}} trend_t^z \times Wa{r_p} + {\varepsilon _{pt}}. \cr} $$
$$\eqalign{
& {y_{pt}} = {\alpha _p} + {\gamma _{rt}} + \delta (IC\,Bomb{s_p} \times Post\,{1952_t}) + \sum\nolimits_{z = 1}^3 {{\mu _z}} trend_t^z \cr
& \,\,\,\,\,\,\,\,\,\,\,\,\,\,\,\,\,\,\,\,\,\, \times Eco{n_p} + \sum\nolimits_{z = 1}^3 {{\theta _z}} trend_t^z \times Wa{r_p} + {\varepsilon _{pt}}. \cr} $$
.
The identification assumption in Equation (2) requires y pt to follow a similar prewar trend between provinces with different levels of bombing. In testing this assumption, we focus on agricultural outcomes because, for these variables, we have three consecutive observations before WWII: in 1937, 1938, and 1939. We first regress y pt on IC Bombs p , a linear trend, and the interaction of these last two variables (Table 5, Panel A). In all cases, y pt followed the same prewar trend across provinces with different levels of bombing. The same finding holds if we estimate nonlinear prewar trends by replacing the linear trend with two dummy variables for 1938 and 1939 (Table 5, Panel B). Footnote 21
Table 5 PREWAR TRENDS IN AGRICULTURAL OUTPUT

Notes: Panel A estimates linear trends in agricultural outputs before WWII. Panel B estimates nonlinear trends by including dummy variables for 1938 and 1939. Tons of IC bombs measures the tons of explosives dropped by Allied air forces against targets related to the Italian Campaign against German troops. The dependent variables are the production of wheat and corn in 100 kg (Column (1)), the production of wine in 100 L (Column (2)), the production of grapes in 100 kg (Column (3)), the number of tractors (Column (4)), the number of other agricultural machines (Column (5)), the hectares used for wheat and corn production (Column (6)). Standard errors clustered by province in parentheses, *** p<0.01, ** p<0.05, * p<0.1.
Sources: Censimento dell’Industria e dei Servizi, Annuario di Statistica Agraria, Censimento Generale della Popolazione, Istituto Nazionale di Statistica. USAF Theater History of Operations Reports (THOR) Database, available at www.afri.au.af.mil/thor.
THE EFFECTS OF RECONSTRUCTION GRANTS ON THE ITALIAN RECOVERY
In this section, we show that reconstruction grants received by Italian provinces through the Marshall Plan positively affected local economic development.Footnote 22
Agricultural Development
CROPS
We start by estimating OLS regressions of agricultural outcomes based on the reconstruction funds received by each province. We focus on four major Italian agricultural products: wheat and corn, grapes, and wine. A 1 – σ difference in the value of reconstruction grants ($29 million) increased wheat and corn production by 19.2 million kilograms, wine production by 16.8 million liters, and grape production by 21.2 million kilograms (Table 6, Panel A, Columns (1), (2), and (3)). Only the first coefficient is statistically different from zero and represents a 16 percent increase from the prewar baseline. We already acknowledged, however, that OLS regressions between economic outcomes and reconstruction funds might be biased due to an endogenous allocation of aid across Italian provinces.
Table 6 EFFECTS ON AGRICULTURAL OUTCOMES

Notes: Panel A shows OLS regressions of agricultural outcomes on the amount of reconstruction grants received by a province (in millions). Regressions in Panel B shows reduced-form regressions of agricultural outcomes on the tons of bombs dropped during the Italian Campaign in each province. Panel C shows instrumental-variable regressions in which the reconstruction grants received by a province (in millions) are instrumented with the amount of explosives dropped during the Italian Campaign. Regressions include province fixed effects, region-year fixed effects, prewar characteristics (population density, employment rate, industrial horsepower, share of industrial workers, share of agricultural workers) interacted with a trend up to the third order, and the share of war-related deaths interacted with a trend up to the third order. The dependent variables are the production of wheat and corn in 100 kg (Column (1)), the production of wine in 100 L (Column (2)), the production of grapes in 100 kg (Column (3)), the number of agricultural workers (Column (4)), the number of agricultural firms (Column (5)), the number of tractors (Column (6)), and the number of threshers (Column (7)). The estimating sample does not include provinces in Sardegna and Sicilia, because these regions were not affected by bombings related to the Italian Campaign. Standard errors clustered by province in parentheses, *** p<0.01, ** p<0.05, * p<0.1.
Sources: Censimento dell’Industria e dei Servizi, Annuario di Statistica Agraria, Censimento Generale della Popolazione, Istituto Nazionale di Statistica. USAF Theater History of Operations Reports (THOR) Database, available at www.afri.au.af.mil/thor.
We first estimate reduced-form regressions. We compare changes in agricultural outcomes before and after the Marshall Plan, between provinces hit by varying amounts of explosives during the Italian Campaign (Equation (2)). Provinces that suffered more tactical bombings experienced a disproportionate increase in agricultural production after 1952. A 1 – σ difference in tons of explosives (1,681 tons) is associated with 12 million additional kilograms of wheat and corn per province and post-ERP year (Table 6, Panel B, Column (1)). This effect represents a 10 percent increase from the prewar average. Similarly, wine production increased by 10.7 million liters, or 23 percent for each 1 – σ increase in tons of explosives, while grape production increased by 13.4 million kilograms, or 19 percent (Table 6, Panel B, Columns (2) and (3)). These results reflect an increase in agricultural production beyond prewar levels instead of just a faster recovery (Online Appendix Figure A5). Therefore, we can rule out the hypothesis that these findings are simply driven by mean reversion after more intense Allied bombings.
We then return to using the IV regressions to explore the direct link between reconstruction grants and agricultural variables. A 1 – σ difference in the amount of reconstruction grant money ($29 million) increased wheat and corn production by 27.3 million kilograms, wine production by 24.4 million liters, and grape production by 30.5 million kilograms. Footnote 23 Several tests reject the hypothesis that the tactical bombings are a weak instrument for reconstruction grants (Andrews, Stock, and Sun Reference Andrews, Stock and Sun2019; Online Appendix Table A5). These findings, which are in line with the reduced-form estimates but larger than the initial OLS estimates, suggest that the OLS estimates are negatively biased. The ECA representatives may have decided to assign a disproportionate amount of funds to poorer, lower-growth provinces, rather than favoring richer, faster-growing locations. Not considering the possibility of an endogenous allocation of aid would lead to an underestimation of the effect of the Marshall Plan on the Italian economy.
We can link the implementation of the Marshall Plan even more directly to agricultural development by estimating event studies. Yearly difference-in-differences estimates indicate that agricultural production increased only after the start of the Marshall Plan (Figure 2 for IV and Online Appendix Figure A6 for the reduced form). The amount of reconstruction funds does not predict differences in the production of wheat and corn during the war or in the postwar years preceding the Marshall Plan. The estimates become positive and statistically significant at the 5 percent level only in 1952, the year following the full distribution of ERP aid (Figure 2, Panel A). The production of grapes (Figure 2, Panel B) and wine (Online Appendix Figure A7, Panel A) followed a similar pattern.

Figure 2 EFFECTS OF RECONSTRUCTION GRANTS ON AGRICULTURAL PRODUCTION
Notes: These graphs show the effect of an additional $1 million in reconstruction grants on different crops. The amount of reconstruction grants received by a province is instrumented with the amount of explosives dropped during the Italian Campaign. The regressions also include province fixed effects and region-year fixed effects, as well as linear, quadratic, and cubic trends in several baseline characteristics (population density, employment rate, horsepower, share of industrial workers, share of agricultural workers) and in the share of war-related deaths. Standard errors are clustered at the province level. The vertical bars measure 95percent confidence intervals. The outcomes are the production of wheat and corn in each province, and year (100 kg, Panel A), grapes (100 kg, Panel B), asparagus (100 kg, Panel C), peaches (100 kg, Panel D), olives (100 kg, Panel E), and walnuts (100 kg, Panel F).
Source: Censimento dell’Industria e dei Servizi, Istituto Nazionale di Statistica. USAF THOR Database, available at www.afri.au.af.mil/thor.
THE AGRICULTURAL MARKET AND THE ADOPTION OF NEW TECHNOLOGY
The reconstruction grants led to structural changes in the agricultural sector. Specifically, provinces that received more reconstruction funding saw a larger decline in the agricultural workforce. A 1 – σ difference in the amount of reconstruction money ($29 million) decreased the number of agricultural workers by 22,309, a 23 percent reduction relative to the prewar workforce (Table 6, Panel C, Column (4)). We do not observe statistically significant changes in the number of agricultural firms, although the estimated coefficient is positive (Table 6, Panel C, Column (5)).
Provinces that suffered more bombings had more tractors after 1952. A 1 – σ difference in the amount of reconstruction funds ($29 million) increased the number of tractors after 1952 by 1,956 per province and year, a 430 percent increase from the prewar baseline (Table 6, Panel C, Column (6)). Yearly difference-in-differences estimates show how the surge in the number of tractors did not happen immediately after the end of the war, but only after the full disbursement of reconstruction money (Online Appendix Figure A8, Panel A). Footnote 24 The number of motorized agricultural machines per province and year increased by 3,609 (Online Appendix Table A6, Panel B, Column (8), and Online Appendix Figure A7, Panel E), a 467 percent increase from the prewar baseline.
We observe increased adoption only of state-of-the-art tools. Steam-powered threshers, for example, became obsolete during the twentieth century with the progressive introduction of tractor-powered harvester-combines (Pingali Reference Pingali, Evenson and Pingali2007). Not surprisingly, the number of threshers did not increase significantly after WWII in provinces with more reconstruction money (Table 6, Panel C, Column (7), and Online Appendix Figure A8, Panel B). Footnote 25
SUMMARY OF MAIN FINDINGS
The historical literature (Fauri Reference Fauri2006) and qualitative evidence (Online Appendix B) identified the lack of a working transportation system as one of the main obstacles to local economic recovery in Italy. The hypothesis is that an updated and modernized network of roads and railways allowed local farmers to sell their products farther and faster. There are two main pieces of evidence that are consistent with this idea.
First, besides the substantial increases in the production of all major crops, such as wheat and grapes, we find that the effects of reconstruction grants are larger in magnitude for more perishable crops. This result speaks about the importance of a more efficient transportation network because a decrease in transit time to markets would have proven particularly beneficial for agricultural products with a short post-harvest life. A 1 – σ difference in reconstruction funds ($29 million) increased the production of asparagus (post-harvest life below two weeks; El-Ramady et al. Reference El-Ramady, Eva Domokos-Szabolcsy, Abdalla, Fari and Lichtfouse2015) by 665 percent, peaches (post-harvest life between two and four weeks) by 700 percent, and pears (post-harvest life between two and four weeks) by 947 percent (Online Appendix Table A7, Panel B, Columns (1) to (3)). The estimated effects of reconstruction grants are substantially smaller for crops with low perishability. A 1 – σ difference in reconstruction grant money ($29 million) decreased the production of walnuts (post-harvest life above 16 weeks) by 19 percent, and increased the production of potatoes (post-harvest life between 8 and 16 weeks) by 22 percent (Table A7, Panel B, Columns (4) and (5)). Both coefficients are not statistically different from zero. Moreover, reconstruction grants are not associated with a significant increase in the production of crops that are concentrated in areas (mainly southern provinces) with very low exposure to post-armistice bombings, such as oil, olives, and tomatoes (Table A7, Panel B, Columns (6) to (8)).
Second, we can leverage the data on approved projects to estimate event-study regressions in which the event in period 0 is represented by the completion of the first large transportation projects in each province (Online Appendix C). The results of the event studies indicate that increases in agricultural production in each province began only after the completion of the first transportation infrastructure funded through the Marshall Plan. Footnote 26
Third, we can perform a mediation analysis that tests how much of the main treatment effects can be explained by improvements in the transportation network, which are measured by the average post-WWII change in commuting distance between the provincial capital and each municipality within a province. A shorter commuting distance can explain 58 percent of the increase in the production of wheat and corn, 15 percent of the increase in the production of grapes, and 16 percent of the increase in the production of wine (Online Appendix Table A9). These results indicate a large influence of the transportation system on agricultural development if we consider that the post-WWII change in commuting distance to the provincial capital is only an imperfect proxy for the modernization of the road network.
After this initial expansion in agricultural production, driven by the modernization of the transportation network, farmers accrued wealth that they at least partially invested in state-of-the-art machinery, such as general-purpose tractors. This investment in capital helped decrease the need for labor and further expand agricultural production. Footnote 27
The Industrial Sector
After the war, workers who chose to leave the agricultural sector readily found employment in industrial firms, since the booming industrial sector of postwar Italy offered more job opportunities and higher salaries (Online Appendix Figure A4, Panel D). And this industrial expansion was greater after 1952 in those provinces that had received more ERP reconstruction money. A 1 – σ difference in the amounts of reconstruction funds ($29 million) increased the number of industrial firms by 203 units per province and sector—29 percent more than the prewar baseline (Table 7, Panel C, Column (1)). This change was largely driven by small establishments with at most ten employees, since the number of larger firms did not correlate with reconstruction grants (Table 7, Panel C, Columns (2) and (3)). Footnote 28
Table 7 EFFECTS ON INDUSTRIAL OUTCOMES

Notes: Panel A shows OLS regressions of industrial outcomes on the amount of reconstruction grants received by a province (in millions). Regressions in Panel B shows reduced-form regressions of industrial outcomes on the tons of bombs dropped during the Italian Campaign in each province. Panel C shows instrumental-variable regressions in which the reconstruction grants received by a province (in millions) are instrumented with the amount of explosives dropped during the Italian Campaign. Regressions include province fixed effects, industry fixed effects, region-year fixed effects, prewar characteristics (population density, employment rate, industrial horsepower, share of industrial workers, and share of agricultural workers) interacted with a trend up to the third order, and the share of war-related deaths interacted with a trend up to the third order. The dependent variables are the number of firms in a province, industry, and census year (Column (1)), the number of firms with fewer than 10 employees (Column (2)), the number of firms with more than 10 employees (Column (3)), the number of employees (Column (4)), the number of blue-collar workers (Column (5)), the number of managers and white collar workers (Column (6)), and the number of workers in the service sector (Column (7)). The industries are food, paper, chemicals, construction, mining, mechanical engineering, metallurgy, textile, and clothing. The estimating sample does not include provinces in Sardegna and Sicilia, because these regions were not affected by bombings related to the Italian Campaign. Standard errors clustered by province in parentheses, *** p<0.01, ** p<0.05, * p<0.1.
Sources: Censimento dell’Industria e dei Servizi, Annuario di Statistica Agraria, Censimento Generale della Popolazione, Istituto Nazionale di Statistica. USAF Theater History of Operations Reports (THOR) Database, available at www.afri.au.af.mil/thor.
More firms created more jobs. A 1 – σ difference in reconstruction funding ($29 million) increased the post-ERP number of industrial employees by 2,423, or 62 percent per industry, province, and census year (Table 7, Panel C, Column (4)). This increase is more pronounced among white-collar and managerial positions relative to blue-collar jobs (Table 7, Panel C, Columns (5) and (6)). Similarly, a 1 – σ difference in reconstruction grant money ($29 million) increased the number of workers in the service sector by 5,898, or 36 percent—per province and census year (Table 7, Panel C, Column (7)). Footnote 29
Difference-in-differences estimates for each census year provide more insights into the timing of the effects (Online Appendix Figure A8, Panels C–F). In 1951, three years into the implementation of the Marshall Plan, provinces experiencing different bombing levels during the Italian Campaign had similar levels of industrial outcomes. In 1961, nine years after the full distribution of grants through the ERP, provinces that had suffered more bombings had significantly more industrial firms and workers. The effect peaked in 1971, then decreased between 1981 and 2001, suggesting that the initial divergence between provinces was only temporary.
Finally, we use newly digitized patent data to analyze the creation of intellectual property. Individuals and firms in provinces with more reconstruction funds invested more in the development of newer technologies, but this effect was short-lived. The number of patents issued in provinces with more bombings decreased significantly during the conflict (Online Appendix Figure A10, Panel A for reduced-form and Panel B for IV); local patent offices were less likely to operate in areas that were subject to more air attacks. Immediately after WWII, however, the number of patents issued to domestic inventors bounced back, probably due to a backlog of patent applications. After this initial effect subsided, the number of patents issued in provinces with more reconstruction money started rising again after 1952. By 1957, however, we observe no significant difference in the number of new patents between provinces with varying amounts of reconstruction grant money (Figure A10, Panel B).
ROBUSTNESS CHECKS
Controls for Geography
Our main results are robust to several checks that control for the geographical location of each province. First, dropping from the estimating sample all provinces that are within 500 km of the Brenner Pass (the main gateway toward Austria) and therefore cannot reasonably have any advantage in trading with Germany, does not affect our findings (Online Appendix Table A12, Panel A). Similarly, our results hold if we include a dummy that identifies provinces through which the Brenner Highway, the most direct road to that border, passes, and interacts with trends up to the third order (Table A12, Panel B). More generally, the results hold if we control for nonlinear trends correlated with any highway leading abroad, not just the Brenner Highway (Table A12, Panel C), or with the cumulative length of all main roads in 1938 (Table A12, Panel D).
Second, controlling for nonlinear trends that are correlated with geographic characteristics does not affect the results (Online Appendix Table A13, Panel A). Likewise, augmenting the baseline specification with controls for soil fertility in 1961 (the first year available) or with geographic coordinates, all interacting with trends up to the third order, does not change our main findings (Table A13, Panels B and C). Footnote 30
Finally, our results are robust to including all Italian provinces, rather than excluding provinces located in Sicilia and Sardegna (Online Appendix Table A14, Panel A); to dropping all provinces in southern Italy, which were subject to fewer (if any) tactical bombings during the Italian Campaign (Table A14, Panel B); and to estimating spatial HAC standard errors (Conley Reference Conley1999) that control for spatial correlation between geographical areas (Online Appendix Table A15).
War-Related Damage, Other ERP Aid, Government Spending, and Corruption
We test whether other historical facts, such as war-related events, other forms of ERP aid, or contemporaneous investments made by the Italian government, may explain part of the treatment effects.
First, we consider the role of war events by controlling for the bomb tonnage dropped by Allied forces before the armistice interacted with trends up to the third order. This specification leaves our estimates quantitatively unchanged (Online Appendix Table A16, Panel A).
Second, we check that our results are robust to controlling for other types of ERP funds, such as in-kind aid and loans, and for war-related deaths (Table A16, Panels B and C). Footnote 31 We control for the concurrent spending by the Italian government by including public investments in the transportation network and total spending on infrastructure from 1946 to 1952 and from 1953 to 1970. Footnote 32 While the effects on industrial firms are diminished, all the other estimated coefficients are statistically significant and close to the baseline (Table A16, Panels D and E).
Third, a potential concern in the interpretation of our results may arise if local lobbying and corruption played a major role in the allocation of Marshall Plan resources. Although data on corruption in the postwar years are not available, the U.S. authorities analyzed each individual project and closely monitored the disbursement of Marshall Plan funds exactly to prevent local lobbying. Moreover, all our main specifications include region-year fixed effects, which capture most of the intra-national variation in the level of corruption.
Alternative Specifications of Bombings
The robustness of our results does not depend on how the treatment variable is defined. First, the data support the existence of a linear relationship between the tonnage of Allied bombs dropped on a province and the amount of ERP reconstruction money received. Online Appendix Figure A11, Panel A, shows that several provinces did not receive any Allied bombings, while some provinces were hit by a disproportionate tonnage of explosives. Footnote 33 When we drop these outliers from the sample, we find that the main findings are robust (Online Appendix Table A18, Panels A and B).
Second, alternative specifications of bombings are worse predictors of war damage and the amount of reconstruction funding (Online Appendix Table A19). Specifically, a 1 – σ difference in the tons of Allied bombs dropped predicts a 22 percent increase in reconstruction money and a 21 percent increase in damage. Dividing the tonnage of Allied bombs by either the area of the province or by the number of residents in 1937 shows correlations with these two variables that are at least 5 percentage points smaller.
Third, using the tonnage of Allied bombs dropped from September 8, 1943—the day the Armistice of Cassibile was publicly announced—instead of from March 1944 does not change the main findings (Online Appendix Table A18, Panel C). Footnote 34
Fourth, our results are robust to the inclusion of bridges, tunnels, airports, and waterways in the number of targets included in the treatment variable (Table A18, Panel D).
CONCLUSIONS
In this paper, we have examined the effect of the Marshall Plan on the Italian postwar economy. The modernization of transportation systems was associated with (i) an increase in agricultural production despite a decrease in the number of agricultural workers, (ii) a more widespread adoption of modern agricultural machines, and (iii) an expansion of the industrial and service sectors. These findings indicate that, in addition to influencing Italian institutions, the Marshall Plan had beneficial effects on local economic development. Within each Italian macro-region, the amount of ERP reconstruction grant money had a profound impact on the economic growth of otherwise similar nearby provinces.
Are these findings informative for the debate on the returns on new infrastructure in the European and North American economies? On the one hand, we must acknowledge that our estimates might represent an upper bound of the effects that we would observe if we could redesign the current public infrastructure in Italy, other European countries, or the United States. This is because, for ideological reasons, prewar fascist Italy deliberately gave a low priority to national and international trade and declined to invest in maintaining high-quality infrastructure in the prewar years. This makes the case of Italy different from that of modern high-income economies—like those in much of Europe or the United States. On the other hand, the Marshall Plan is one of the most recent examples of large-scale modernization of public infrastructure in high-income European countries. In this sense, this setting shows how a developed economy with plenty of highly skilled human capital and functioning institutions benefits from a more efficient stock of infrastructure.


