


Key Findings
1. Commercial point-of-care diagnostic tests for respiratory pathogens have large potential financial impact.
2. Published reports on test performance, often funded by diagnostics companies, may be prone to bias.
3. We reviewed published studies and identified gaps in reporting and risk of bias.
4. These biases should be considered in the appropriate application of point-of-care testing.
Introduction
Group A Streptococcus, Streptococcus pneumoniae, and influenza virus are common respiratory pathogens in both community and hospital settings. Group A Streptococcus causes acute pharyngitis, rheumatic fever, rheumatic heart disease and acute post-streptococcal glomerulonephritis [Reference Carapetis1]. S. pneumoniae causes community-acquired pneumonia and meningitis, with significant economic burden [Reference Drijkoningen and Rohde2]. Influenza, including pandemic strains such as H1N1 in 2009, causes morbidity and mortality despite vaccination, due to antigenic shift and an ageing population [Reference Molinari3].
Point-of-care (POC) diagnostic testing is defined as testing conducted at the bedside by primary care physicians and nurses to provide rapid diagnostic information for clinical decision-making [Reference Blyth, Booy and Dwyer4]. POC tests for respiratory infections such as Group A Streptococcus, S. pneumoniae, and influenza virus may be applied to respiratory specimens, or to urine [Reference Abanses5–Reference Lean7]. These tests are often lateral flow devices containing paper impregnated with antibodies specific to antigens found in the pathogen of interest. When the device is exposed to a patient specimen containing the antigen of interest, there is a colour change indicating a positive test result without the use of costly laboratory equipment [Reference Pai8].
The clinical and economic impact of POC diagnostic testing is unknown, though POC testing for influenza has been shown to reduce the use of additional tests, decrease patient time in emergency departments, and decrease costs [Reference Abanses5] It has also decreased overall antibiotic use and duration, and encouraged appropriate use of antivirals when positive [Reference Noyola and Demmler6]. POC testing for Group A Streptococcus may streamline management of patients with pharyngitis [Reference Lean7].
Considering potential beneficial cost impacts, many reports are published on POC test performance. Many published studies reporting these quality studies are funded by diagnostics companies, and are prone to biases in design or reporting, which may overestimate, or underestimate, the true performance of these tests. Biased estimates of test performance may lead to biased estimates of the impact of POC tests.
In 2003, the Standards for Reporting of Diagnostic Accuracy (STARD) Initiative published a standard list and flow diagram for studies of diagnostic accuracy, to encourage accurate, transparent reporting [Reference Bossuyt9]. This was further updated in 2015 with expanded criteria [Reference Cohen10]. The Quality Assessment of Diagnostic Accuracy Studies (QUADAS) tool for evidence-based assessment of diagnostic accuracy in systematic reviews was developed in 2003 and revised in 2011 [Reference Whiting11, Reference Whiting12]. QUADAS evaluates study design and identifies potential sources of bias using seven different criteria, as well as threats to transportability of research results.
In 2009, Fontela et al. reported on the quality of 90 studies of POC tests for HIV, tuberculosis and malaria using QUADAS and STARD, and demonstrated moderate- to low-quality and poor reporting [Reference Fontela13]. Common sources of bias were inadequate description of withdrawals and reference test execution, index test and reference test review bias, and under-reporting of uninterpretable results. Less than 25% of the included studies reported methods for calculation and estimates of test reproducibility, adverse effects, estimates of diagnostic accuracy between subgroups, distribution of severity of disease or other diagnoses in study participants, number of eligible patients who did not participate in the study, blinding of the test readers, description of the team executing the test and management of indeterminate, invalid or outlier results [Reference Fontela13]
In 2013, Jafari et al. investigated quality of studies of POC tests for Treponema pallidum (n = 33) using the same criteria, and demonstrated that five quality items remained unaddressed in 60% of papers, and clinical review bias, index test review bias, lack of reporting of uninterpretable results, reference test review bias and poor description of loss of patients were detected [Reference Jafari14]. Wilczynski reviewed 240 studies from 2001 to 2005 and showed no improvement in completeness of reporting of following the initial publication of the STARD criteria [Reference Wilczynski15].
Our objective was to explore completeness of reporting and limitations of applicability among studies reporting POC diagnostic testing performance for Group A Streptococcus, S. pneumoniae, and influenza virus.
Methods
Article search strategy
A PubMed search was conducted using defined search criteria (‘Group A Streptococcus [explode]’, ‘Pneumococcus [explode]’, ‘Influenza [explode]’). Studies were screened based on title and keywords and abstract by author MH. Inclusion and exclusion criteria were then applied to full-text studies by MH and PD.
Screening paper eligibility
The inclusion criteria were original studies published in English in peer-reviewed journals, which included clinical specimens from human subjects, were published between 2004 and 2015, and which reported diagnostic performance of commercial POC tests for either Group A Streptococcus, S. pneumoniae, or influenza A or B. Studies were excluded if they did not include original data, if tests could not be performed outside of a microbiological laboratory, if full text was not available or duplicate reports.
Data abstraction
The data extracted from included studies were year of publication, continent of origin, journal name, commercial name of index test performed, reference standard test performed, the number of patients ongoing each test, stated industry involvement as defined by donation of test kits or statement of involvement and stated conflict of interest as defined by explicit mention in the report. Each article was analysed by two of three authors (MH, SB or CP). Discrepancies in interpretation were resolved by a fourth author (PD).
Methodological applicability and bias assessment using QUADAS-2
Methodological applicability and risk of bias were assessed using QUADAS-2 items, and determined to be of low, high or unclear risk of bias for each item in the tool. These assessments refer to the risk of incorrect study conclusions based on study methods. See Table 1 for an explanation of the QUADAS-2 assessment criteria [Reference Cohen10]. The proportion of high or unclear risk of bias was compared between studies of each organism using Pearson χ2.
Table 1. QUADAS-2 criteria
Reporting completeness assessment using STARD 2015
Reporting quality was assessed using the STARD 2015 checklist. Studies were evaluated based on the presence or absence of each criterion.
Statistical analysis was completed using SPSS (IBM® SPSS® Statistics Version 21, USA). All studies meeting inclusion criteria were analysed, and missing data were recorded as ‘not reported’. STARD 2015 completeness scores were not combined into an overall score, as recommended by the original authors [Reference Cohen10], but reported as counts of criteria achieved. Pearson χ 2 was used to compare the proportion of criteria achieved.
Ethics
Because patient information was not analysed, ethics approval was not required.
Results
Article search, screening and data abstraction
The PubMed search identified 34 174 potential studies (Fig. 1). Of these, 33 738 were excluded by removal of duplicate studies, review of title, keyword and abstract, and 340 studies were further excluded by full-text review. Overall, 96 studies were included, including antigen tests from throat swabs for Group A Streptococcus (n = 18), antigen tests from urine for S. pneumoniae (n = 19) and antigen and molecular tests for influenza (n = 60) (Table 2).
Fig. 1. Study selection.
Table 2. All included studies
1International Journal of Infectious Diseases, 2Journal of Pediatrics, 3International Journal of Pediatric Otorhinolaryngology, 4European Journal of Pediatrics, 5Journal of Clinical Microbiology, 6Canadian Journal of Infectious Diseases and Medical Microbiology, 7Korean Journal of Laboratory Medicine, 8Indian Journal of Pediatrics, 9Scandinavian Journal of Primary Health Care, 10Iranian Journal of Microbiology, 11Clinical Pediatrics, 12Ear Nose & Throat Journal, 13Military Medicine, 15Clinical and Vaccine Immunology, 16Japanese Journal of Infectious Disease, 17Journal of Infection and Chemotherapy, 18Diagnostic Microbiology and Infectious Disease, 19Scandinavian Journal of Infectious Disease, 20European Journal of Emergency Medicine, 21Clinical Infectious Diseases, 22BioMed Central Infectious Diseases, 23Emergency Medicine Journal, 24Pediatric Infectious Diseases Journal, 25Journal of Microbiological Methods, 26Journal of Microbiology, Immunology, and Infection, 27European Journal of Clinical Microbiology and Infectious Disease, 28Journal of Infection and Public Health, 29Journal of Clinical Virology, 30Clinical Microbiology and Infection, 31Indian Journal of Medical Microbiology, 32Saudi Medical Journal, 33Journal of Virological Methods, 34Yonsei Medical Journal, 35Journal of Microbiology and Biotechnology, 36Emerging Infectious Diseases, 37Pediatric Emergency Care, 38Postgraduate Medicine, 39Journal of Medical Microbiology, 40Public Library of Science, 41Clinical Chemistry and Laboratory Medicine, 42European Journal of Pediatrics, 43Acta Biochimica Polonica, 44The Journal of International Medical Research, 45Journal of Infection, 46American Journal of Emergency Medicine, 47Journal of Medical Virology, 48Journal of the Formosan Medical Association, 49Journal of Infection in Developing Countries, 50Medical Journal of Malaysia, 51British Journal of Biomedical Science.
Study characteristics are summarised in Table 3. The median number of patients included per study for both index and reference tests was 303. Most studies were reported from Europe (42/96, 43.8%). Influenza tests were over-represented due to the 2009 pandemic year, with 37 studies published in 2009 out of 60 total studies on influenza tests (62%). Industry involvement was admitted or unclear in 65/96 studies (67.7%).
Table 3. Description of included studies (n = 96)
Methodological applicability and bias assessment using QUADAS-2
A summary of QUADAS-2 assessment can be found in Table 4, and a comparison of bias by QUADAS-2 domain is found in Figure 2.
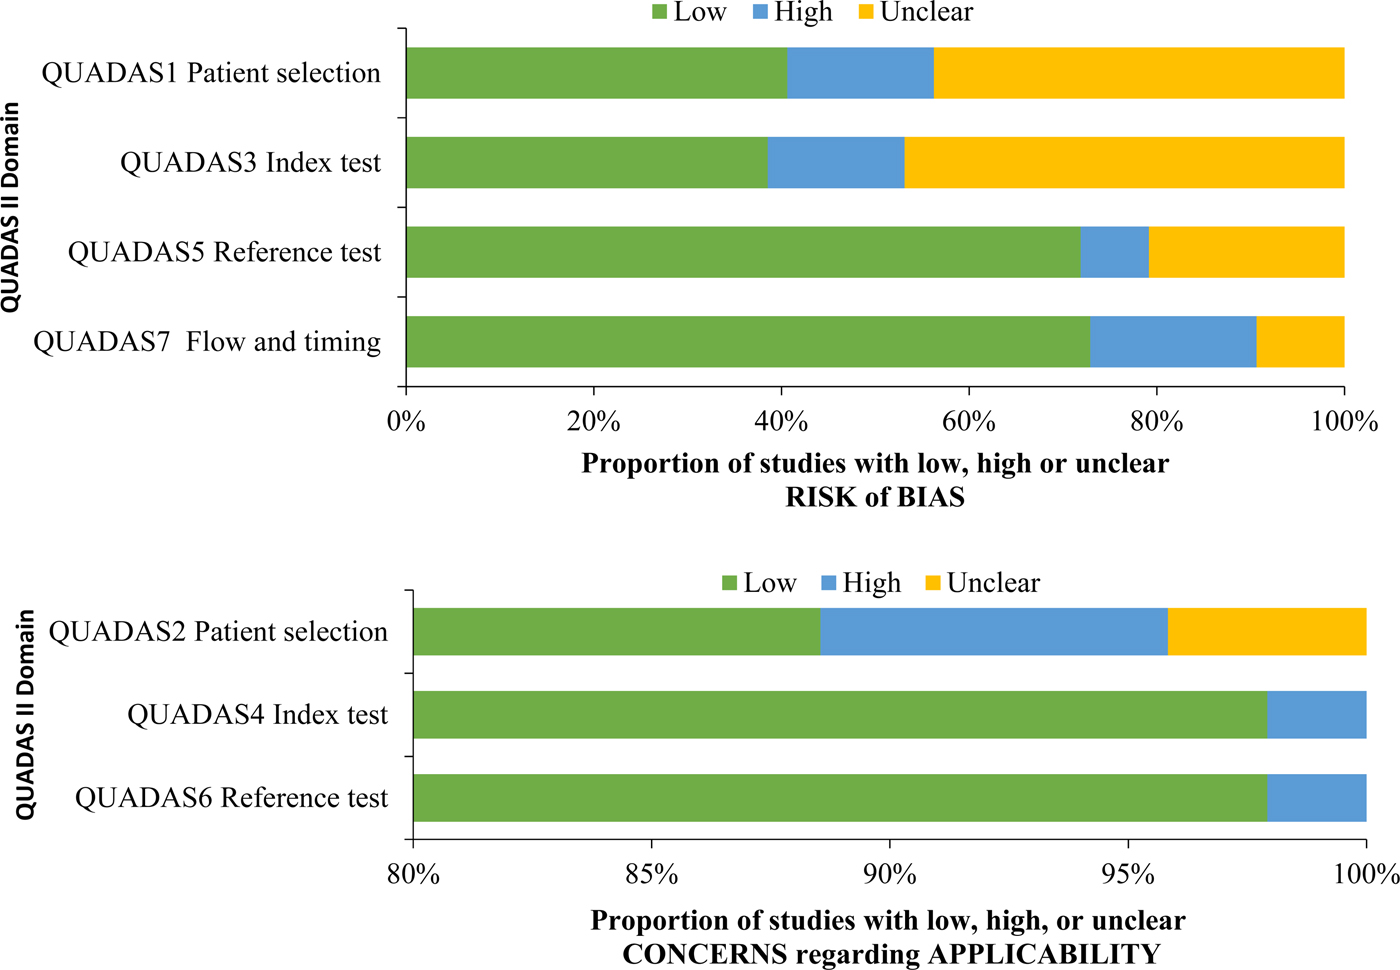
Fig. 2. QUADAS criteria among all studies (n = 96).
Table 4. QUADAS-2 results
Studies demonstrated a low risk of bias in three of the seven QUADAS-2 criteria, related to applicability, namely QUADAS2 (patient selection applicability), QUADAS4 (index test applicability) and QUADAS6 (reference test applicability). Studies demonstrated a high or unclear risk of bias in four of the seven QUADAS-2 criteria, related to risk of bias, namely QUADAS1 (patient selection risk of bias), QUADAS 3 (index test risk of bias), QUADAS5 (reference test risk of bias) and QUADAS 7 (flow and timing risk of bias). For QUADAS1, 15 studies (15.6%) demonstrated a high risk of bias, and 42 studies (43.8%) demonstrated an unclear risk of bias. For QUADAS3, 14 studies (14.6%) demonstrated a high risk of bias, and 45 studies (46.9%) demonstrated an unclear risk of bias. For QUADAS5, seven studies (7.3%) demonstrated a high risk of bias, and 20 studies (20.8%) demonstrate an unclear risk of bias. For QUADAS7, 17 studies (17.7%) demonstrated a high risk of bias and nine studies (9.4%) demonstrated an unclear risk of bias.
The proportion of studies with a high or unclear risk of bias for each QUADAS criterion was statistically similar between studies by an organism, except QUADAS5 (reference test risk of bias), which demonstrated a higher proportion of a high or unclear risk of bias among studies of influenza (81.7%) compared with studies of Group A Streptococcus (55.65) and S. pneumoniae (55.6%) (P = 0.022).
Quality of reporting assessment using STARD 2015
A summary of STARD 2015 assessment by an organism can be found in Table 5. The mean STARD compliance among all studies was 11/30 criteria (s.d. 4.3). Only two studies (2.1%) explicitly stated compliance with the STARD reporting guidelines. Mean STARD compliance between studies by an organism was similar (Group A Streptococcus 11.7 criteria, S. pneumoniae 13.4 criteria, influenza 10.0 criteria) (P = 0.38). Twenty criteria had low inclusion (<50% of studies included the criterion) (criteria 1, 2, 4, 5, 6, 9, 10, 12, 13, 14, 15, 16, 18, 20, 21, 22, 24, 25, 26, 28).
Table 5. STARD 2015 criteria with 25% or less inclusion
Discussion
We identified four QUADAS-2 criteria associated with a risk of bias that were at a high risk or unclear risk of bias among included studies. Studies performed better among criteria associated with applicability.
Patient selection risk of bias (QUADAS1)
To minimise the risk of bias in patient selection, a study should have appropriate methods of recruiting patients, such as either consecutive patients who present for care over time, or a random selection from a larger subset of patients. Included patients should be of heterogeneous composition, because exclusion of complex patients may overestimate test accuracy and compromise external validity of the study, whereas exclusion of healthy patients could underestimate test accuracy. Furthermore, case–control designs in which patients with obvious disease are selected as cases, and patients without obvious disease are selected as controls, could overestimate test accuracy through selection bias. We observed a large proportion of studies (42 studies, 43.8%) in which the assessment of risk of bias in patient selection was unclear, meaning that reports did not contain adequate information to reassure the reader that the risk of bias was low. Without this information, it is difficult to make inferences on the validity of the study.
Conduct or interpretation of index test (QUADAS3)
If index tests are interpreted with knowledge of the results of reference tests, index test interpretation may be biased towards overestimation of test accuracy. To prevent this bias, operators performing the test must perform the index test prior to the reference test, or at least must be adequately blinded to the reference test results. Reports must adequately describe the methods of blinding, such as performing the index test and reference test in two different laboratories, or relabelling and changing the order of specimens to protect the blind. A further cause of bias in conduct or interpretation of the index test is the timing in which the threshold of detection is determined. If the threshold of detection is selected based on analysing the completed study results, this may overestimate test accuracy. Threshold of detection should be defined prior to collecting data, and this must be stated in the report. We observed 46 studies (46.9%) in which information was not provided to allow the reader to assess that the index test was performed without bias (unclear risk of bias).
Reference test risk of bias (QUADAS5)
Bias may be introduced in the reference test if the reference test is unlikely to correctly classify the condition, or if the reference test is interpreted with knowledge of the results of the index test. We observed 20 studies (20.8%) in which the risk of bias in this criterion was unclear. Reference tests for respiratory infections include culture and nucleic acid amplification tests. Culture tests may be influenced by the presence of normal respiratory flora, or collection after antibiotic treatment. POC tests for influenza were statistically more biased than other tests in this criterion.
Risk of bias pertaining to flow and timing (QUADAS7)
Patient flow must be well documented, including exclusions and missing data, as patients who are not included in the final analysis may differ significantly from those included. An acute respiratory infectious disease evolves quickly, and index and reference tests must be collected simultaneously. Any delay between index and reference test collection may cause the natural disease progression to change the results and thus the performance of the delayed test. We observed 17 studies (17.7%) with a high risk of bias in this criterion.
Fourteen of the 30 STARD 2015 criteria demonstrated compliance among <25% of the reports. Criterion 14 (definition and rationale for test positivity cut-offs or result categories of the reference standard, distinguishing pre-specified from exploratory) may be less relevant to qualitative reference standard tests. Criteria 15 and 16 (whether clinical information and reference standard results were available to the performers of the index test, whether clinical information and index test were available to the assessors of the reference standard) address blinding, which is not commonly included in the diagnostic study designs, although expected in the treatment trial designs. Criteria 18 and 19 (how indeterminate index test or reference standard results were handled, how missing data on the index test or reference standard were handled) is particularly important in the analysis, since indeterminate results should be considered missing data, and missing data may bias conclusions.
Criterion 20 (any analysis of variability in diagnostic accuracy distinguishing pre-specified from exploratory) addresses test repeatability, which was generally not performed in the diagnostic studies we examined. Criterion 21 (intended sample size and how it was determined) reflects appropriate study planning to determine statistical power. Criterion 22 (flow of participants, using a diagram) accounts for patients lost to follow-up or excluded, which represent missing data. Criteria 24 and 25 (distribution of severity of disease in those with the target condition, distribution of alternate diagnoses in those without the target condition) address generalisability assessment. Criterion 26 (time interval and any clinical interventions between index test and reference standard) allows the reader to assess the risk that the patient's condition changed between index and reference test application. Criterion 29 (any adverse events from performing the index test or reference standard) was not reported by a single study. It is not generally suspected that the application of a diagnostic test should cause patient harm, however it is possible. Criterion 32 (registration number and name of registry) indicates transparency in design and reporting.
Many of the STARD 2015 reporting shortfalls previously noted [Reference Fontela13, Reference Jafari14] are still lacking in this study, including lack of reporting of blinding for index and reference test execution, reporting of indeterminate and missing data, flow of participants and reporting of withdrawals, and distribution of severity of disease and alternative diagnoses [Reference Fontela13, Reference Jafari14]. Therefore, despite updated criteria, there continues to be weak reporting of POC diagnostic studies for respiratory pathogens. This may be due to perceived lack of utility of reporting, or purposeful omission to enhance the perceived impact of the results. Continued weak adherence to STARD 2015 over included years from 2004 to 2015 enhances the findings by Wilczynski, which noted no change in quality, despite the publication of STARD [Reference Wilczynski15].
This study reports on the studies of diagnostic accuracy for respiratory infections and indicates that there are many areas of reporting that fail to meet the outlined criteria. This has never been reported among tests for these pathogens. More stringent reporting requirements from journals, including reporting of the STARD 2015 criteria flowcharts in the methodology sections, may enhance the quality of published works.
Strengths of this study include reporting on POC tests in current use for common respiratory pathogens, and a comprehensive review of literature using broad search terms, which is believed to include all potential studies in the specified period at the time of data abstraction. However, some studies may not have been detected by the search terms. Additional limitations of the study include restriction of data abstraction to studies in English only, as well as the subjective nature of interpretation of the QUADAS-2 criteria.
Future research may include quality assessments of reports of conventional diagnostic tests in microbiology, for which fewer and older studies are available.
Acknowledgements
Thank you to the staff at the Health Sciences Library, Memorial University, St. John's NL for their help in article collection, and to Zhiwei Gao PhD for review of content and suggestions. MH received a Summer Undergraduate Research Award for medical students from the Memorial University of Newfoundland.
Author contributions
MH: preliminary literature search, primary screen, secondary screen and data abstraction, data analysis, creation and amendment of manuscript. SB: data abstraction. CP: data abstraction. PD: review of data discrepancies, amendment and review of manuscript, and data analysis.
Declaration of Interest
None.


